| Param | Original file | Final file |
|---|---|---|
| Filename | modeM0/AS1A05_097T01_9000004936_34548cztM0_level2.evt | modeM0/AS1A05_097T01_9000004936_34548cztM0_level2_quad_clean.evt |
| Size (bytes) | 477,146,880 | 70,381,440 |
| Size | 455.0 MB | 67.1 MB |
| Events in quadrant A | 2,685,806 | 439,146 |
| Events in quadrant B | 3,669,660 | 439,531 |
| Events in quadrant C | 2,929,423 | 445,263 |
| Events in quadrant D | 4,785,236 | 414,909 |
| Mode M0 | |||
|---|---|---|---|
| Quadrant | BADHDUFLAG | Total packets | Discarded packets |
| A | 0 | 11480 | 3 |
| B | 0 | 14364 | 2 |
| C | 0 | 11887 | 2 |
| D | 0 | 18221 | 2 |
| Mode SS | |||
|---|---|---|---|
| Quadrant | BADHDUFLAG | Total packets | Discarded packets |
| A | 0 | 114 | 0 |
| B | 0 | 114 | 0 |
| C | 0 | 114 | 0 |
| D | 0 | 114 | 0 |
| Mode M9 | |||
|---|---|---|---|
| Quadrant | BADHDUFLAG | Total packets | Discarded packets |
| A | 0 | 25 | 0 |
| B | 0 | 25 | 0 |
| C | 0 | 25 | 0 |
| D | 0 | 26 | 0 |
| Quadrant | Total seconds | Saturated seconds | Saturation percentage |
|---|---|---|---|
| A | 5608 | 8 | 0.142653% |
| B | 5608 | 287 | 5.117689% |
| C | 5608 | 8 | 0.142653% |
| D | 5608 | 150 | 2.674750% |
Noise dominated data is calculated using 1-second bins in cleaned event files. If a bin has >2000 counts, and if more than 50% of those come from <1% of pixels, then it is considered to be noise-dominated and hence unusable.
| Quadrant | # 1 sec bins | Bins with >0 counts | Bins with >2000 counts | High rate bins dominated by noise | Noise dominated (total time) | Noise dominated (detector-on time) | Marked lightcurve |
|---|---|---|---|---|---|---|---|
| A | 7311 | 5609 | 3 | 3 | 0.04% | 0.05% | 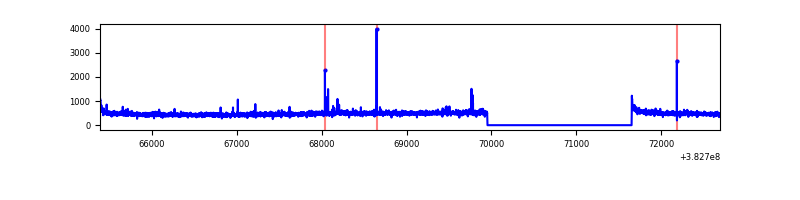 |
| B | 7311 | 5609 | 206 | 206 | 2.82% | 3.67% | 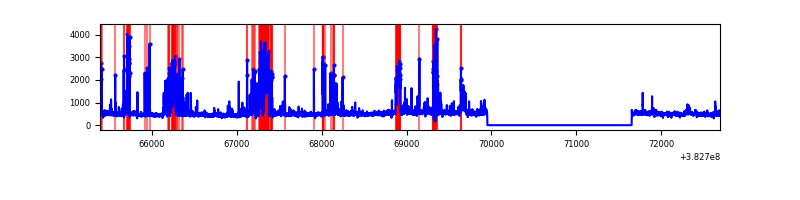 |
| C | 7311 | 5609 | 5 | 5 | 0.07% | 0.09% | 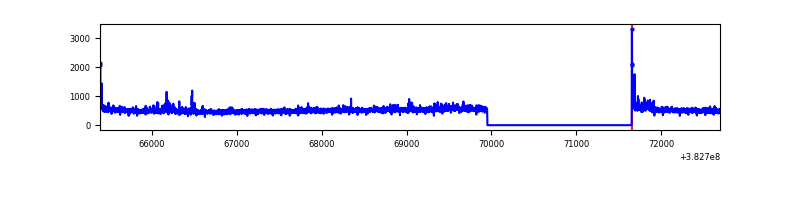 |
| D | 7311 | 5609 | 118 | 118 | 1.61% | 2.10% | 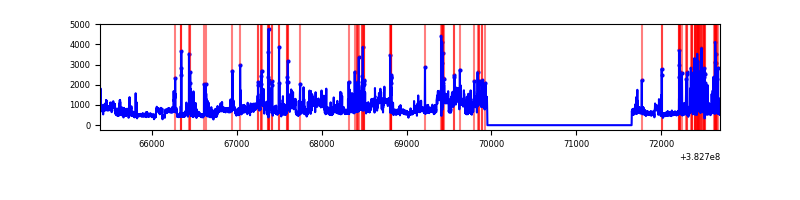 |
Top three noisy pixels from each quadrant. If the there are fewer than three noisy pixels in the level2.evt file, extra rows are filled as -1
| Pixel properties | Quadrant properties | ||||||
|---|---|---|---|---|---|---|---|
| Quadrant | DetID | PixID | Counts | Sigma | Mean | Median | Sigma |
| A | 10 | 83 | 41240 | 299.72 | 672 | 659 | 135.4 |
| A | 9 | 143 | 28042 | 202.24 | 672 | 659 | 135.4 |
| A | 13 | 254 | 8961 | 61.32 | 672 | 659 | 135.4 |
| B | 5 | 172 | 873232 | 6916.54 | 650 | 632 | 126.2 |
| B | 4 | 81 | 49019 | 383.53 | 650 | 632 | 126.2 |
| B | 15 | 85 | 47510 | 371.57 | 650 | 632 | 126.2 |
| C | 15 | 214 | 246491 | 1617.51 | 652 | 656 | 152.0 |
| C | 14 | 67 | 97330 | 636.08 | 652 | 656 | 152.0 |
| C | 0 | 10 | 40550 | 262.49 | 652 | 656 | 152.0 |
| D | 8 | 195 | 1338145 | 8434.23 | 648 | 630 | 158.6 |
| D | 2 | 250 | 422695 | 2661.5 | 648 | 630 | 158.6 |
| D | 12 | 17 | 228619 | 1437.68 | 648 | 630 | 158.6 |
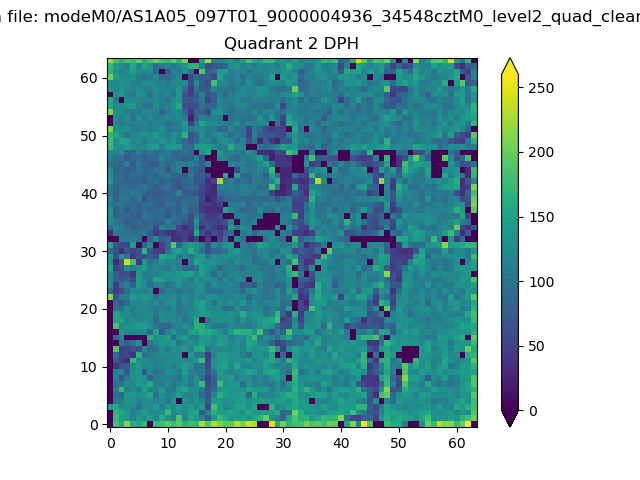
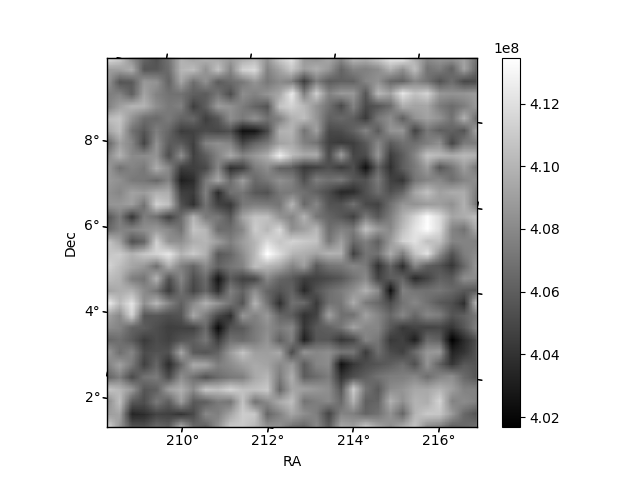
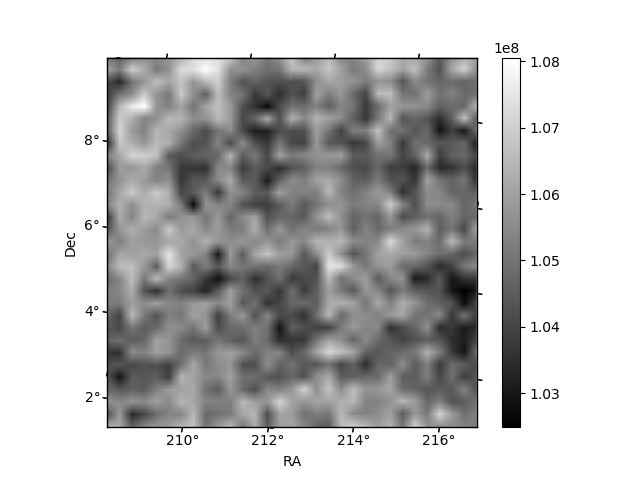
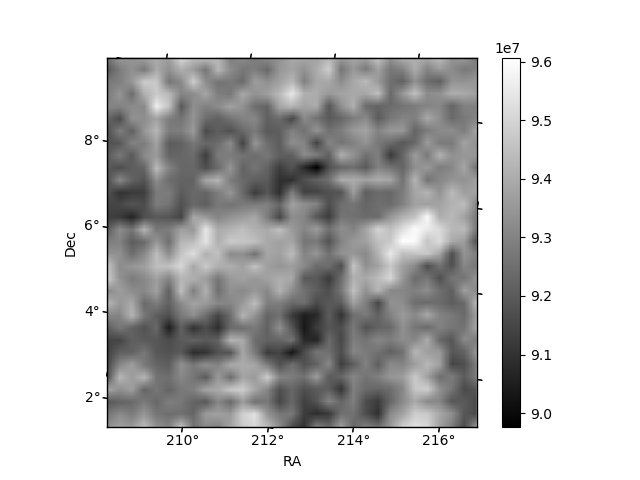
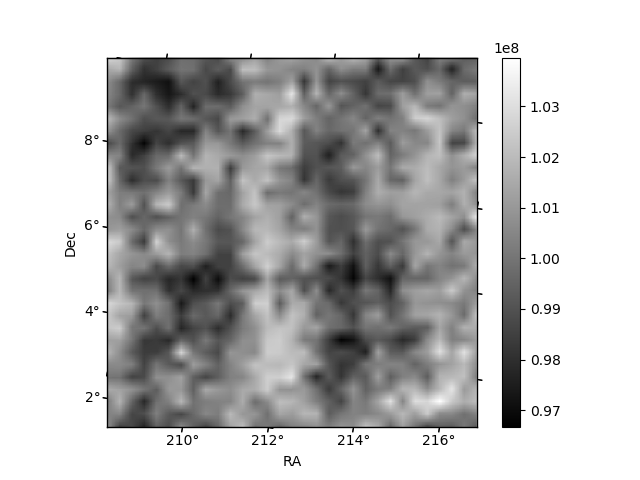
Histogram calculated using DETX and DETY for each event in the final _common_clean file
| Quadrant A | 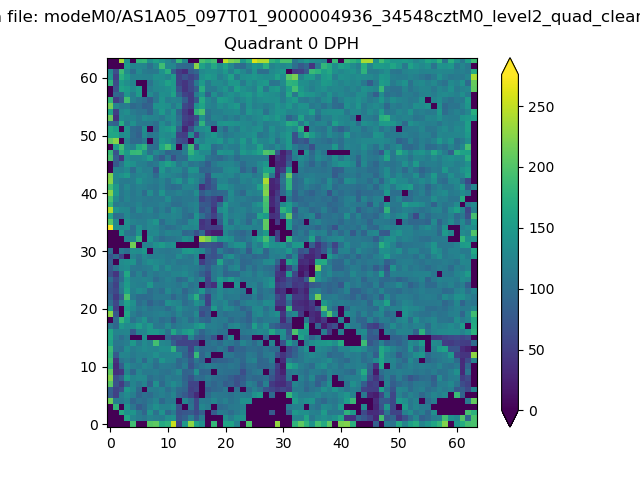 |
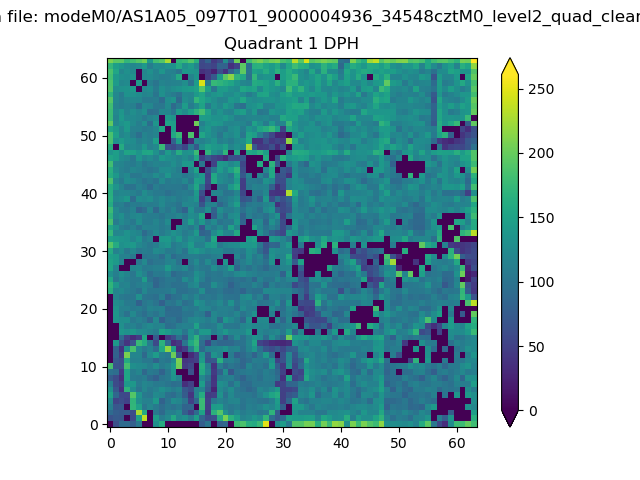 |
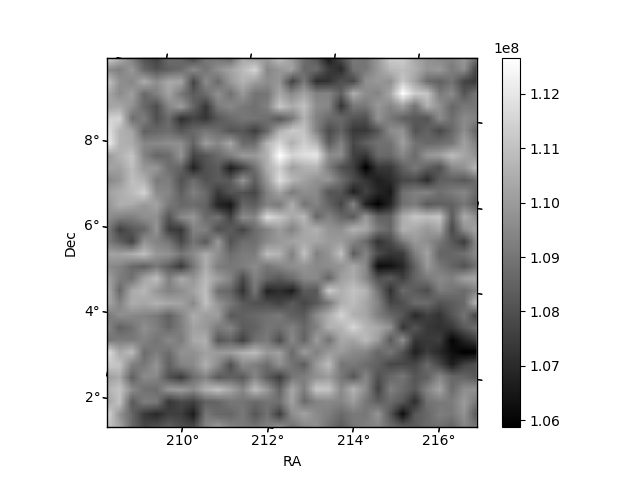
Quadrant B |
|---|---|---|---|
| Quadrant D | 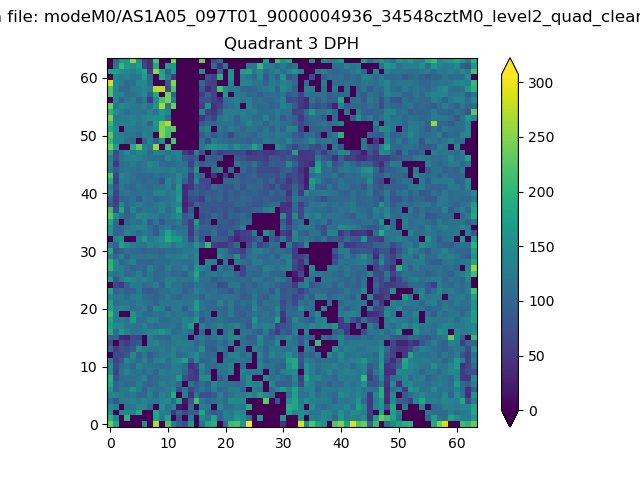 |
 |
Quadrant C |
| Plot type | Count rate plots | Images |
|---|---|---|
| Comparison with Poisson distribution Blue bars denote a histogram of data divided into 1 sec bins. Red curve is a Poisson curve with rate = median count rate of data. |
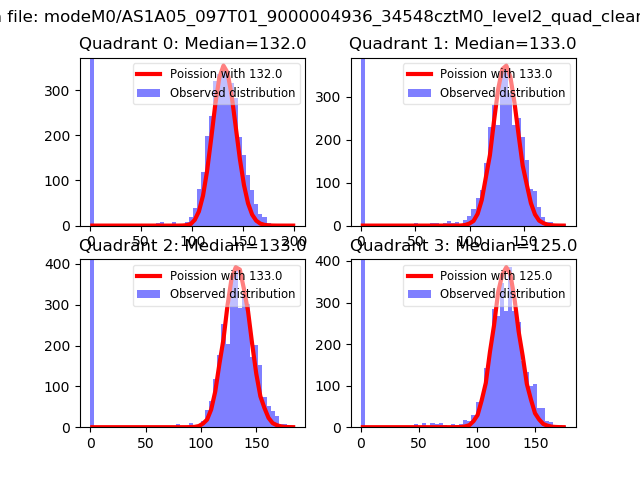 |
 |
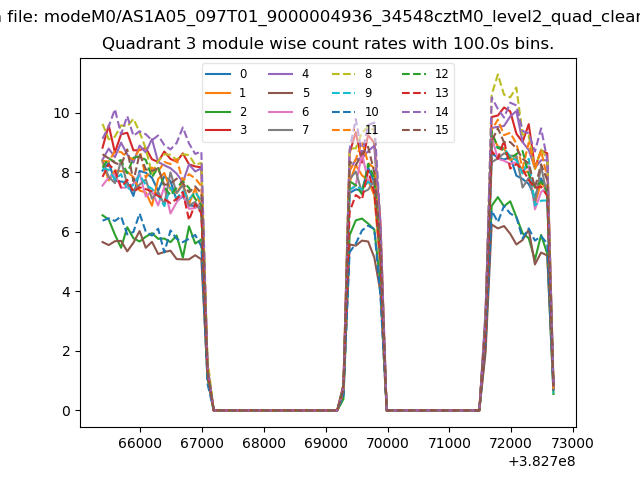
| Quadrant-wise count rates Data is divided into 100 sec bins |
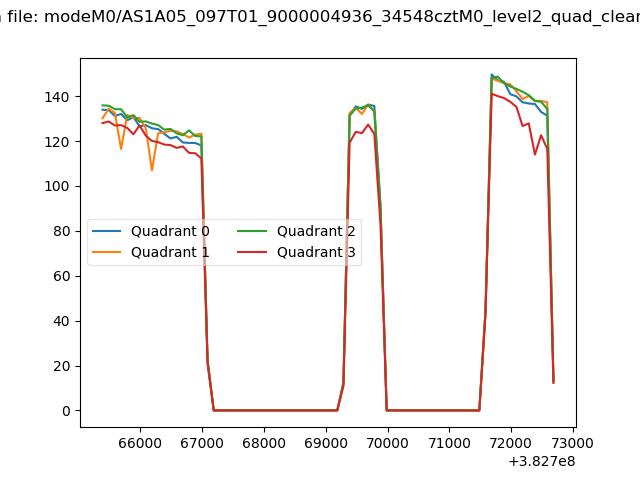 |
|
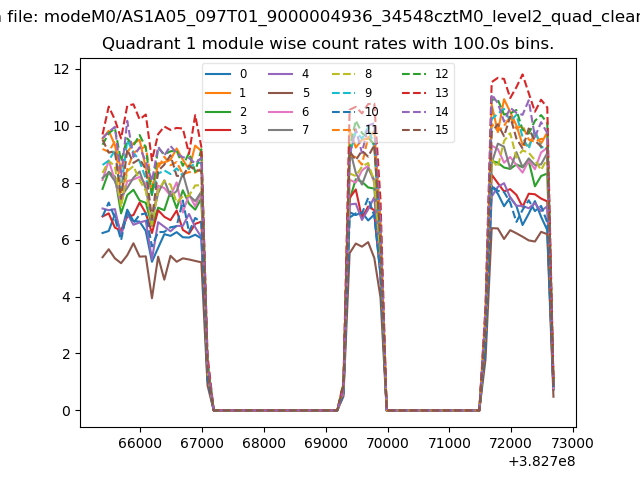
| Module-wise count rates for Quadrant A Data is divided into 100 sec bins |
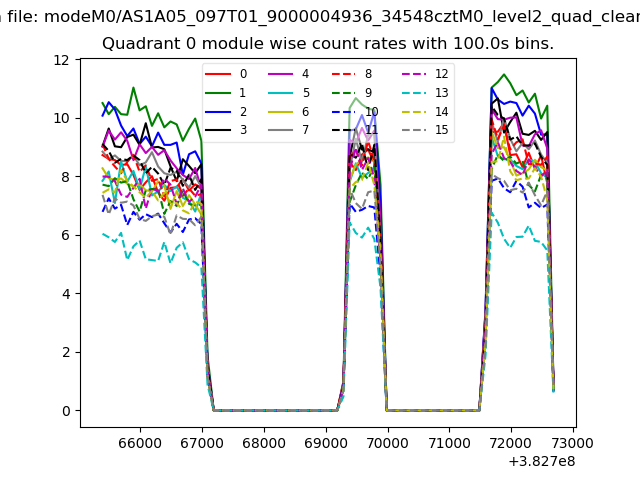 |
 |
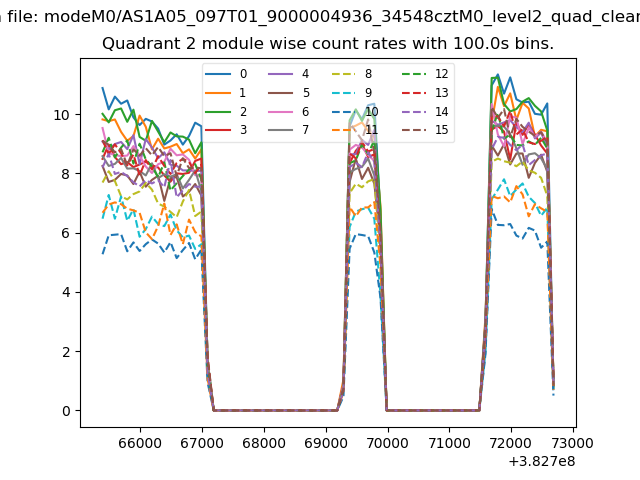
| Module-wise count rates for Quadrant B Data is divided into 100 sec bins |
 |
 |
| Module-wise count rates for Quadrant C Data is divided into 100 sec bins |
 |
 |
| Module-wise count rates for Quadrant D Data is divided into 100 sec bins |
 |
 |
| Parameter | Plot |
|---|---|
| CZT HV Monitor | 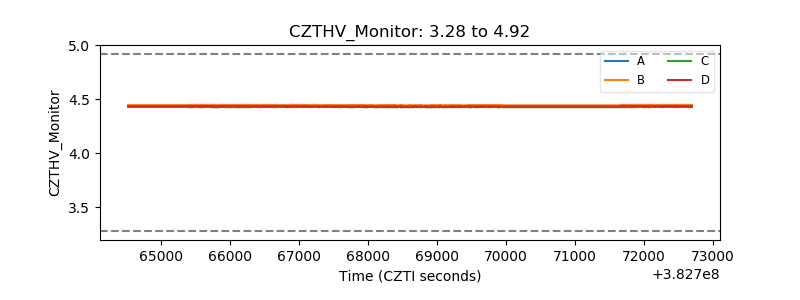 |
| D_VDD | 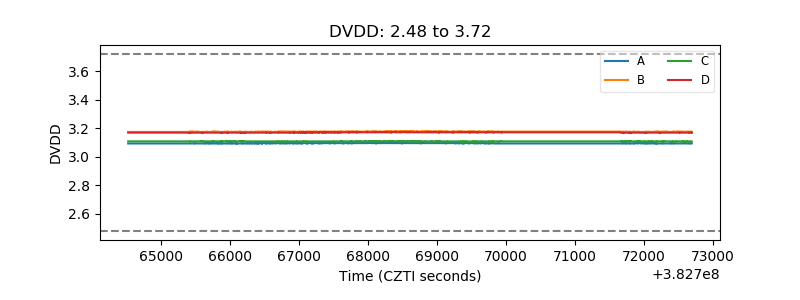 |
| Temperature 1 | 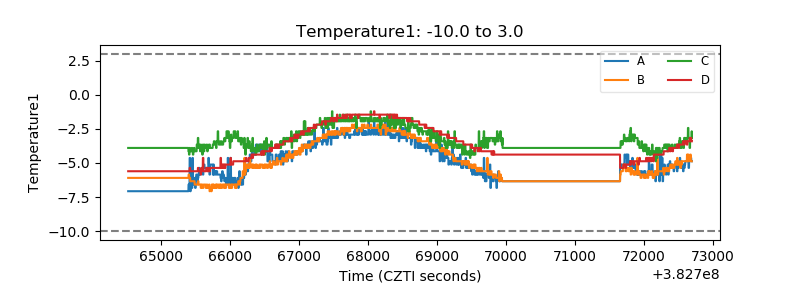 |
| Veto HV Monitor | 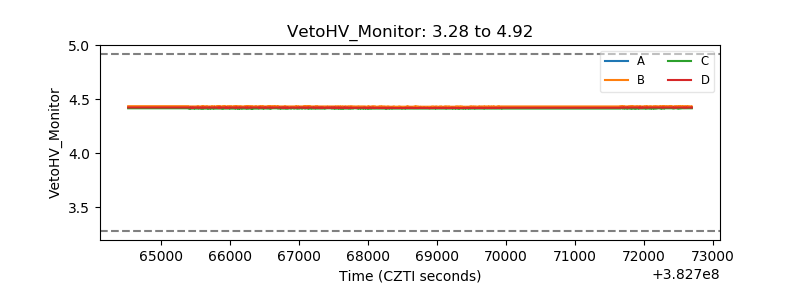 |
| Veto LLD | 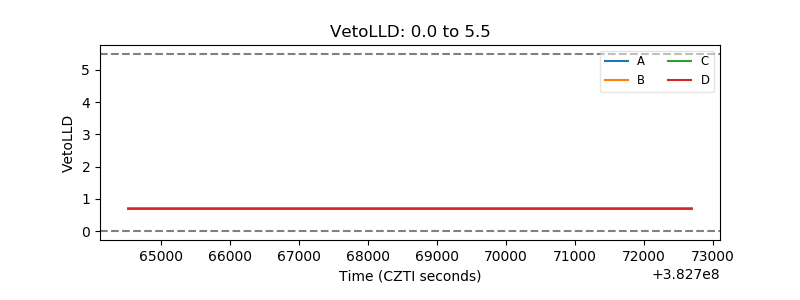 |
| Alpha Counter | 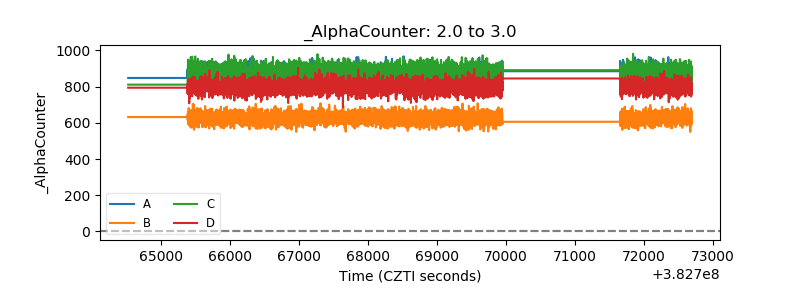 |
| _CPM_Rate | 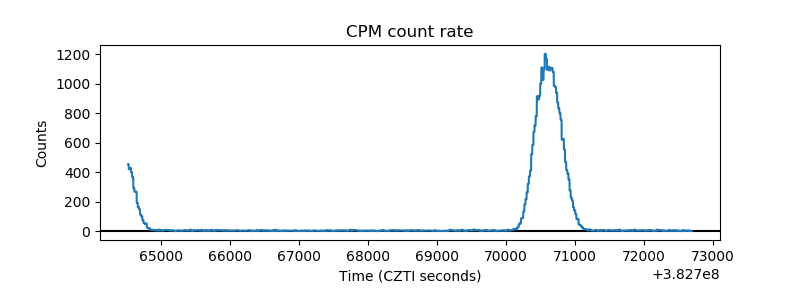 |
| CZT Counter | 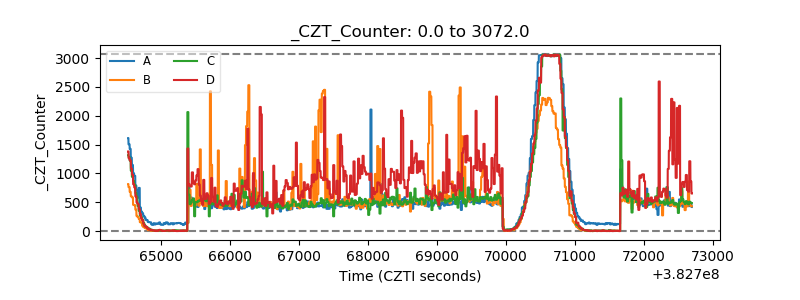 |
| +2.5 Volts monitor | 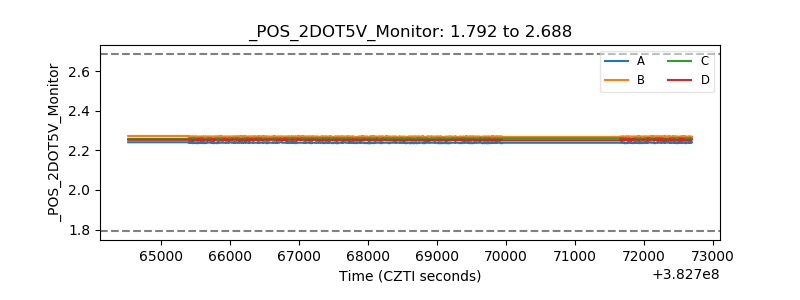 |
| +5 Volts monitor | 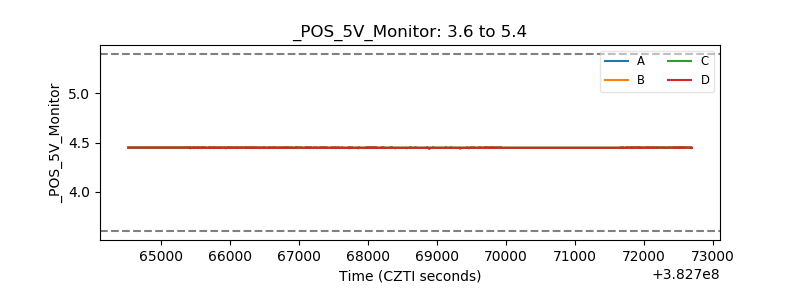 |
| _ROLL_ROT | 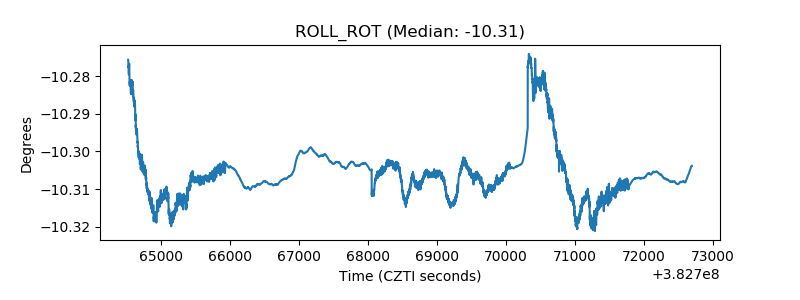 |
| _Roll_DEC | 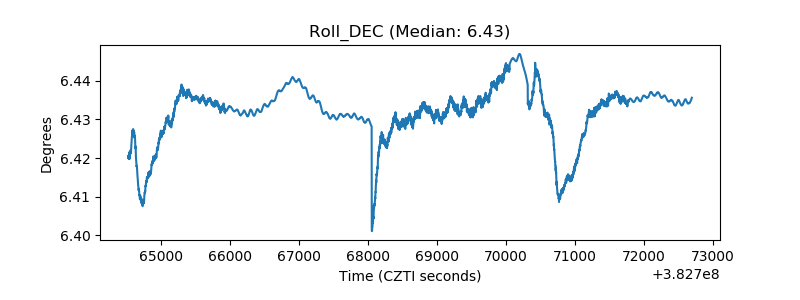 |
| _Roll_RA | 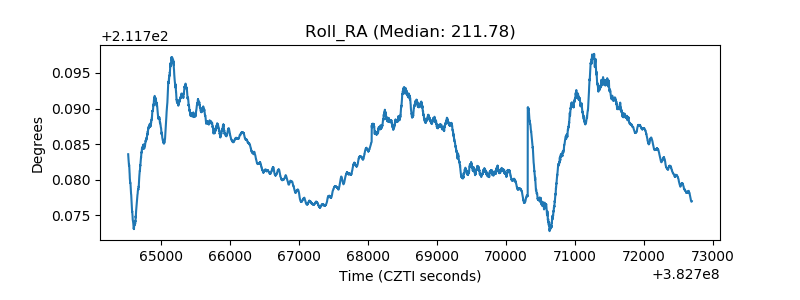 |
| Veto Counter | 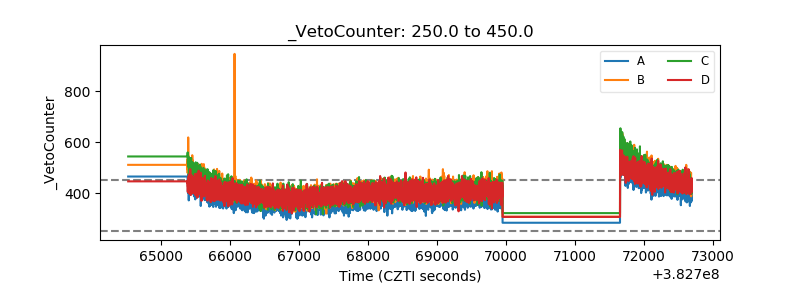 |