| Param | Original file | Final file |
|---|---|---|
| Filename | modeM0/AS1A05_097T01_9000004936cztM0_level2_bc.evt | modeM0/AS1A05_097T01_9000004936cztM0_level2_quad_clean.evt |
| Size (bytes) | 1,485,023,040 | 277,012,800 |
| Size | 1.4 GB | 264.2 MB |
| Events in quadrant A | 6,370,402 | 1,657,471 |
| Events in quadrant B | 9,698,156 | 1,625,183 |
| Events in quadrant C | 7,644,655 | 1,665,085 |
| Events in quadrant D | 19,387,302 | 1,548,749 |
| Mode M0 | |||
|---|---|---|---|
| Quadrant | BADHDUFLAG | Total packets | Discarded packets |
| A | 0 | 57473 | 0 |
| B | 0 | 72772 | 0 |
| C | 0 | 60348 | 0 |
| D | 0 | 102805 | 0 |
| Mode SS | |||
|---|---|---|---|
| Quadrant | BADHDUFLAG | Total packets | Discarded packets |
| A | 0 | 560 | 0 |
| B | 0 | 560 | 0 |
| C | 0 | 560 | 0 |
| D | 0 | 560 | 0 |
| Mode M9 | |||
|---|---|---|---|
| Quadrant | BADHDUFLAG | Total packets | Discarded packets |
| A | 0 | 106 | 0 |
| B | 0 | 105 | 0 |
| C | 0 | 105 | 0 |
| D | 0 | 106 | 0 |
| Quadrant | Total seconds | Saturated seconds | Saturation percentage |
|---|---|---|---|
| A | 27538 | 69 | 0.250563% |
| B | 27538 | 1565 | 5.683056% |
| C | 27538 | 57 | 0.206987% |
| D | 27538 | 1465 | 5.319922% |
Noise dominated data is calculated using 1-second bins in cleaned event files. If a bin has >2000 counts, and if more than 50% of those come from <1% of pixels, then it is considered to be noise-dominated and hence unusable.
| Quadrant | # 1 sec bins | Bins with >0 counts | Bins with >2000 counts | High rate bins dominated by noise | Noise dominated (total time) | Noise dominated (detector-on time) | Marked lightcurve |
|---|---|---|---|---|---|---|---|
| A | 38177 | 27543 | 6 | 6 | 0.02% | 0.02% | 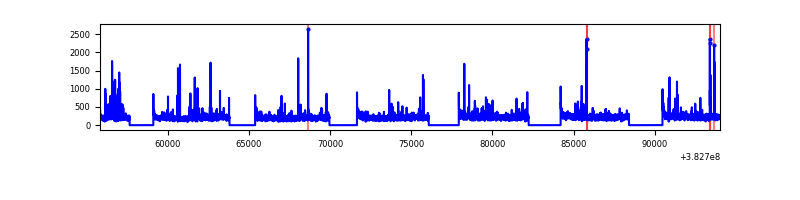 |
| B | 38177 | 27538 | 86 | 86 | 0.23% | 0.31% | 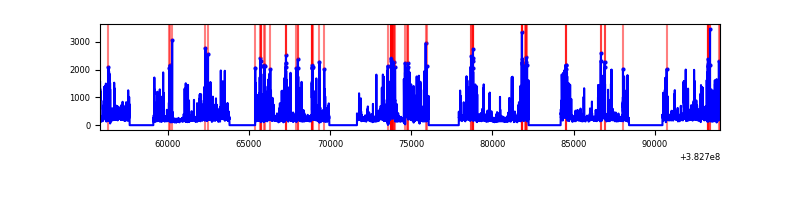 |
| C | 38177 | 27539 | 8 | 8 | 0.02% | 0.03% | 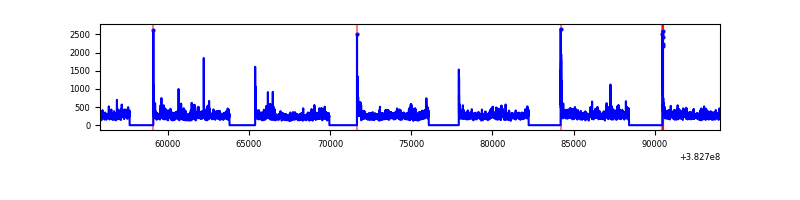 |
| D | 38177 | 27538 | 185 | 185 | 0.48% | 0.67% | 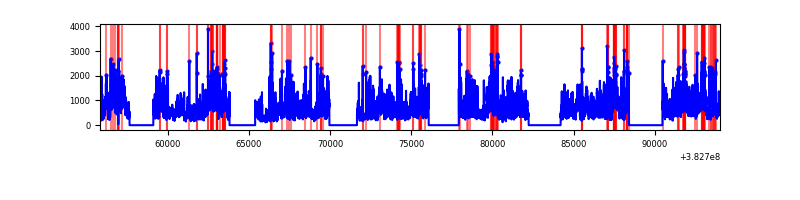 |
Top three noisy pixels from each quadrant. If the there are fewer than three noisy pixels in the level2.evt file, extra rows are filled as -1
| Pixel properties | Quadrant properties | ||||||
|---|---|---|---|---|---|---|---|
| Quadrant | DetID | PixID | Counts | Sigma | Mean | Median | Sigma |
| A | 9 | 143 | 229783 | 689.55 | 1526 | 1505 | 331.1 |
| A | 10 | 83 | 135475 | 404.68 | 1526 | 1505 | 331.1 |
| A | 13 | 6 | 47959 | 140.32 | 1526 | 1505 | 331.1 |
| B | 5 | 172 | 3164256 | 11029.51 | 1487 | 1457 | 286.8 |
| B | 0 | 245 | 206186 | 713.94 | 1487 | 1457 | 286.8 |
| B | 15 | 85 | 87568 | 300.29 | 1487 | 1457 | 286.8 |
| C | 15 | 214 | 1119377 | 3341.18 | 1492 | 1481 | 334.6 |
| C | 14 | 67 | 523719 | 1560.87 | 1492 | 1481 | 334.6 |
| C | 0 | 10 | 132405 | 391.31 | 1492 | 1481 | 334.6 |
| D | 8 | 195 | 8838826 | 25336.96 | 1477 | 1430 | 348.8 |
| D | 2 | 250 | 1389404 | 3979.34 | 1477 | 1430 | 348.8 |
| D | 12 | 17 | 935777 | 2678.79 | 1477 | 1430 | 348.8 |
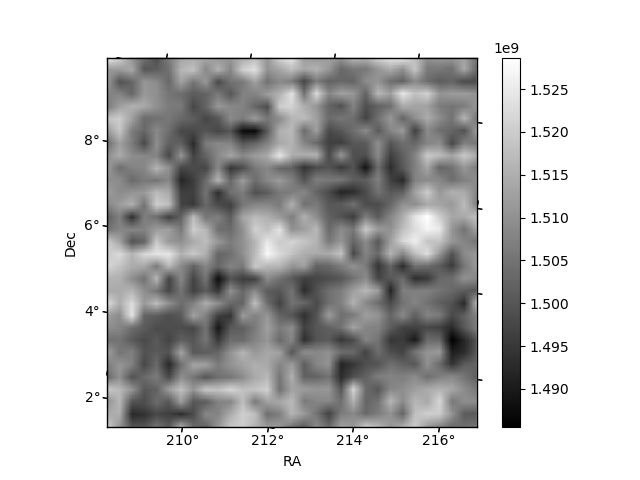
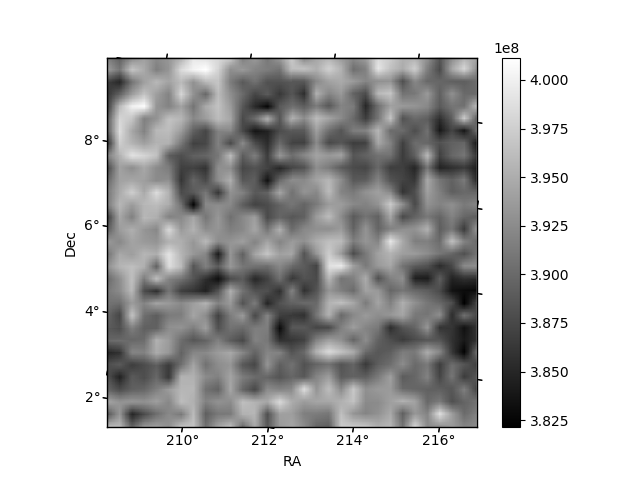
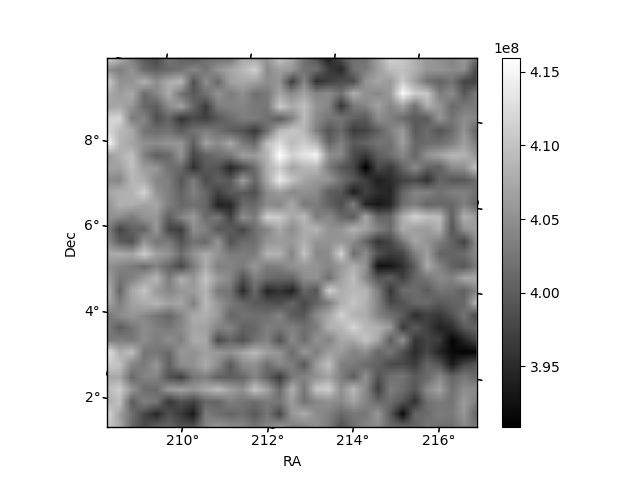
Histogram calculated using DETX and DETY for each event in the final _common_clean file
| Quadrant A | 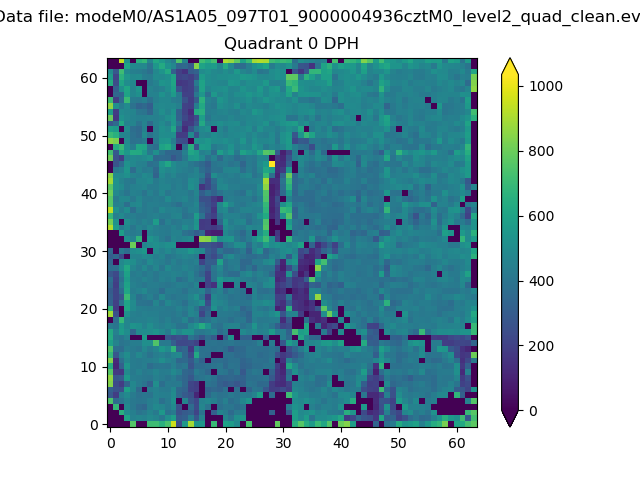 |
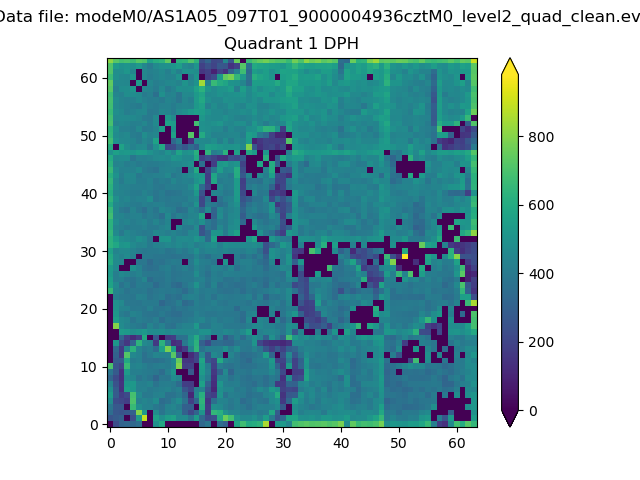 |
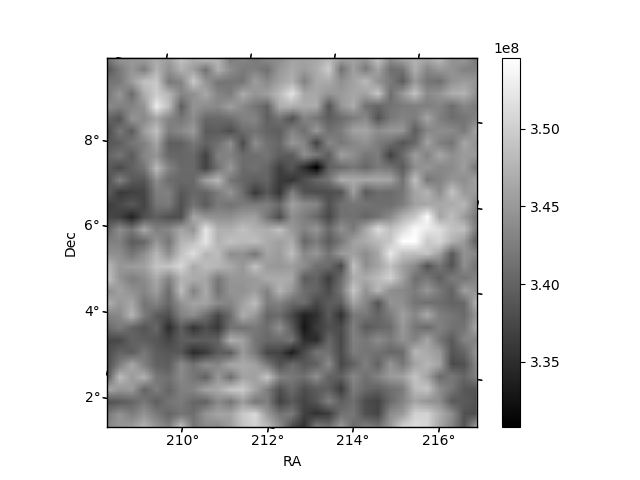
Quadrant B |
|---|---|---|---|
| Quadrant D | 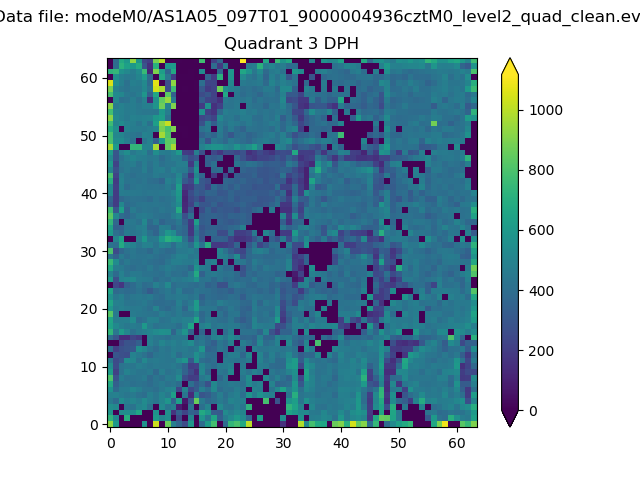 |
 |
Quadrant C |
| Plot type | Count rate plots | Images |
|---|---|---|
| Comparison with Poisson distribution Blue bars denote a histogram of data divided into 1 sec bins. Red curve is a Poisson curve with rate = median count rate of data. |
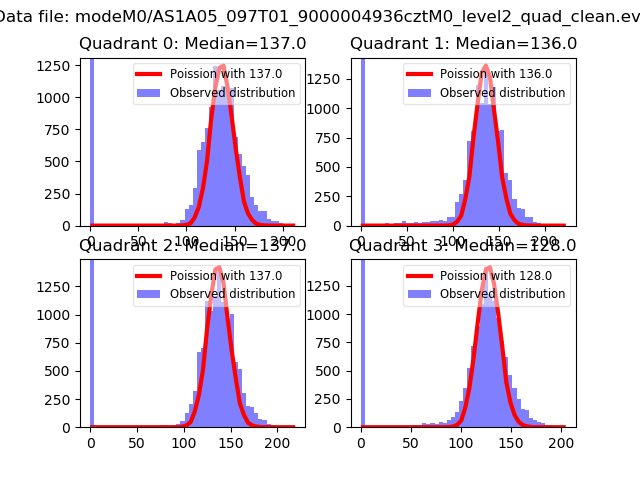 |
 |
| Quadrant-wise count rates Data is divided into 100 sec bins |
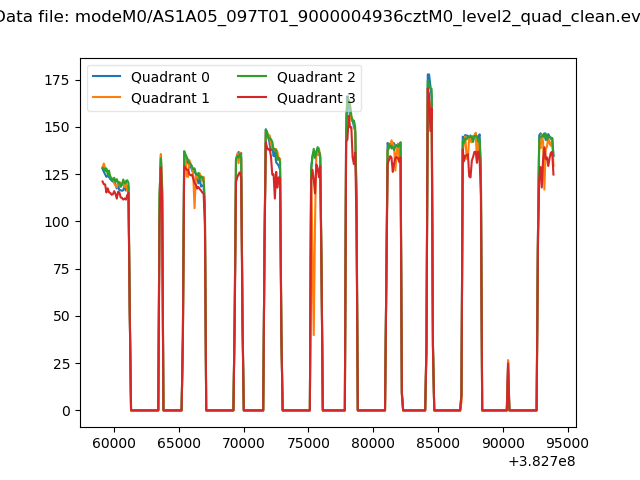 |
|
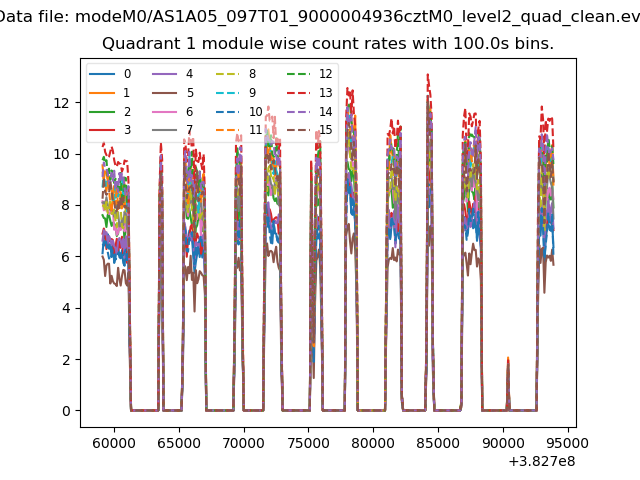
| Module-wise count rates for Quadrant A Data is divided into 100 sec bins |
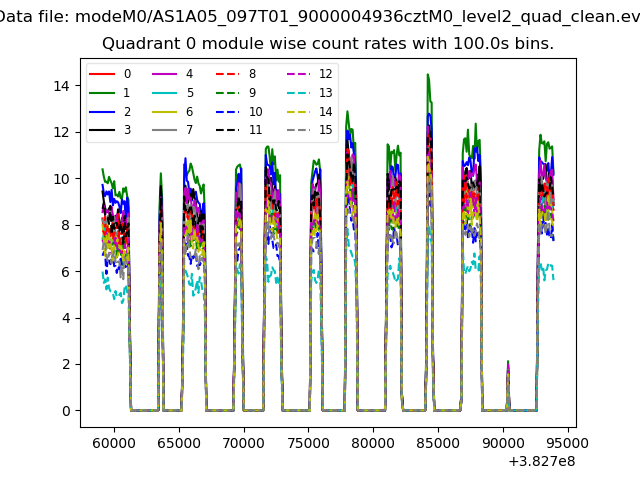 |
 |
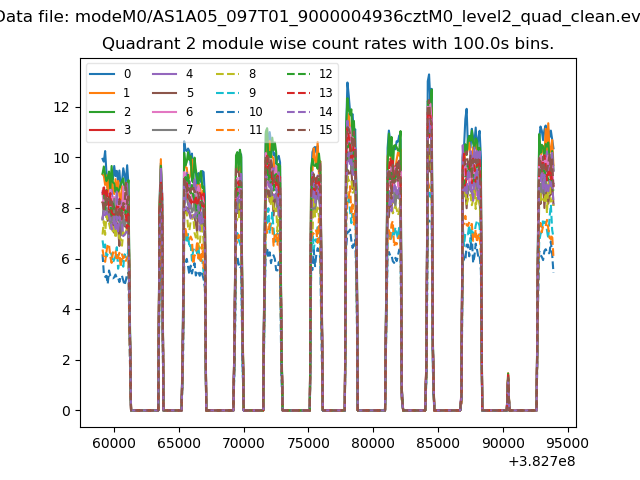
| Module-wise count rates for Quadrant B Data is divided into 100 sec bins |
 |
 |
| Module-wise count rates for Quadrant C Data is divided into 100 sec bins |
 |
 |
| Module-wise count rates for Quadrant D Data is divided into 100 sec bins |
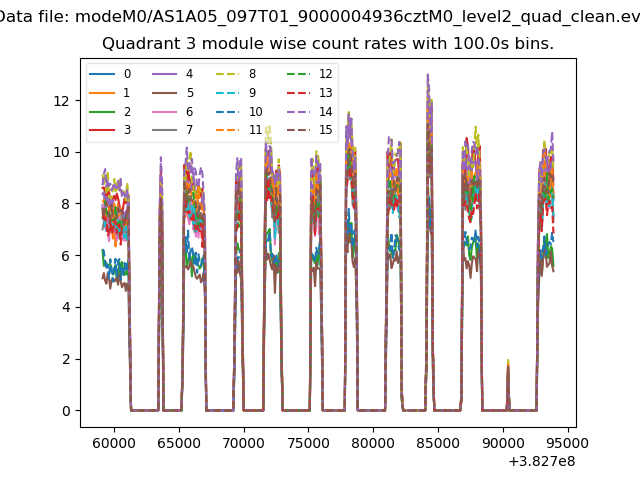 |
 |
| Parameter | Plot |
|---|---|
| CZT HV Monitor | 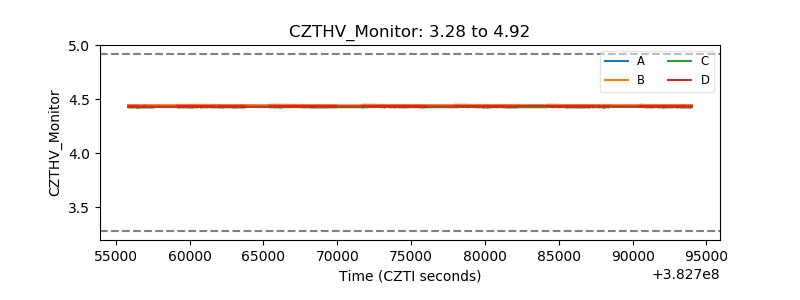 |
| D_VDD | 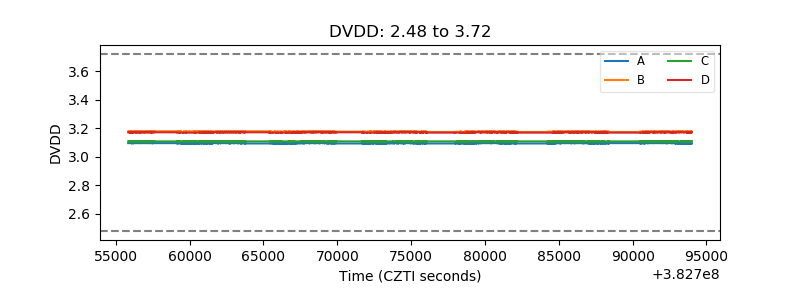 |
| Temperature 1 | 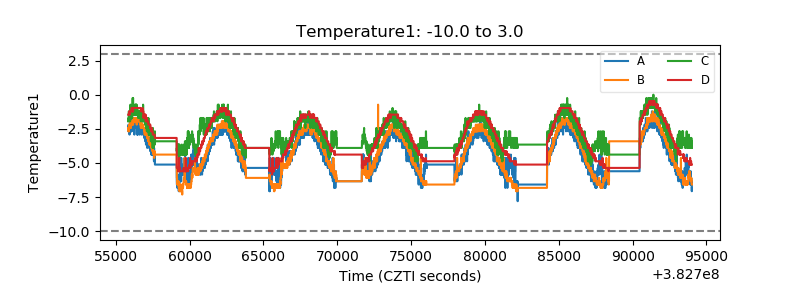 |
| Veto HV Monitor | 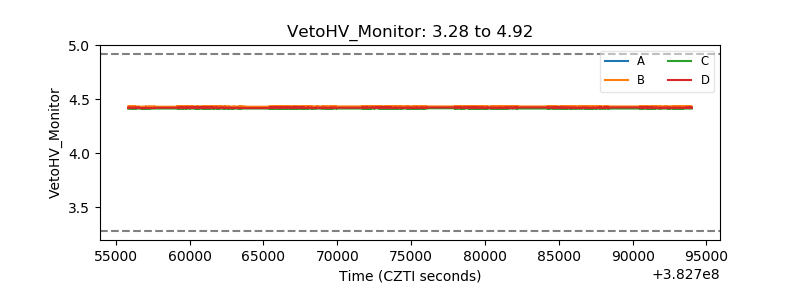 |
| Veto LLD | 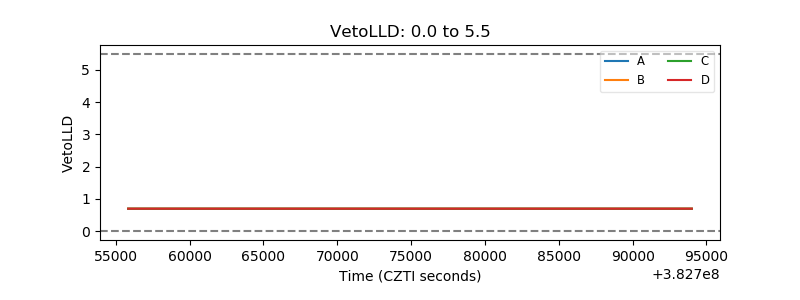 |
| Alpha Counter | 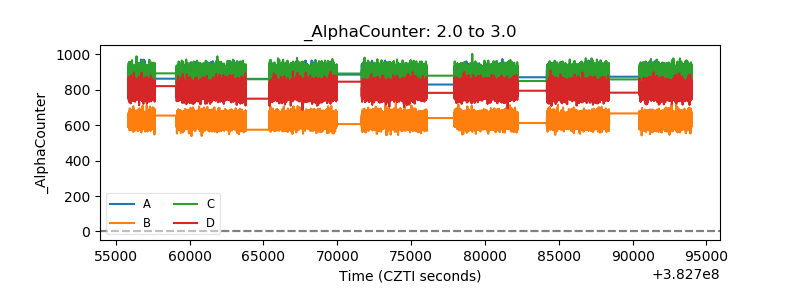 |
| _CPM_Rate | 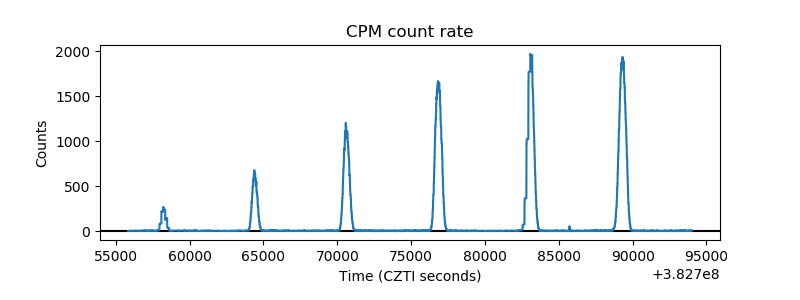 |
| CZT Counter | 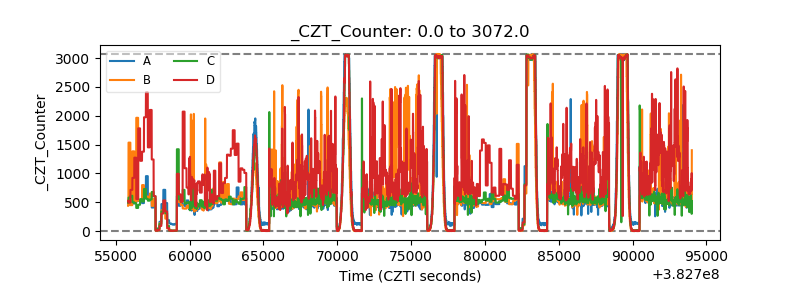 |
| +2.5 Volts monitor | 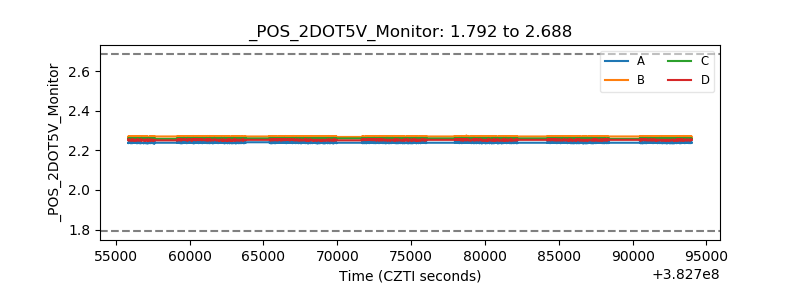 |
| +5 Volts monitor | 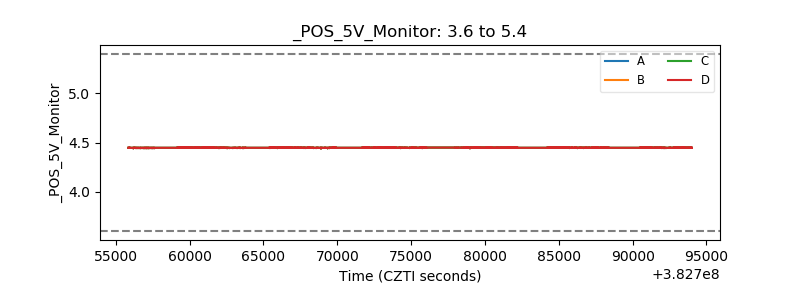 |
| _ROLL_ROT | 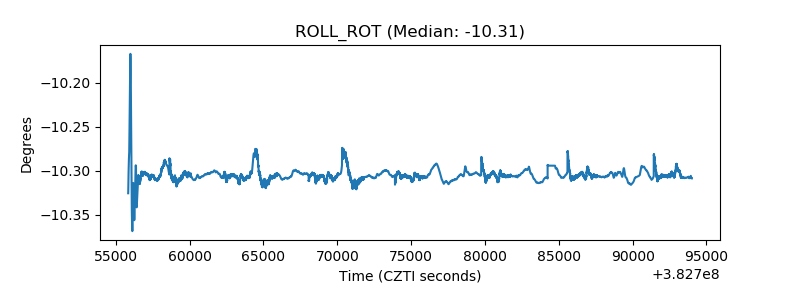 |
| _Roll_DEC | 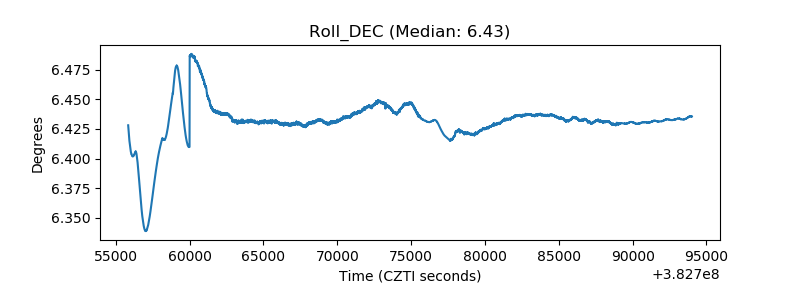 |
| _Roll_RA | 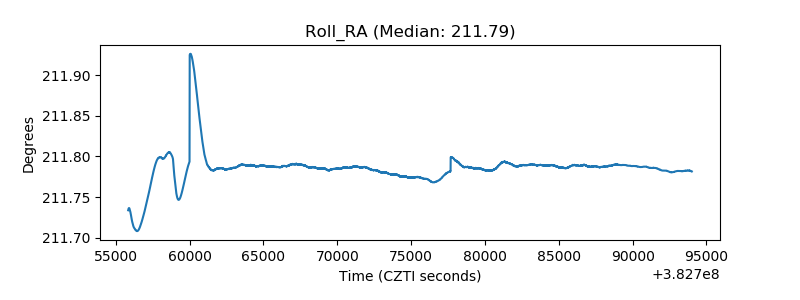 |
| Veto Counter | 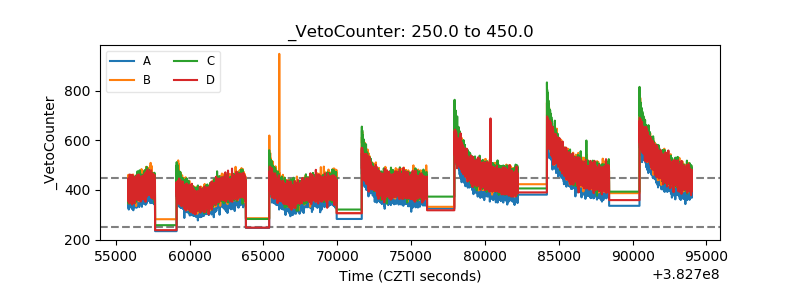 |