| Param | Original file | Final file |
|---|---|---|
| Filename | modeM0/AS1A05_115T02_9000004934_34547cztM0_level2.evt | modeM0/AS1A05_115T02_9000004934_34547cztM0_level2_quad_clean.evt |
| Size (bytes) | 956,030,400 | 158,339,520 |
| Size | 911.7 MB | 151.0 MB |
| Events in quadrant A | 5,689,413 | 990,148 |
| Events in quadrant B | 6,755,611 | 996,486 |
| Events in quadrant C | 6,147,194 | 1,006,039 |
| Events in quadrant D | 9,527,888 | 950,012 |
| Mode SS | |||
|---|---|---|---|
| Quadrant | BADHDUFLAG | Total packets | Discarded packets |
| A | 0 | 250 | 0 |
| B | 0 | 250 | 0 |
| C | 0 | 250 | 0 |
| D | 0 | 250 | 0 |
| Mode M0 | |||
|---|---|---|---|
| Quadrant | BADHDUFLAG | Total packets | Discarded packets |
| A | 0 | 25497 | 3 |
| B | 0 | 28584 | 3 |
| C | 0 | 25926 | 3 |
| D | 0 | 36761 | 3 |
| Mode M9 | |||
|---|---|---|---|
| Quadrant | BADHDUFLAG | Total packets | Discarded packets |
| A | 0 | 35 | 0 |
| B | 0 | 35 | 0 |
| C | 0 | 35 | 0 |
| D | 0 | 36 | 0 |
| Quadrant | Total seconds | Saturated seconds | Saturation percentage |
|---|---|---|---|
| A | 12339 | 36 | 0.291758% |
| B | 12339 | 293 | 2.374585% |
| C | 12339 | 30 | 0.243132% |
| D | 12339 | 196 | 1.588459% |
Noise dominated data is calculated using 1-second bins in cleaned event files. If a bin has >2000 counts, and if more than 50% of those come from <1% of pixels, then it is considered to be noise-dominated and hence unusable.
| Quadrant | # 1 sec bins | Bins with >0 counts | Bins with >2000 counts | High rate bins dominated by noise | Noise dominated (total time) | Noise dominated (detector-on time) | Marked lightcurve |
|---|---|---|---|---|---|---|---|
| A | 14994 | 12341 | 13 | 13 | 0.09% | 0.11% | 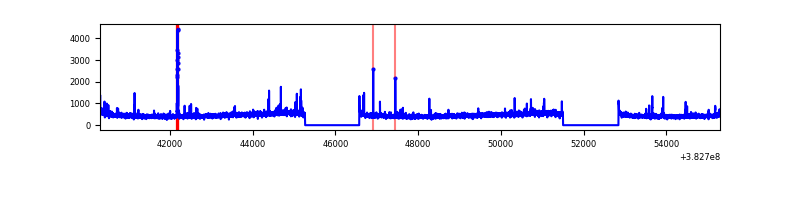 |
| B | 14994 | 12341 | 161 | 161 | 1.07% | 1.30% |  |
| C | 14994 | 12341 | 12 | 12 | 0.08% | 0.10% | 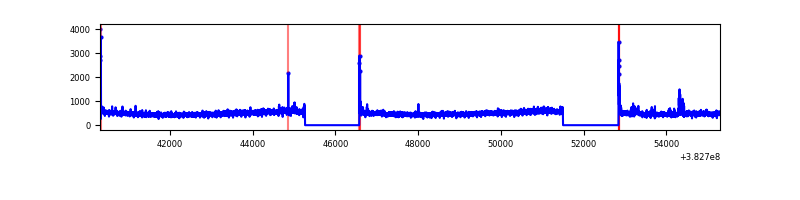 |
| D | 14994 | 12341 | 112 | 112 | 0.75% | 0.91% | 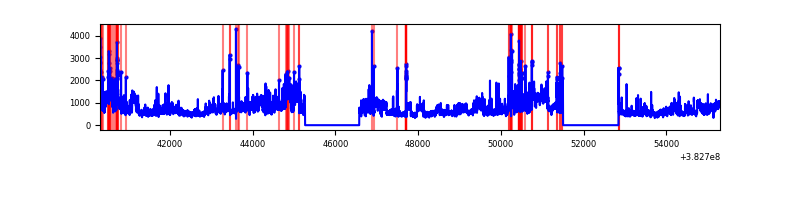 |
Top three noisy pixels from each quadrant. If the there are fewer than three noisy pixels in the level2.evt file, extra rows are filled as -1
| Pixel properties | Quadrant properties | ||||||
|---|---|---|---|---|---|---|---|
| Quadrant | DetID | PixID | Counts | Sigma | Mean | Median | Sigma |
| A | 9 | 143 | 136032 | 479.69 | 1405 | 1378 | 280.7 |
| A | 10 | 83 | 66266 | 231.16 | 1405 | 1378 | 280.7 |
| A | 10 | 255 | 24623 | 82.81 | 1405 | 1378 | 280.7 |
| B | 5 | 172 | 989992 | 3712.11 | 1389 | 1351 | 266.3 |
| B | 5 | 200 | 59888 | 219.79 | 1389 | 1351 | 266.3 |
| B | 4 | 232 | 55167 | 202.06 | 1389 | 1351 | 266.3 |
| C | 15 | 214 | 548480 | 1735.57 | 1366 | 1376 | 315.2 |
| C | 14 | 67 | 127850 | 401.21 | 1366 | 1376 | 315.2 |
| C | 0 | 10 | 80874 | 252.19 | 1366 | 1376 | 315.2 |
| D | 8 | 195 | 3150062 | 9441.1 | 1358 | 1321 | 333.5 |
| D | 1 | 52 | 340946 | 1018.32 | 1358 | 1321 | 333.5 |
| D | 7 | 223 | 161709 | 480.9 | 1358 | 1321 | 333.5 |
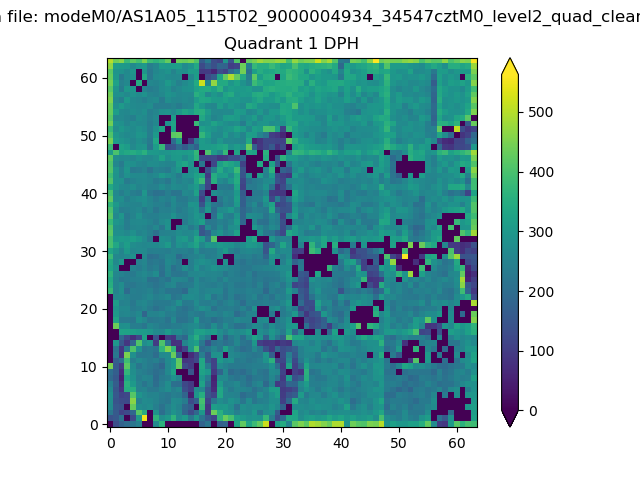
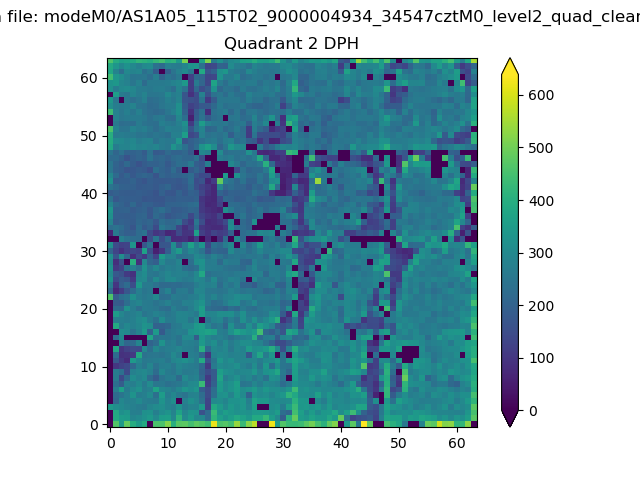
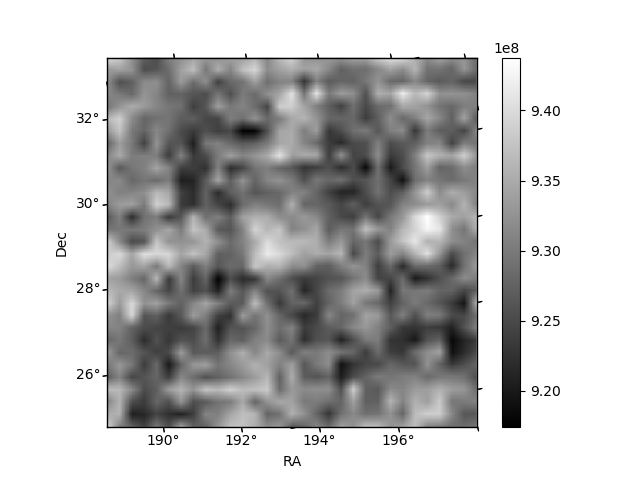
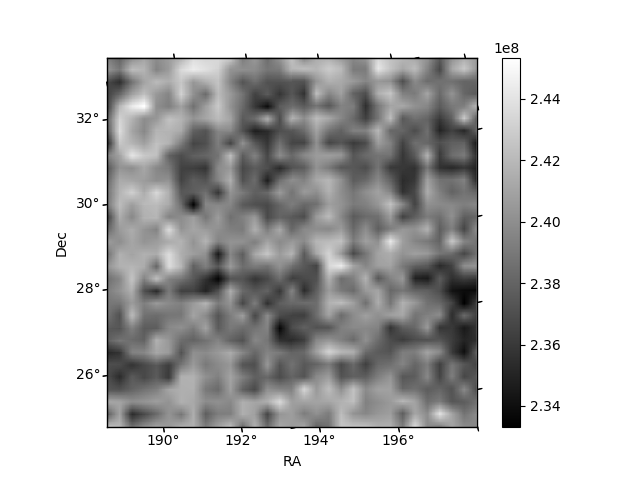
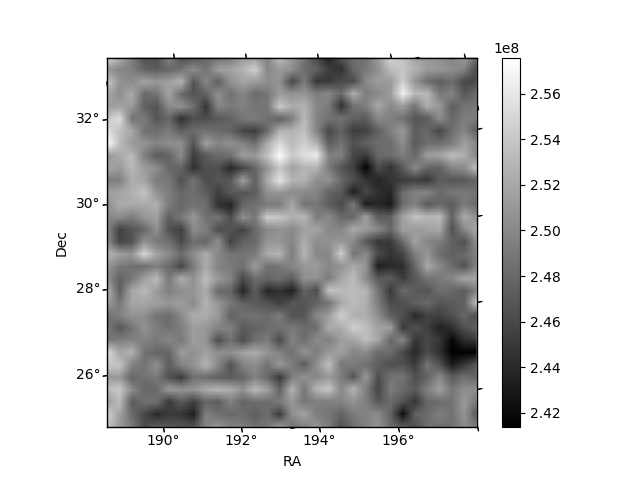
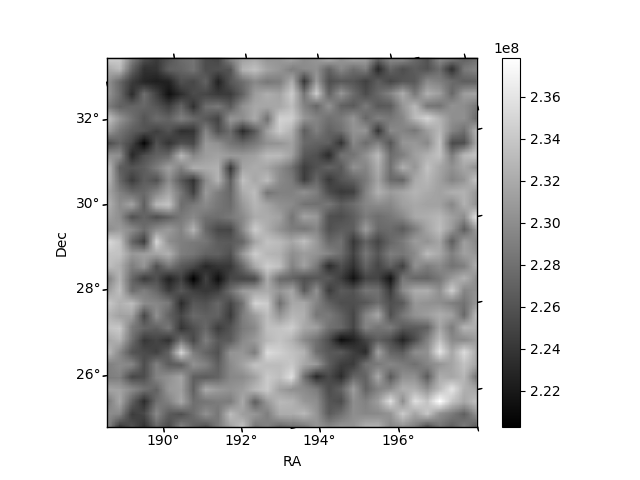
Histogram calculated using DETX and DETY for each event in the final _common_clean file
| Quadrant A | 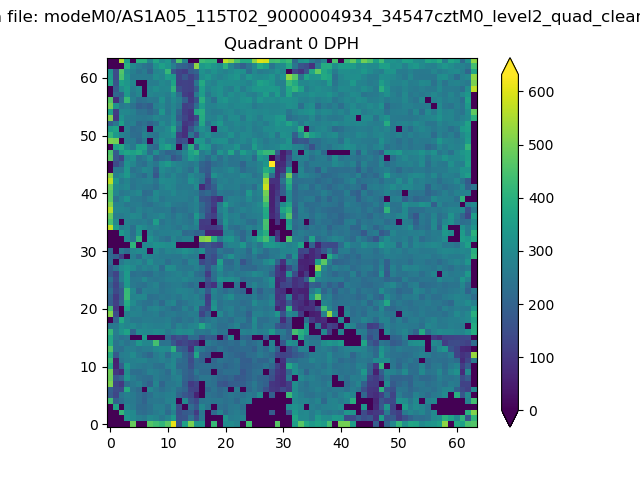 |
 |
Quadrant B |
|---|---|---|---|
| Quadrant D | 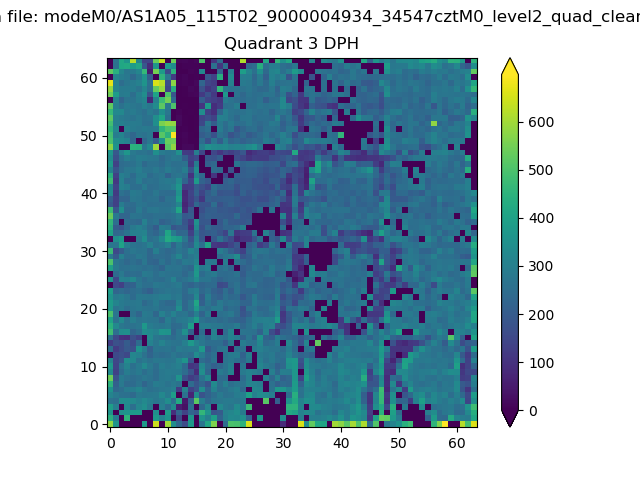 |
 |
Quadrant C |
| Plot type | Count rate plots | Images |
|---|---|---|
| Comparison with Poisson distribution Blue bars denote a histogram of data divided into 1 sec bins. Red curve is a Poisson curve with rate = median count rate of data. |
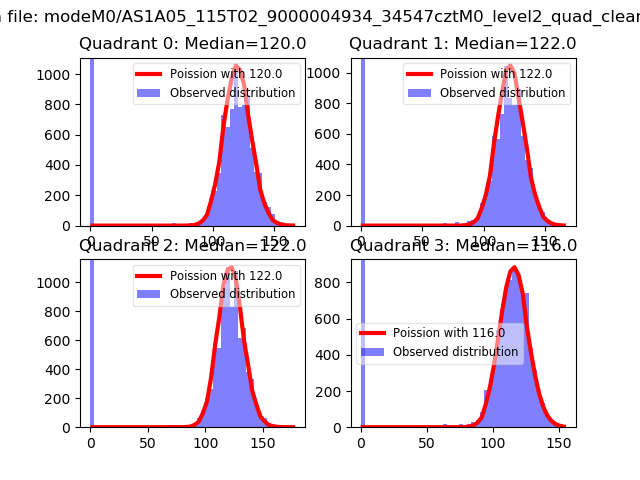 |
 |
| Quadrant-wise count rates Data is divided into 100 sec bins |
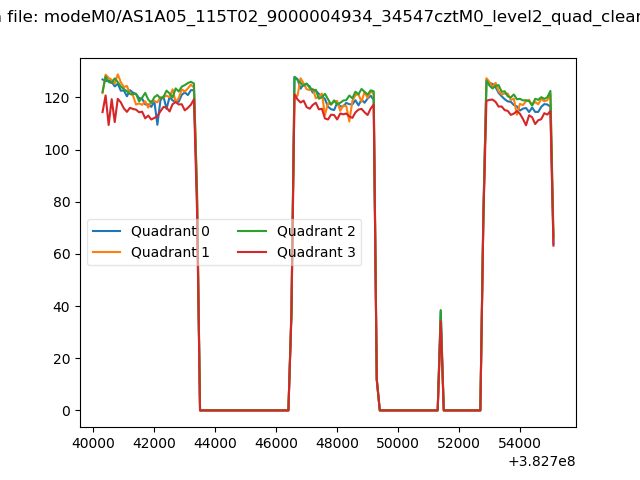 |
|
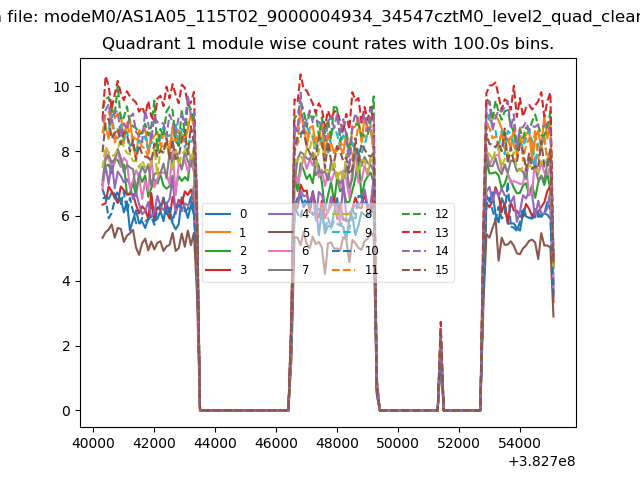
| Module-wise count rates for Quadrant A Data is divided into 100 sec bins |
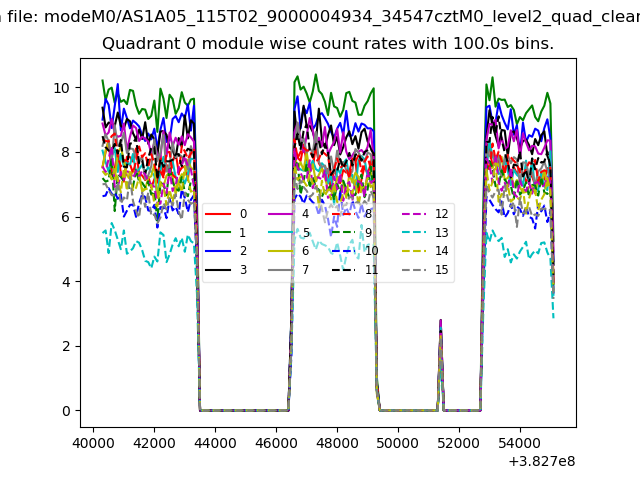 |
 |
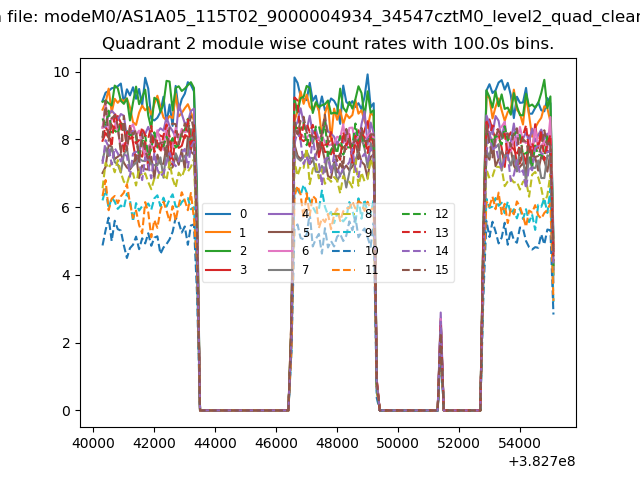
| Module-wise count rates for Quadrant B Data is divided into 100 sec bins |
 |
 |
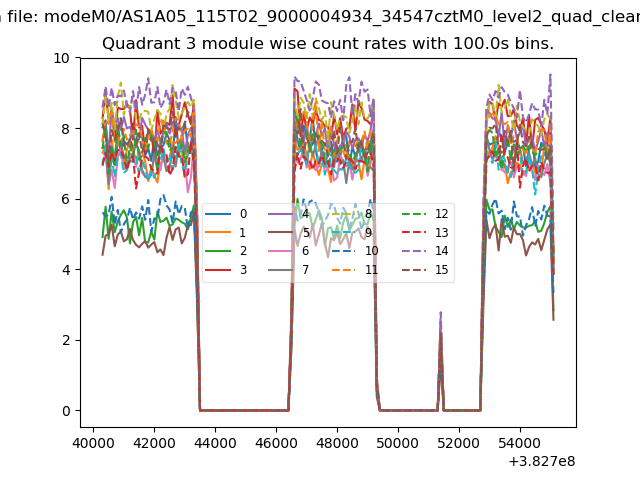
| Module-wise count rates for Quadrant C Data is divided into 100 sec bins |
 |
 |
| Module-wise count rates for Quadrant D Data is divided into 100 sec bins |
 |
 |
| Parameter | Plot |
|---|---|
| CZT HV Monitor | 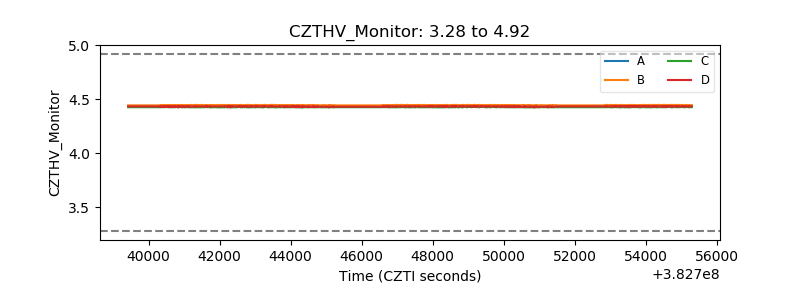 |
| D_VDD | 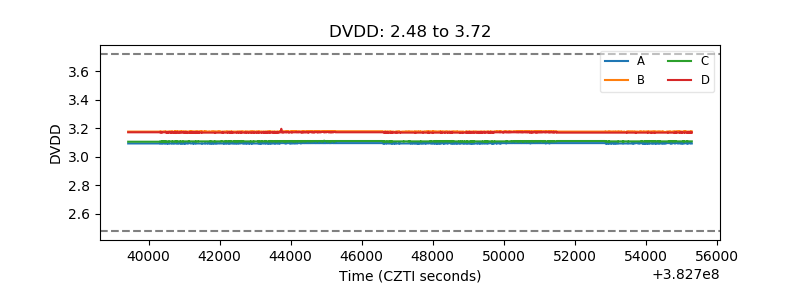 |
| Temperature 1 | 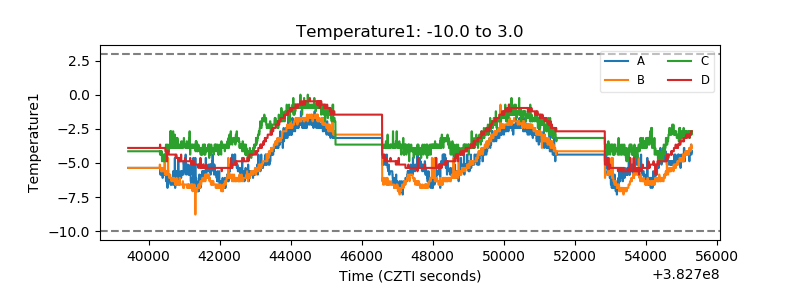 |
| Veto HV Monitor | 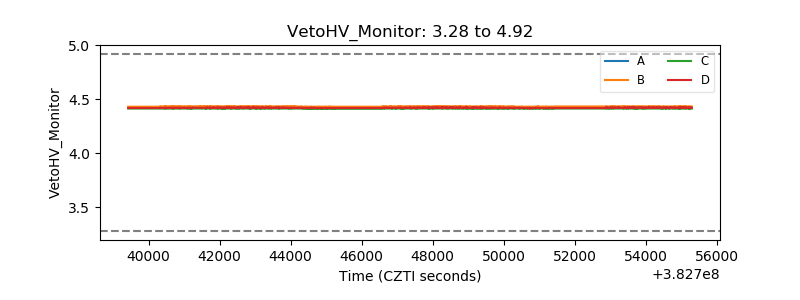 |
| Veto LLD | 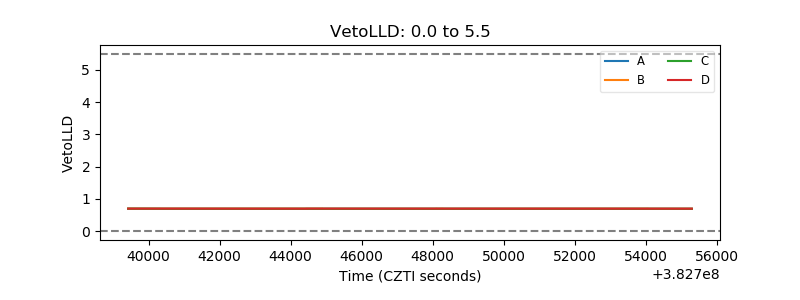 |
| Alpha Counter | 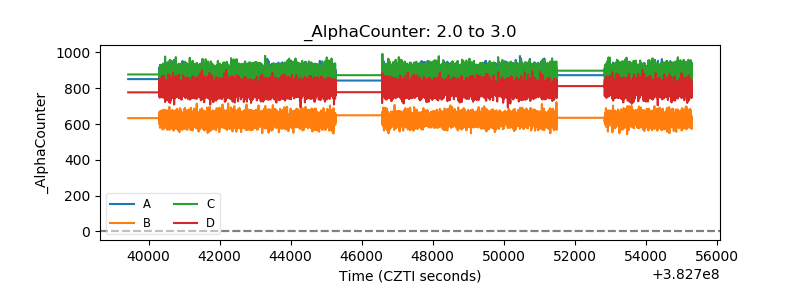 |
| _CPM_Rate | 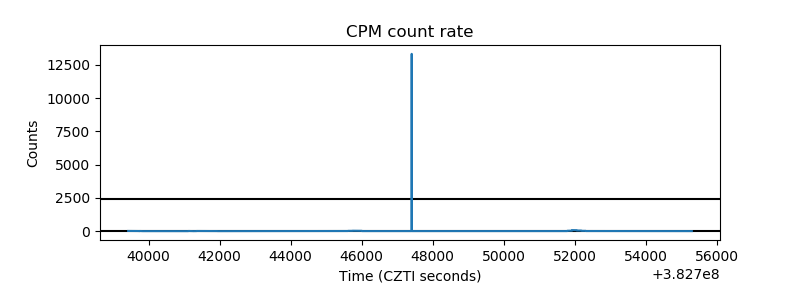 |
| CZT Counter | 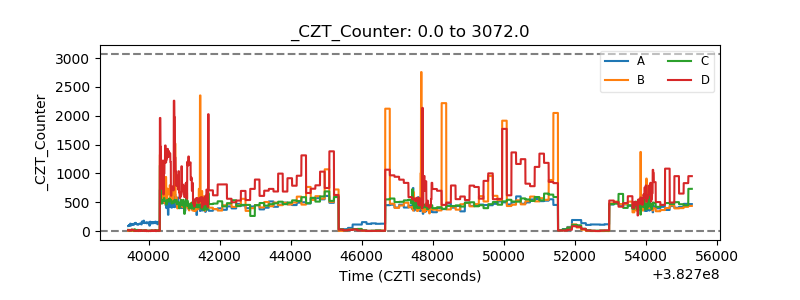 |
| +2.5 Volts monitor | 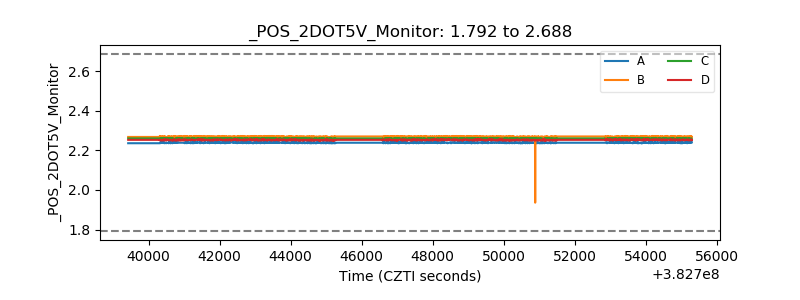 |
| +5 Volts monitor | 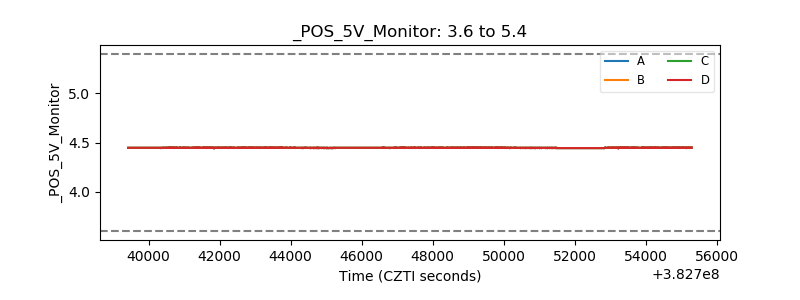 |
| _ROLL_ROT | 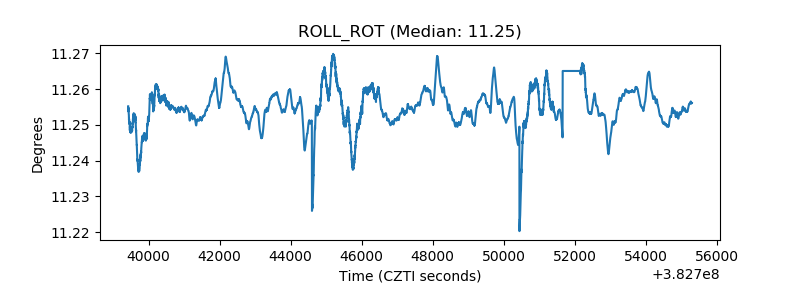 |
| _Roll_DEC | 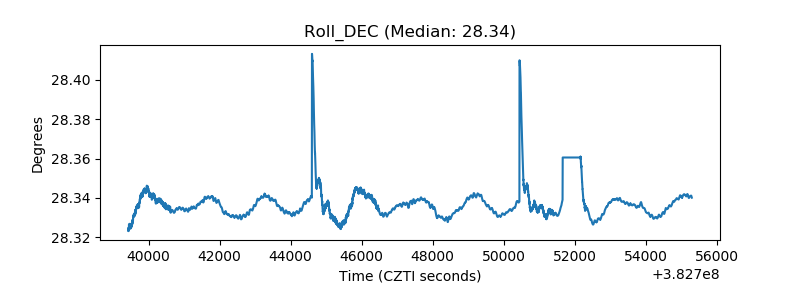 |
| _Roll_RA |  |
| Veto Counter | 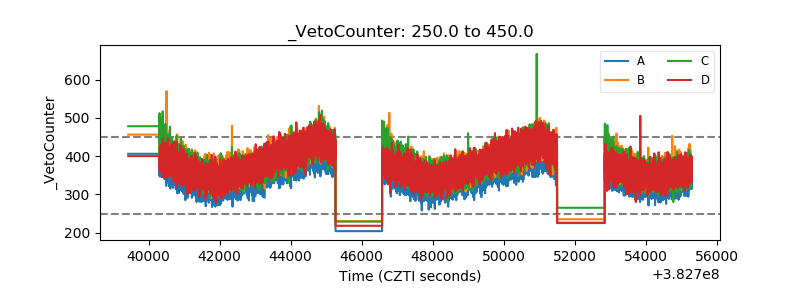 |