| Param | Original file | Final file |
|---|---|---|
| Filename | modeM0/AS1A05_115T02_9000004934_34543cztM0_level2.evt | modeM0/AS1A05_115T02_9000004934_34543cztM0_level2_quad_clean.evt |
| Size (bytes) | 503,896,320 | 86,135,040 |
| Size | 480.6 MB | 82.1 MB |
| Events in quadrant A | 2,814,291 | 557,797 |
| Events in quadrant B | 3,536,285 | 552,823 |
| Events in quadrant C | 3,206,808 | 558,411 |
| Events in quadrant D | 5,300,356 | 524,083 |
| Mode SS | |||
|---|---|---|---|
| Quadrant | BADHDUFLAG | Total packets | Discarded packets |
| A | 0 | 122 | 0 |
| B | 0 | 122 | 0 |
| C | 0 | 122 | 0 |
| D | 0 | 122 | 0 |
| Mode M0 | |||
|---|---|---|---|
| Quadrant | BADHDUFLAG | Total packets | Discarded packets |
| A | 0 | 12375 | 3 |
| B | 0 | 14514 | 2 |
| C | 0 | 13170 | 2 |
| D | 0 | 19935 | 2 |
| Mode M9 | |||
|---|---|---|---|
| Quadrant | BADHDUFLAG | Total packets | Discarded packets |
| A | 0 | 28 | 0 |
| B | 0 | 28 | 0 |
| C | 0 | 28 | 0 |
| D | 0 | 28 | 0 |
| Quadrant | Total seconds | Saturated seconds | Saturation percentage |
|---|---|---|---|
| A | 5946 | 15 | 0.252270% |
| B | 5946 | 194 | 3.262698% |
| C | 5946 | 38 | 0.639085% |
| D | 5946 | 207 | 3.481332% |
Noise dominated data is calculated using 1-second bins in cleaned event files. If a bin has >2000 counts, and if more than 50% of those come from <1% of pixels, then it is considered to be noise-dominated and hence unusable.
| Quadrant | # 1 sec bins | Bins with >0 counts | Bins with >2000 counts | High rate bins dominated by noise | Noise dominated (total time) | Noise dominated (detector-on time) | Marked lightcurve |
|---|---|---|---|---|---|---|---|
| A | 8752 | 5948 | 4 | 4 | 0.05% | 0.07% | 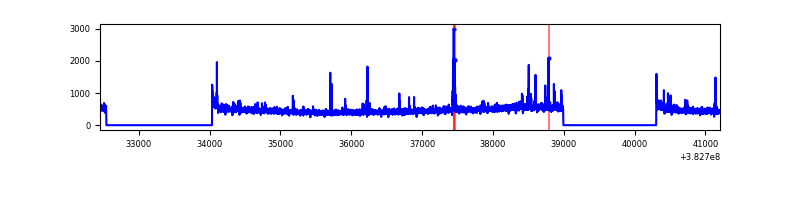 |
| B | 8752 | 5948 | 110 | 110 | 1.26% | 1.85% | 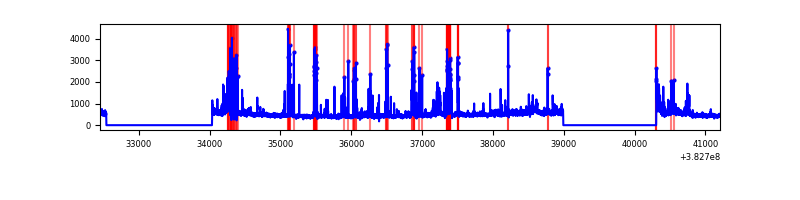 |
| C | 8752 | 5948 | 23 | 23 | 0.26% | 0.39% | 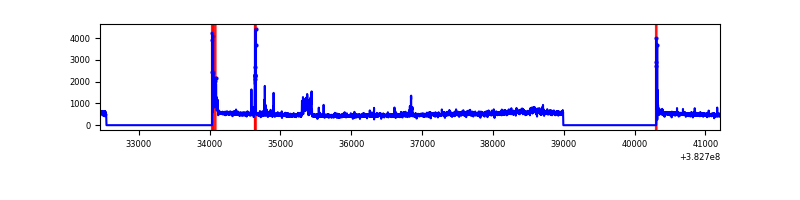 |
| D | 8752 | 5948 | 131 | 131 | 1.50% | 2.20% | 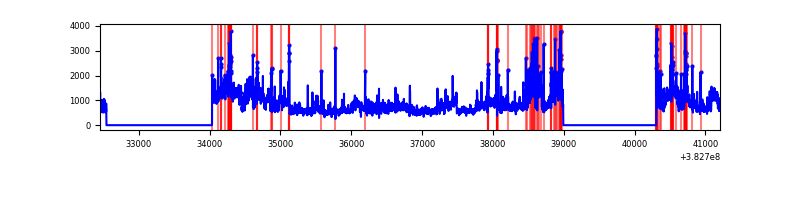 |
Top three noisy pixels from each quadrant. If the there are fewer than three noisy pixels in the level2.evt file, extra rows are filled as -1
| Pixel properties | Quadrant properties | ||||||
|---|---|---|---|---|---|---|---|
| Quadrant | DetID | PixID | Counts | Sigma | Mean | Median | Sigma |
| A | 9 | 143 | 83734 | 598.86 | 689 | 677 | 138.7 |
| A | 10 | 83 | 41264 | 292.64 | 689 | 677 | 138.7 |
| A | 10 | 255 | 13938 | 95.62 | 689 | 677 | 138.7 |
| B | 5 | 172 | 533447 | 4071.09 | 680 | 662 | 130.9 |
| B | 0 | 229 | 161769 | 1231.04 | 680 | 662 | 130.9 |
| B | 4 | 232 | 71209 | 539.06 | 680 | 662 | 130.9 |
| C | 15 | 214 | 267704 | 1704.18 | 673 | 677 | 156.7 |
| C | 0 | 10 | 98755 | 625.94 | 673 | 677 | 156.7 |
| C | 0 | 207 | 76731 | 485.38 | 673 | 677 | 156.7 |
| D | 8 | 195 | 1838781 | 10202.62 | 658 | 645 | 180.2 |
| D | 1 | 52 | 220497 | 1220.29 | 658 | 645 | 180.2 |
| D | 13 | 249 | 167729 | 927.4 | 658 | 645 | 180.2 |
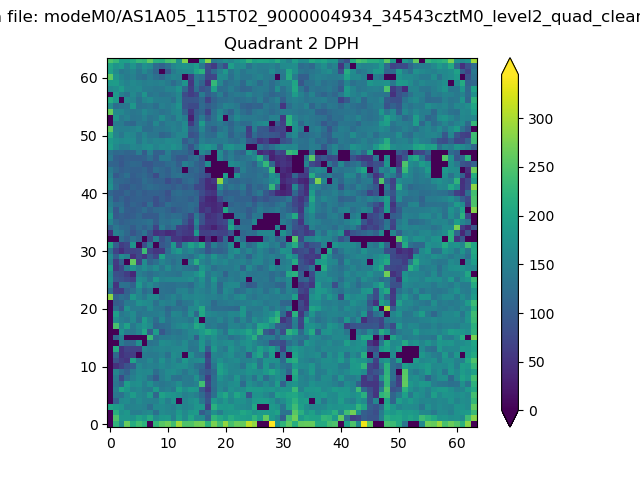
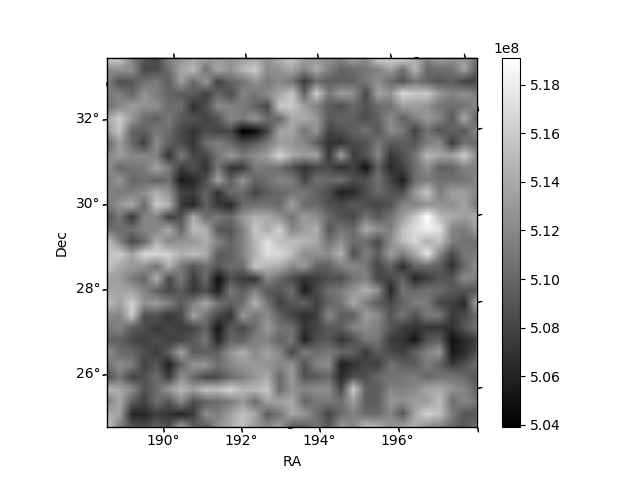
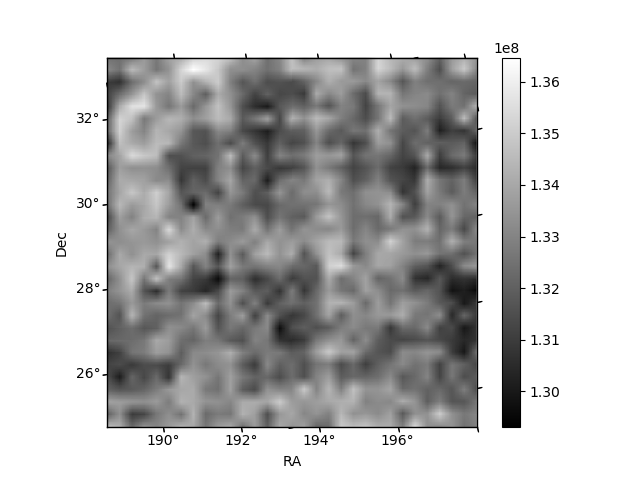
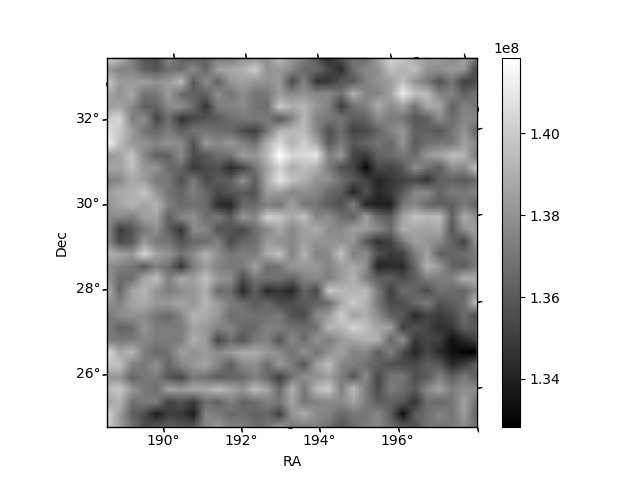
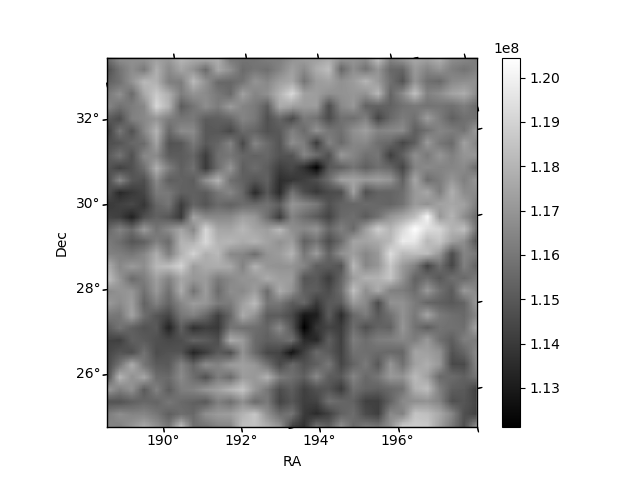
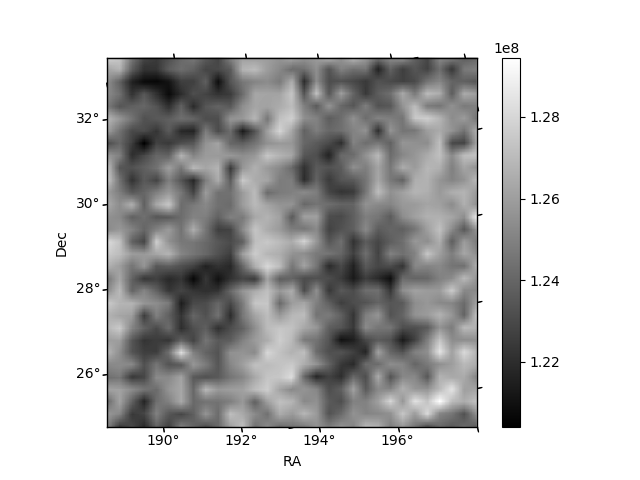
Histogram calculated using DETX and DETY for each event in the final _common_clean file
| Quadrant A | 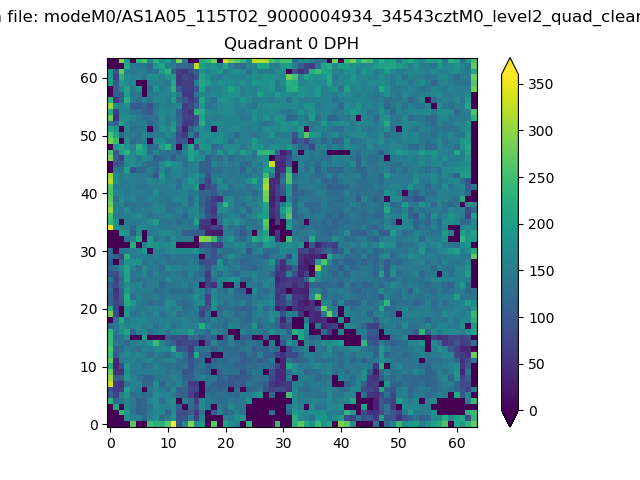 |
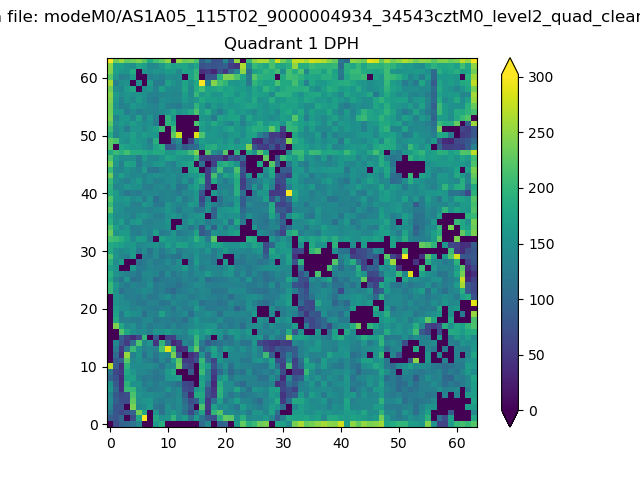 |
Quadrant B |
|---|---|---|---|
| Quadrant D | 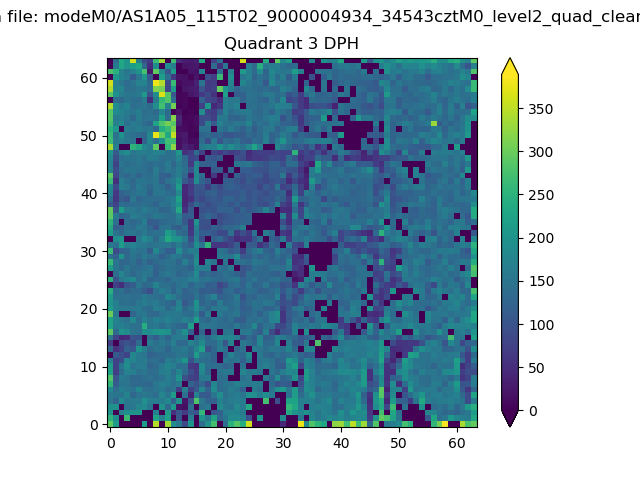 |
 |
Quadrant C |
| Plot type | Count rate plots | Images |
|---|---|---|
| Comparison with Poisson distribution Blue bars denote a histogram of data divided into 1 sec bins. Red curve is a Poisson curve with rate = median count rate of data. |
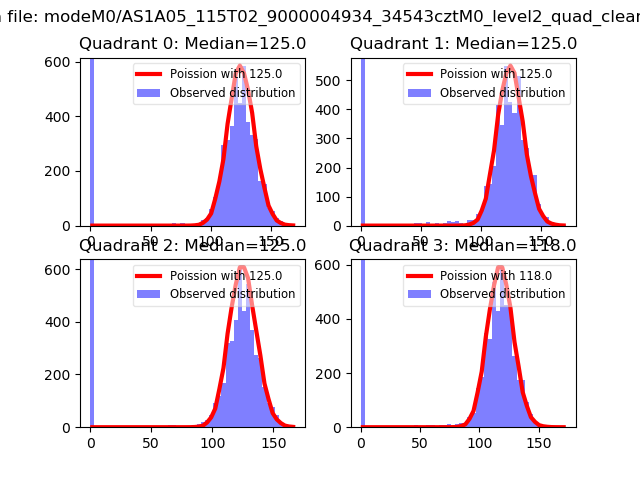 |
 |
| Quadrant-wise count rates Data is divided into 100 sec bins |
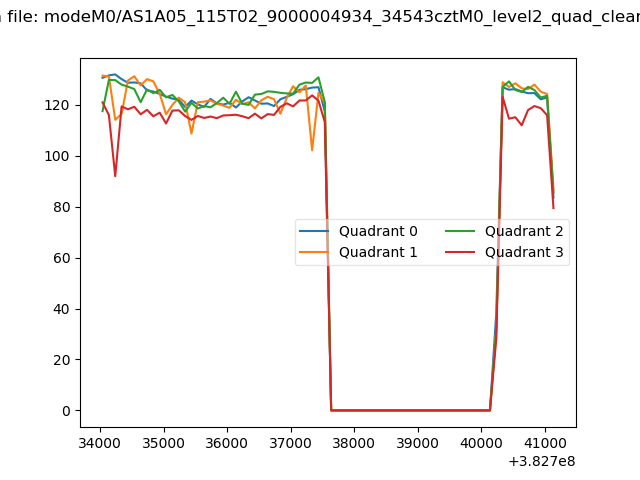 |
|
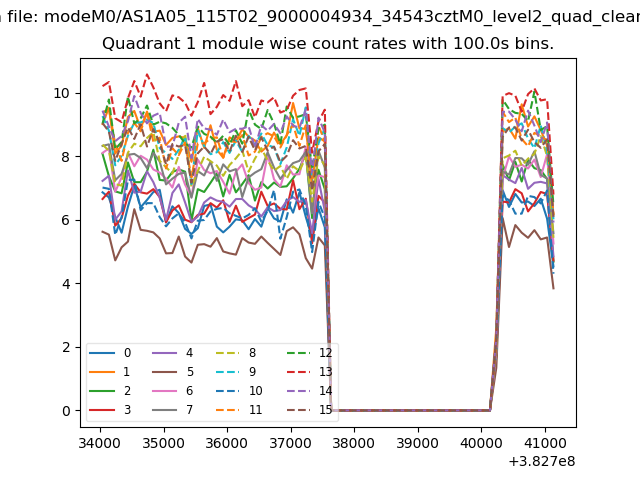
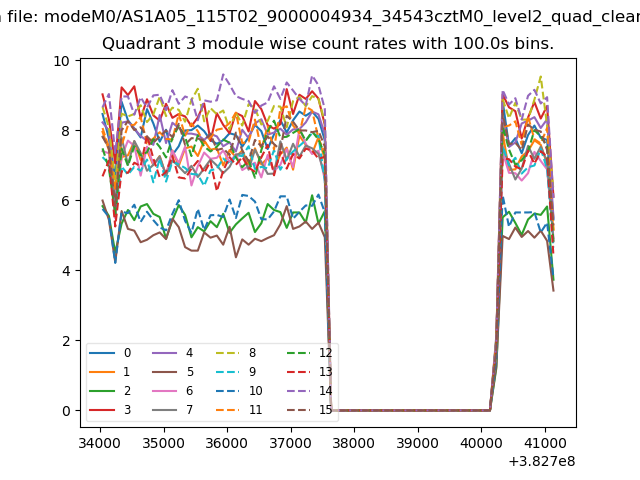
| Module-wise count rates for Quadrant A Data is divided into 100 sec bins |
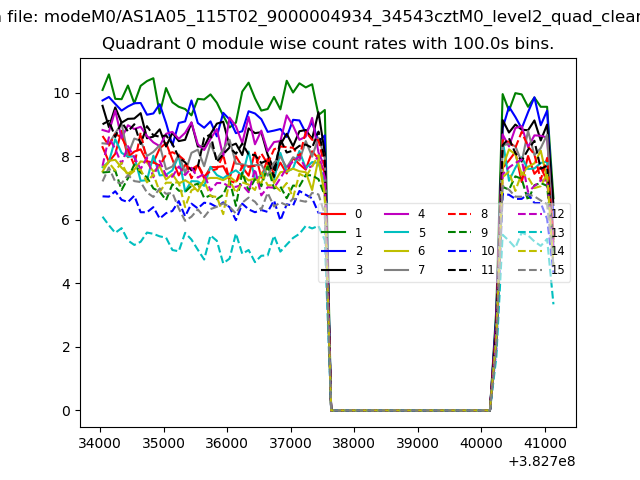 |
 |
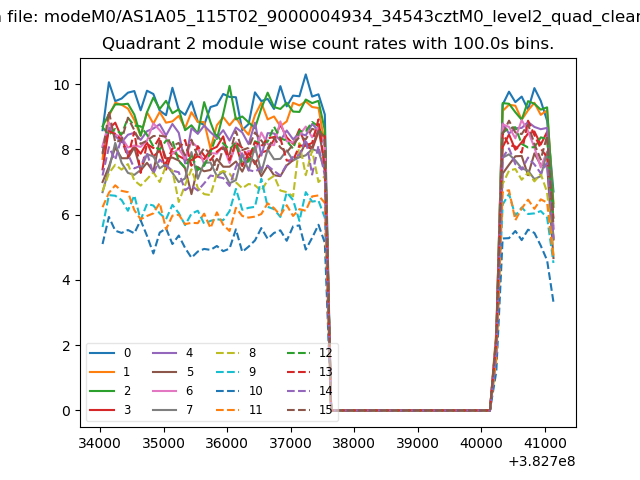
| Module-wise count rates for Quadrant B Data is divided into 100 sec bins |
 |
 |
| Module-wise count rates for Quadrant C Data is divided into 100 sec bins |
 |
 |
| Module-wise count rates for Quadrant D Data is divided into 100 sec bins |
 |
 |
| Parameter | Plot |
|---|---|
| CZT HV Monitor | 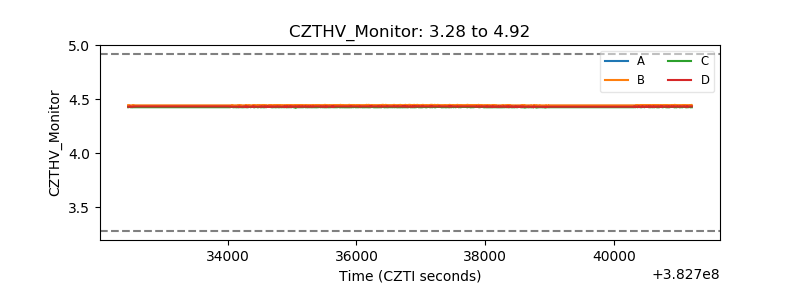 |
| D_VDD | 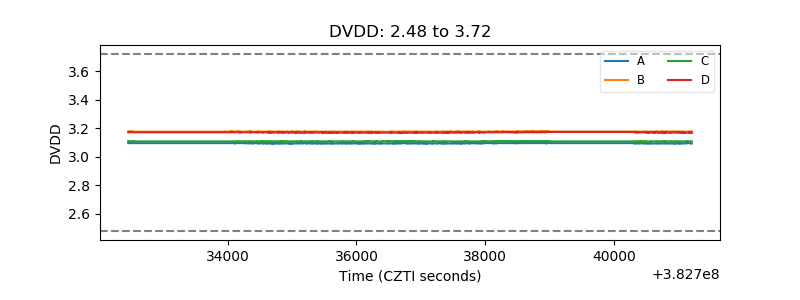 |
| Temperature 1 | 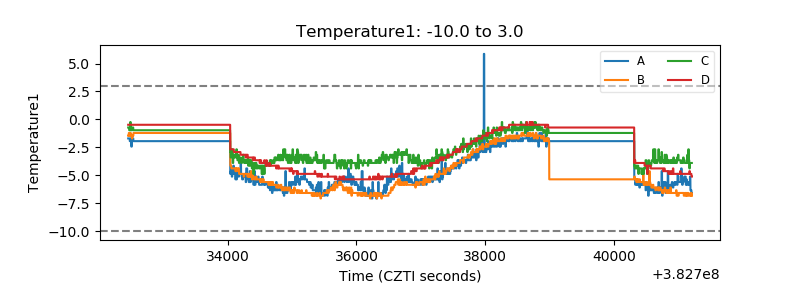 |
| Veto HV Monitor | 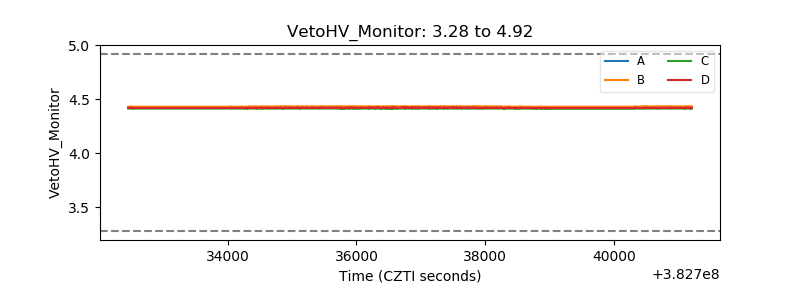 |
| Veto LLD | 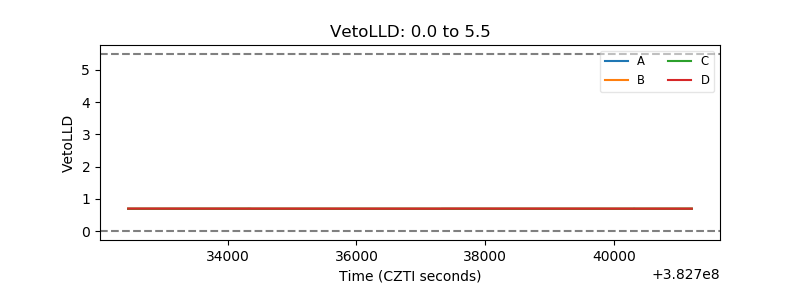 |
| Alpha Counter | 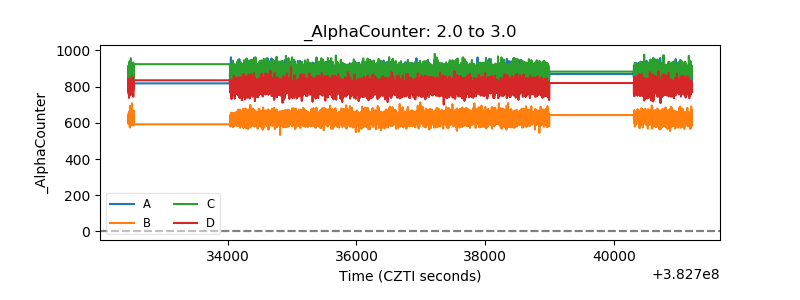 |
| _CPM_Rate | 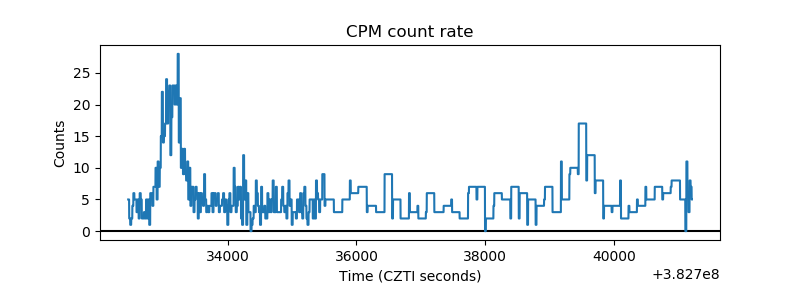 |
| CZT Counter | 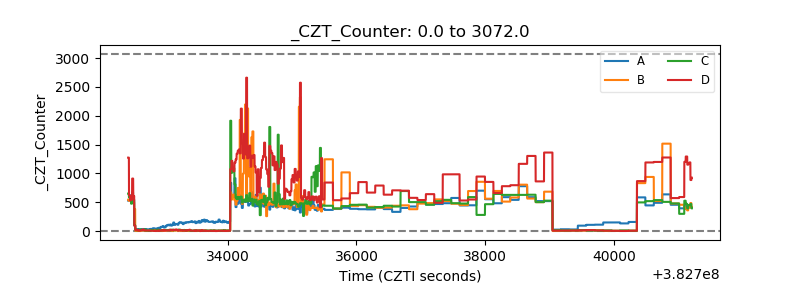 |
| +2.5 Volts monitor |  |
| +5 Volts monitor | 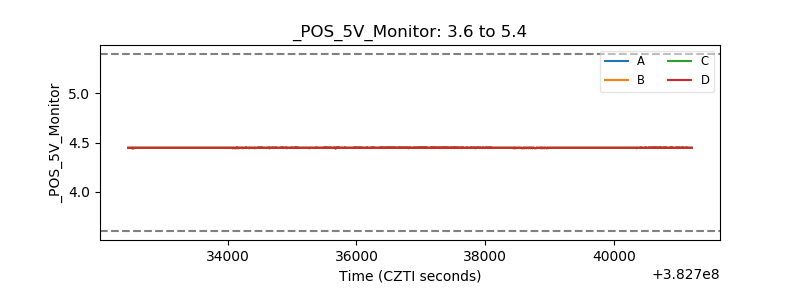 |
| _ROLL_ROT | 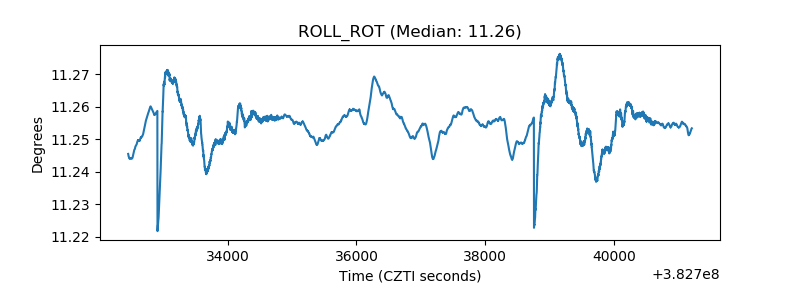 |
| _Roll_DEC | 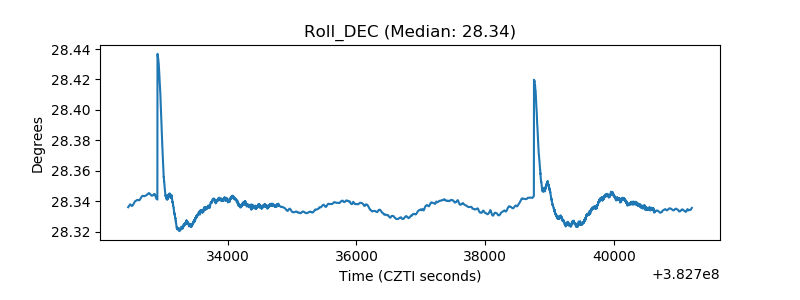 |
| _Roll_RA | 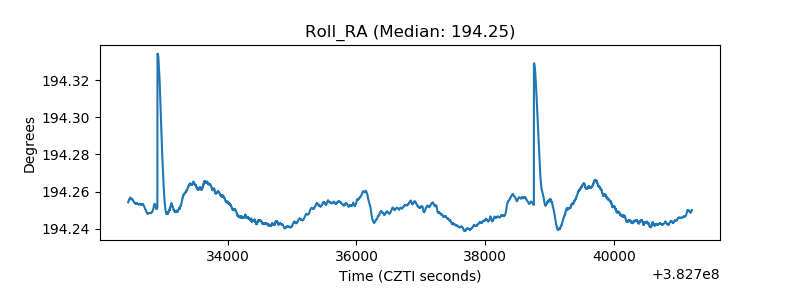 |
| Veto Counter | 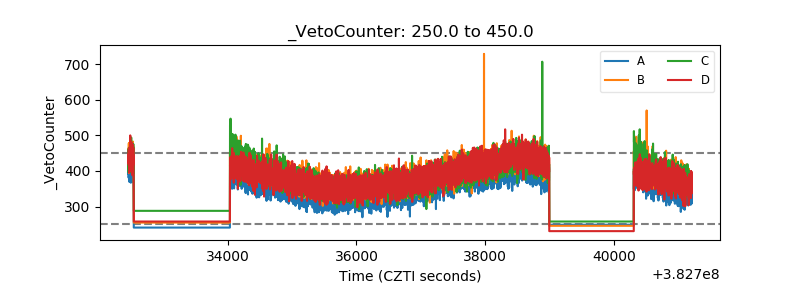 |