| Param | Original file | Final file |
|---|---|---|
| Filename | modeM0/AS1A05_115T02_9000004934_34540cztM0_level2.evt | modeM0/AS1A05_115T02_9000004934_34540cztM0_level2_quad_clean.evt |
| Size (bytes) | 471,415,680 | 65,810,880 |
| Size | 449.6 MB | 62.8 MB |
| Events in quadrant A | 2,499,454 | 419,967 |
| Events in quadrant B | 3,425,004 | 412,100 |
| Events in quadrant C | 2,780,407 | 423,317 |
| Events in quadrant D | 5,234,513 | 388,069 |
| Mode SS | |||
|---|---|---|---|
| Quadrant | BADHDUFLAG | Total packets | Discarded packets |
| A | 0 | 102 | 0 |
| B | 0 | 102 | 0 |
| C | 0 | 102 | 0 |
| D | 0 | 102 | 0 |
| Mode M0 | |||
|---|---|---|---|
| Quadrant | BADHDUFLAG | Total packets | Discarded packets |
| A | 0 | 10481 | 2 |
| B | 0 | 13462 | 1 |
| C | 0 | 11003 | 1 |
| D | 0 | 19093 | 1 |
| Mode M9 | |||
|---|---|---|---|
| Quadrant | BADHDUFLAG | Total packets | Discarded packets |
| A | 0 | 32 | 0 |
| B | 0 | 32 | 0 |
| C | 0 | 32 | 0 |
| D | 0 | 33 | 0 |
| Quadrant | Total seconds | Saturated seconds | Saturation percentage |
|---|---|---|---|
| A | 4977 | 13 | 0.261202% |
| B | 4977 | 184 | 3.697006% |
| C | 4977 | 53 | 1.064899% |
| D | 4977 | 513 | 10.307414% |
Noise dominated data is calculated using 1-second bins in cleaned event files. If a bin has >2000 counts, and if more than 50% of those come from <1% of pixels, then it is considered to be noise-dominated and hence unusable.
| Quadrant | # 1 sec bins | Bins with >0 counts | Bins with >2000 counts | High rate bins dominated by noise | Noise dominated (total time) | Noise dominated (detector-on time) | Marked lightcurve |
|---|---|---|---|---|---|---|---|
| A | 7040 | 4978 | 4 | 4 | 0.06% | 0.08% | 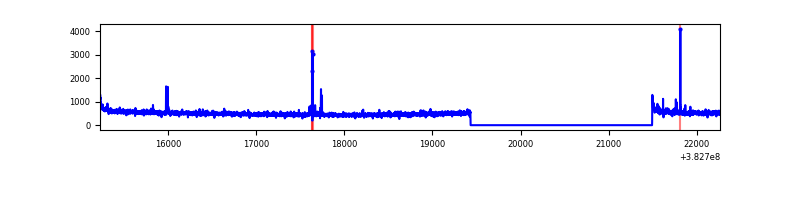 |
| B | 7040 | 4978 | 119 | 119 | 1.69% | 2.39% | 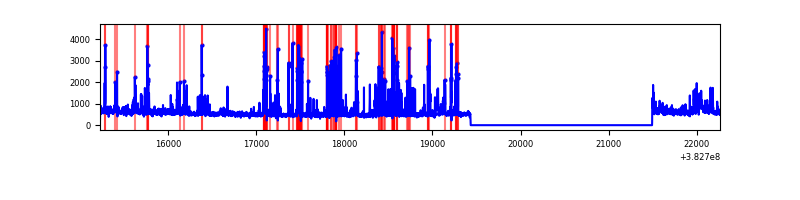 |
| C | 7040 | 4978 | 31 | 31 | 0.44% | 0.62% | 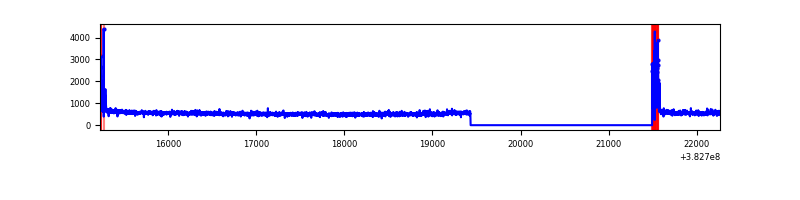 |
| D | 7040 | 4978 | 416 | 416 | 5.91% | 8.36% | 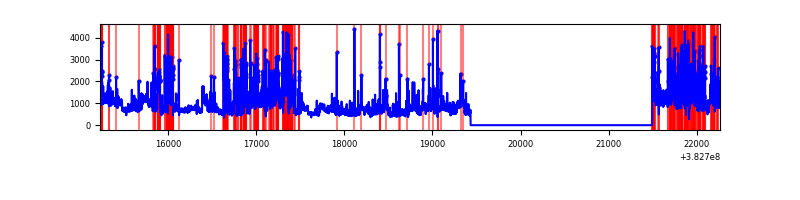 |
Top three noisy pixels from each quadrant. If the there are fewer than three noisy pixels in the level2.evt file, extra rows are filled as -1
| Pixel properties | Quadrant properties | ||||||
|---|---|---|---|---|---|---|---|
| Quadrant | DetID | PixID | Counts | Sigma | Mean | Median | Sigma |
| A | 9 | 143 | 56784 | 452.19 | 617 | 606 | 124.2 |
| A | 10 | 83 | 41352 | 327.98 | 617 | 606 | 124.2 |
| A | 13 | 6 | 7714 | 57.21 | 617 | 606 | 124.2 |
| B | 5 | 172 | 693961 | 6001.3 | 607 | 590 | 115.5 |
| B | 5 | 236 | 89601 | 770.41 | 607 | 590 | 115.5 |
| B | 0 | 245 | 76859 | 660.12 | 607 | 590 | 115.5 |
| C | 15 | 214 | 224629 | 1598.93 | 605 | 611 | 140.1 |
| C | 0 | 10 | 144619 | 1027.86 | 605 | 611 | 140.1 |
| C | 14 | 67 | 50351 | 355.02 | 605 | 611 | 140.1 |
| D | 8 | 195 | 1080927 | 7207.24 | 579 | 567 | 149.9 |
| D | 7 | 80 | 1020030 | 6800.99 | 579 | 567 | 149.9 |
| D | 14 | 34 | 198190 | 1318.37 | 579 | 567 | 149.9 |
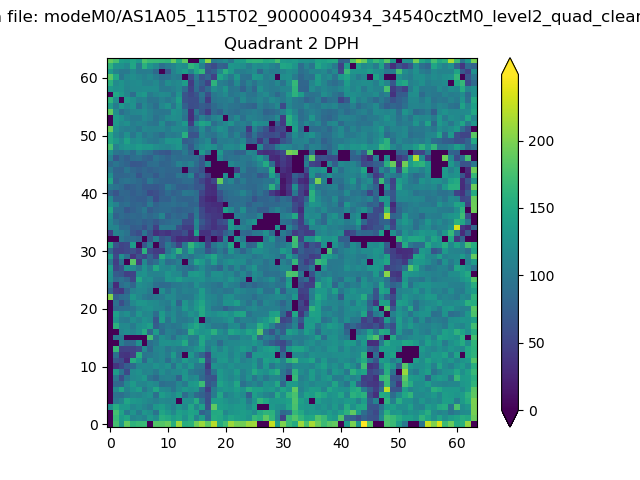
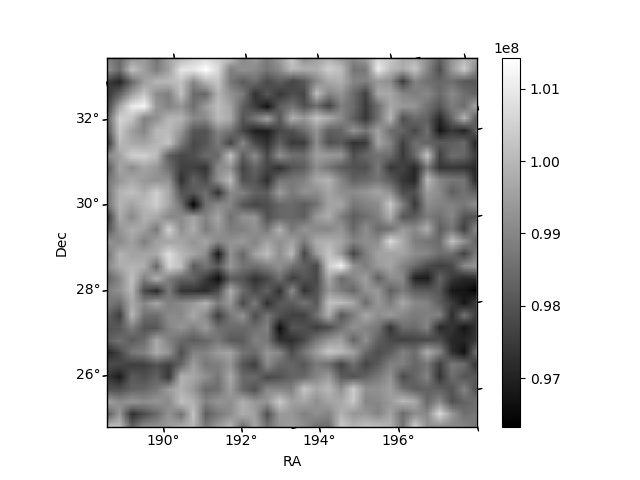
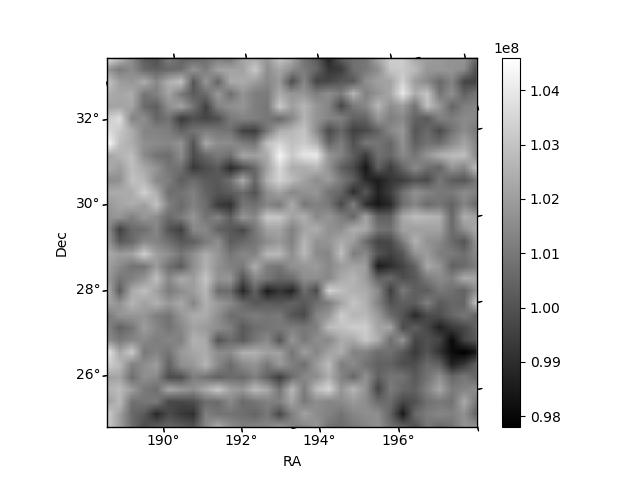
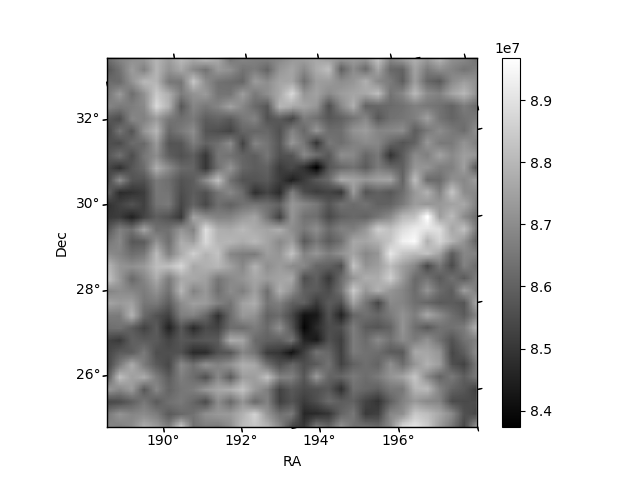
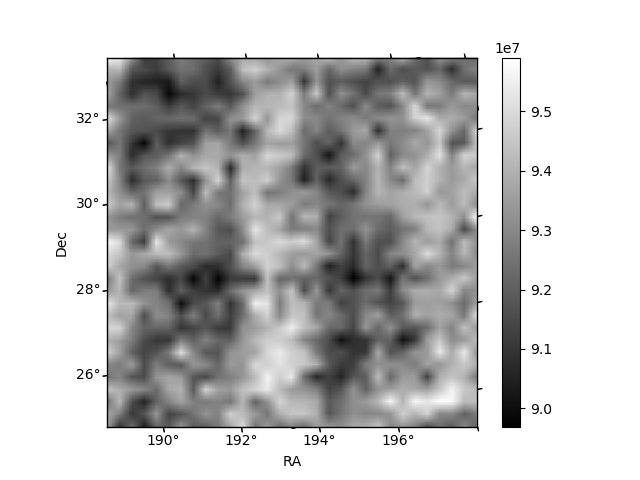
Histogram calculated using DETX and DETY for each event in the final _common_clean file
| Quadrant A | 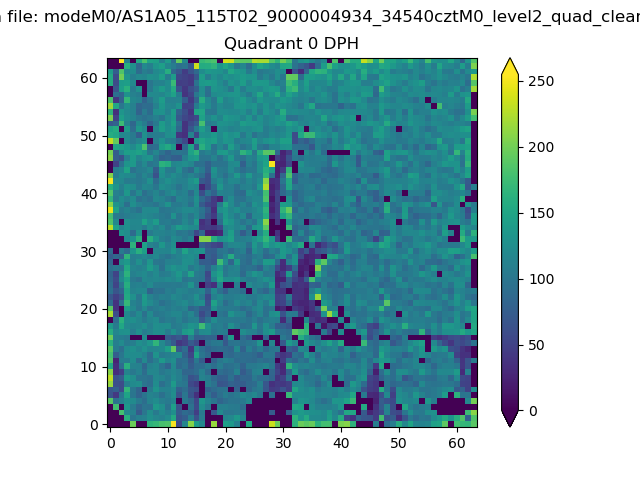 |
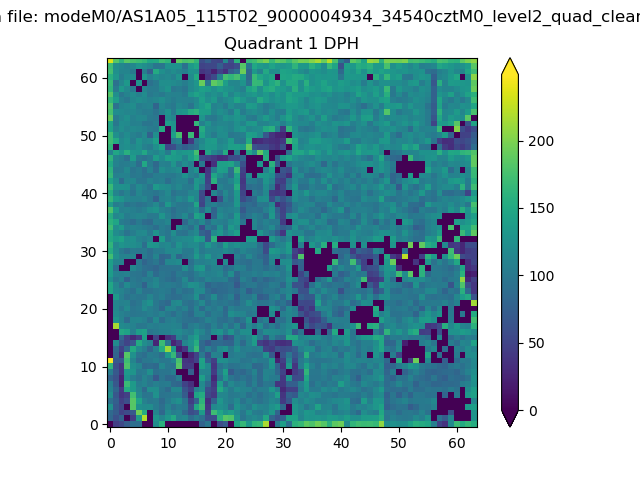 |
Quadrant B |
|---|---|---|---|
| Quadrant D | 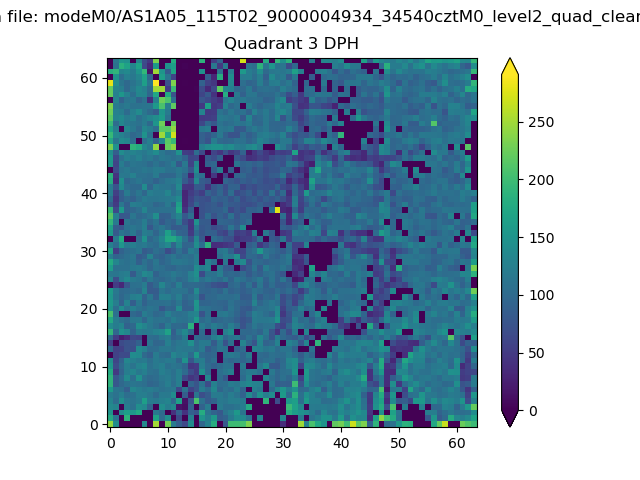 |
 |
Quadrant C |
| Plot type | Count rate plots | Images |
|---|---|---|
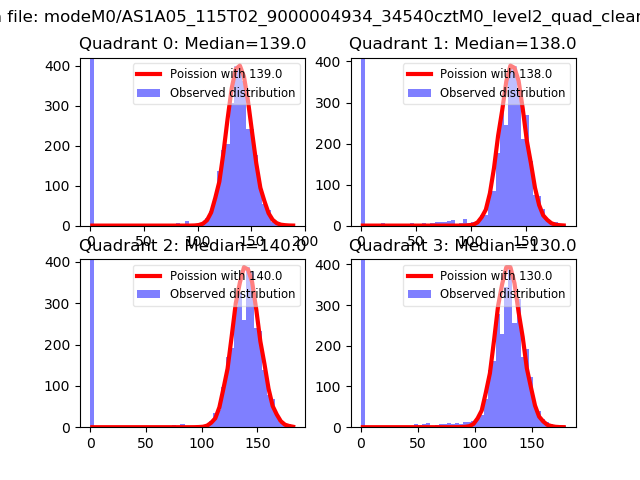
| Comparison with Poisson distribution Blue bars denote a histogram of data divided into 1 sec bins. Red curve is a Poisson curve with rate = median count rate of data. |
 |
 |
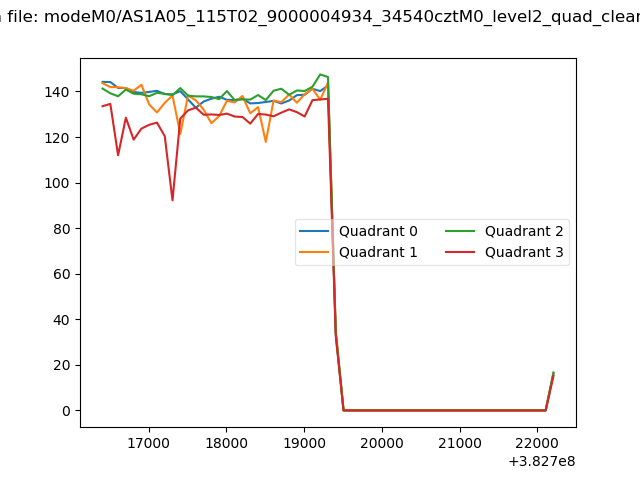
| Quadrant-wise count rates Data is divided into 100 sec bins |
 |
|
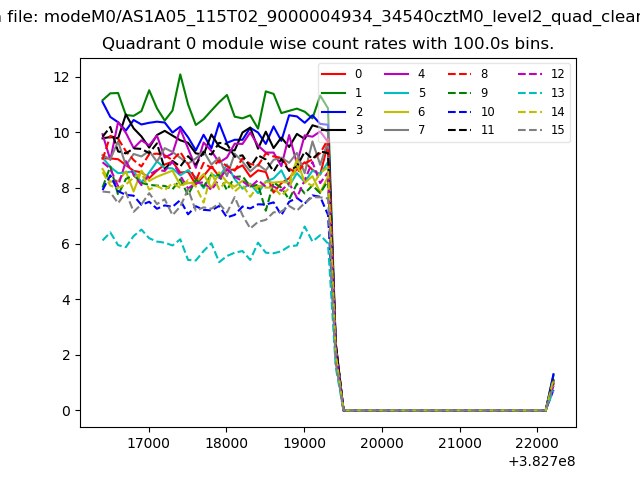
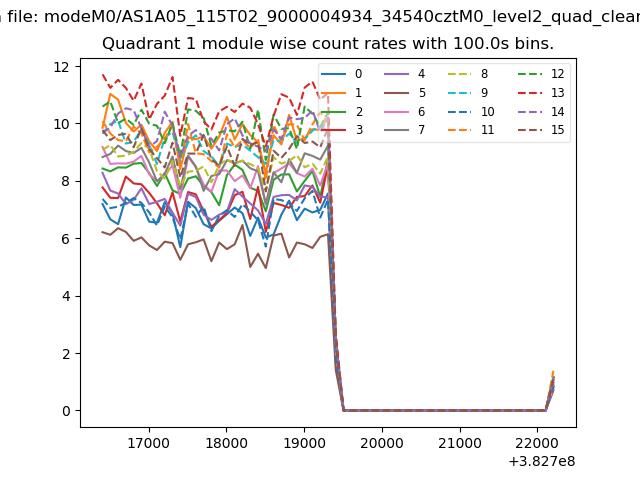
| Module-wise count rates for Quadrant A Data is divided into 100 sec bins |
 |
 |
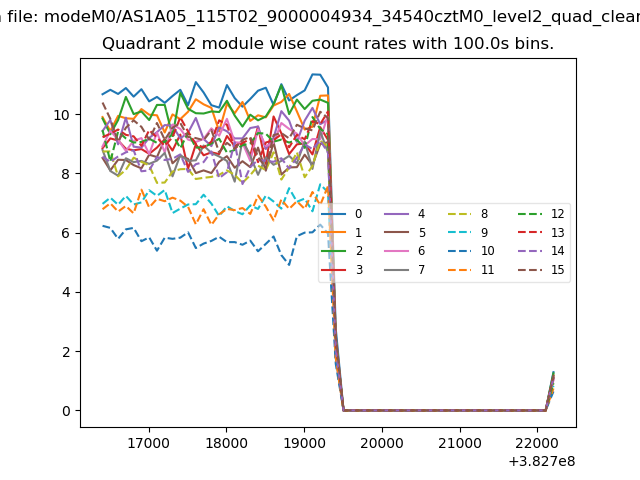
| Module-wise count rates for Quadrant B Data is divided into 100 sec bins |
 |
 |
| Module-wise count rates for Quadrant C Data is divided into 100 sec bins |
 |
 |
| Module-wise count rates for Quadrant D Data is divided into 100 sec bins |
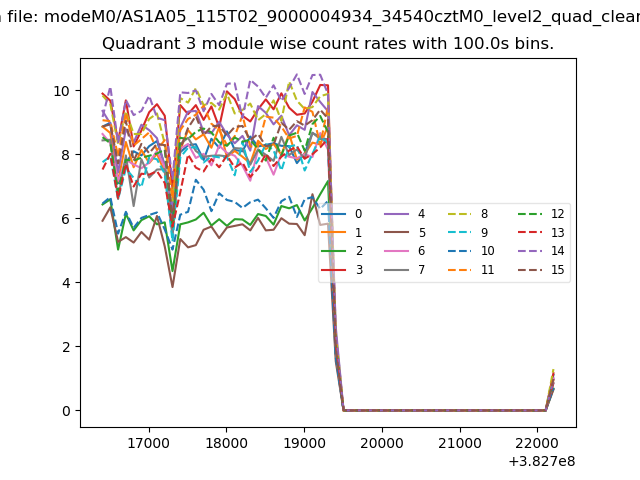 |
 |
| Parameter | Plot |
|---|---|
| CZT HV Monitor | 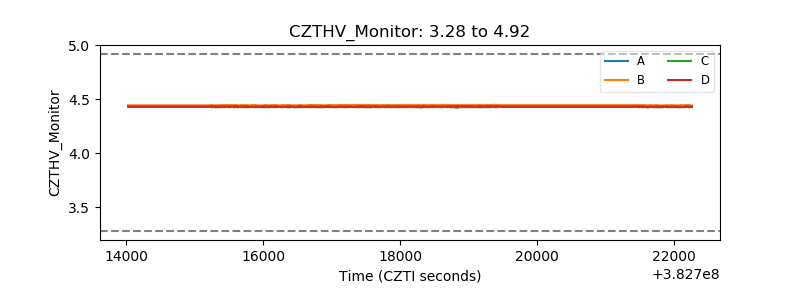 |
| D_VDD | 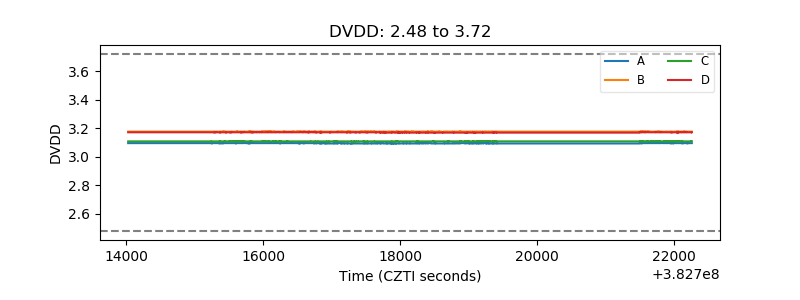 |
| Temperature 1 | 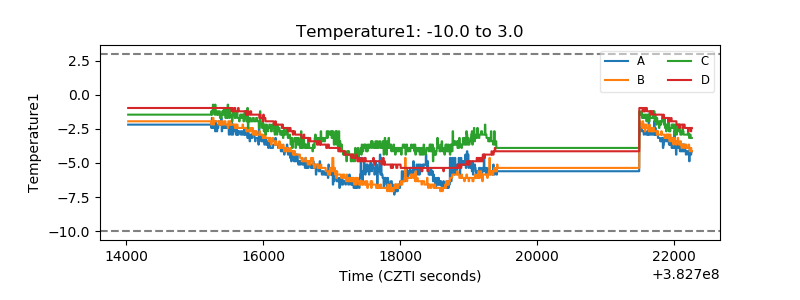 |
| Veto HV Monitor | 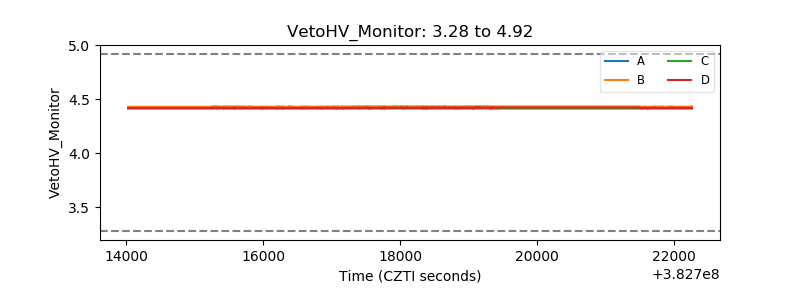 |
| Veto LLD | 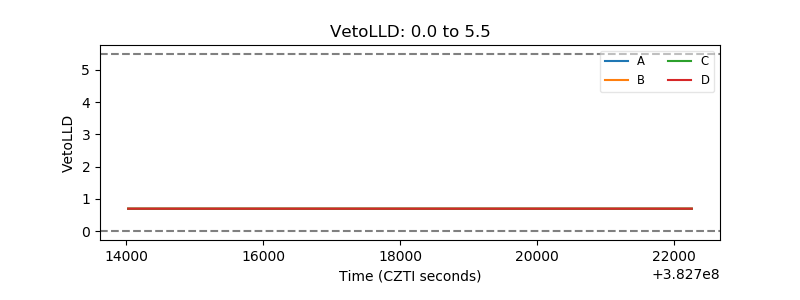 |
| Alpha Counter | 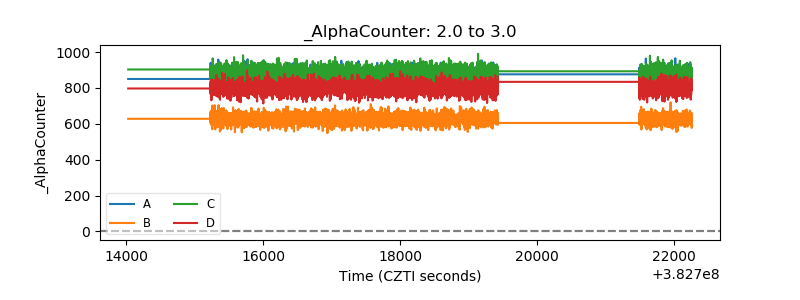 |
| _CPM_Rate |  |
| CZT Counter | 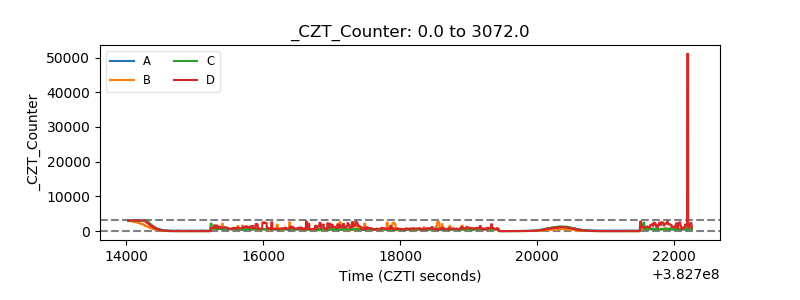 |
| +2.5 Volts monitor | 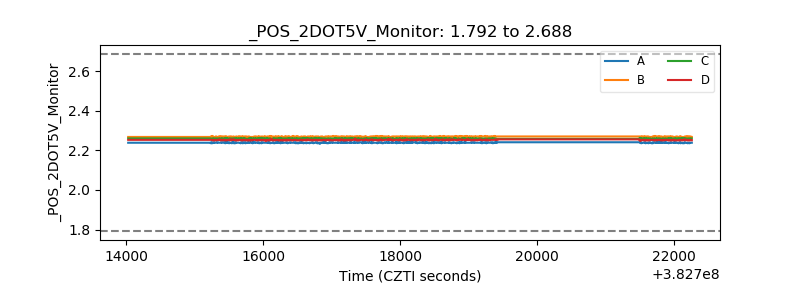 |
| +5 Volts monitor | 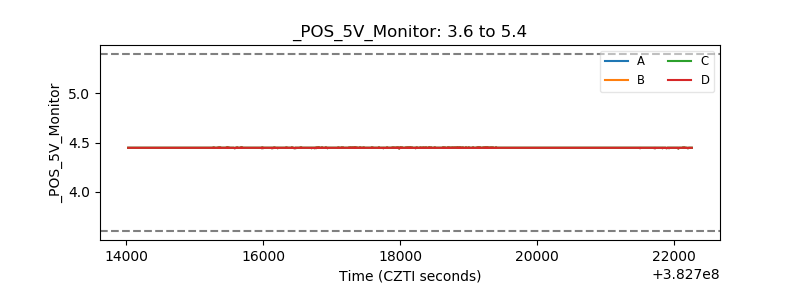 |
| _ROLL_ROT | 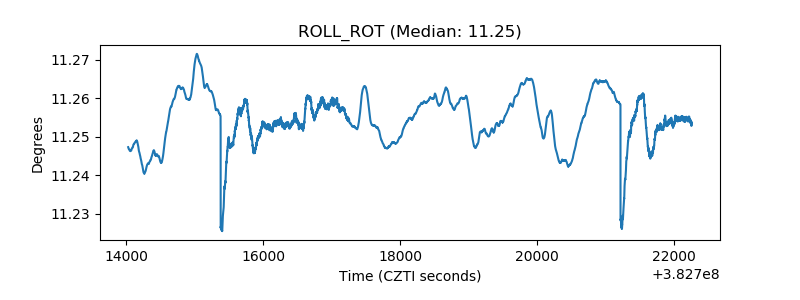 |
| _Roll_DEC | 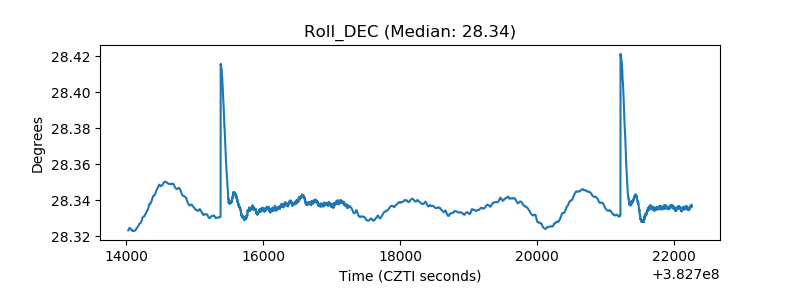 |
| _Roll_RA | 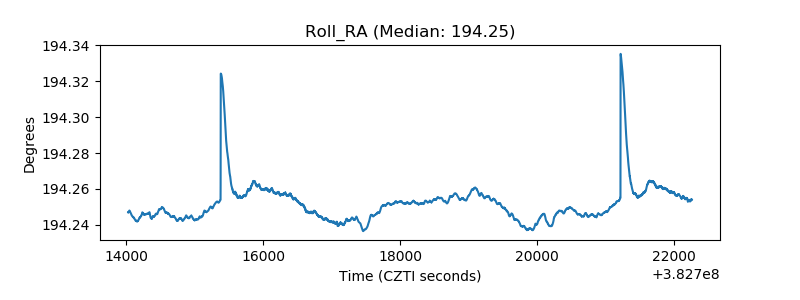 |
| Veto Counter | 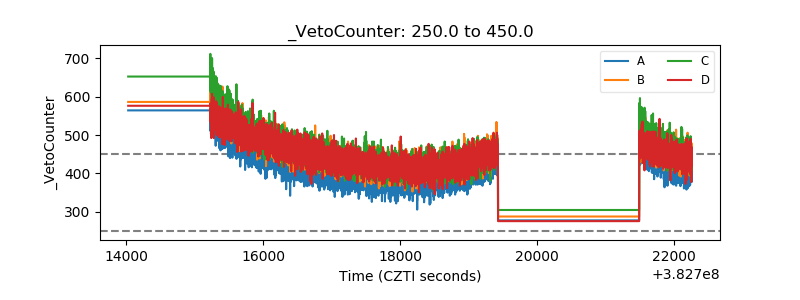 |