| Param | Original file | Final file |
|---|---|---|
| Filename | modeM0/AS1A05_115T02_9000004934_34539cztM0_level2.evt | modeM0/AS1A05_115T02_9000004934_34539cztM0_level2_quad_clean.evt |
| Size (bytes) | 470,681,280 | 59,112,000 |
| Size | 448.9 MB | 56.4 MB |
| Events in quadrant A | 2,675,085 | 367,226 |
| Events in quadrant B | 3,411,631 | 360,423 |
| Events in quadrant C | 2,933,311 | 365,945 |
| Events in quadrant D | 4,889,478 | 339,275 |
| Mode SS | |||
|---|---|---|---|
| Quadrant | BADHDUFLAG | Total packets | Discarded packets |
| A | 0 | 102 | 0 |
| B | 0 | 102 | 0 |
| C | 0 | 102 | 0 |
| D | 0 | 102 | 0 |
| Mode M0 | |||
|---|---|---|---|
| Quadrant | BADHDUFLAG | Total packets | Discarded packets |
| A | 0 | 11024 | 2 |
| B | 0 | 13346 | 1 |
| C | 0 | 11608 | 1 |
| D | 0 | 18201 | 1 |
| Mode M9 | |||
|---|---|---|---|
| Quadrant | BADHDUFLAG | Total packets | Discarded packets |
| A | 0 | 35 | 0 |
| B | 0 | 35 | 0 |
| C | 0 | 35 | 0 |
| D | 0 | 36 | 0 |
| Quadrant | Total seconds | Saturated seconds | Saturation percentage |
|---|---|---|---|
| A | 5097 | 10 | 0.196194% |
| B | 5097 | 180 | 3.531489% |
| C | 5097 | 35 | 0.686678% |
| D | 5097 | 425 | 8.338238% |
Noise dominated data is calculated using 1-second bins in cleaned event files. If a bin has >2000 counts, and if more than 50% of those come from <1% of pixels, then it is considered to be noise-dominated and hence unusable.
| Quadrant | # 1 sec bins | Bins with >0 counts | Bins with >2000 counts | High rate bins dominated by noise | Noise dominated (total time) | Noise dominated (detector-on time) | Marked lightcurve |
|---|---|---|---|---|---|---|---|
| A | 7219 | 5098 | 0 | 0 | 0.00% | 0.00% | 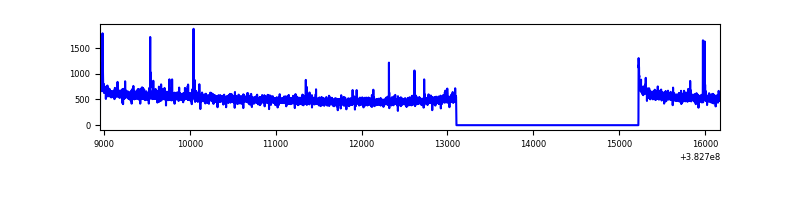 |
| B | 7219 | 5098 | 117 | 117 | 1.62% | 2.30% | 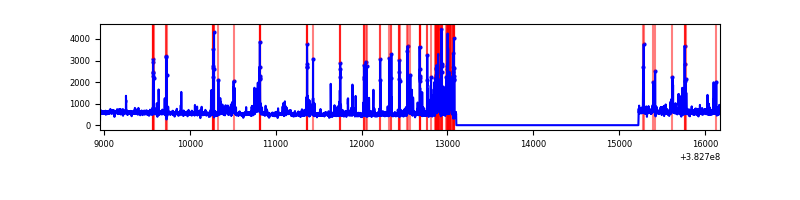 |
| C | 7219 | 5098 | 23 | 23 | 0.32% | 0.45% | 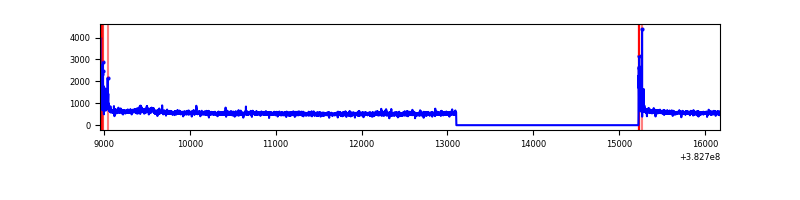 |
| D | 7219 | 5098 | 337 | 337 | 4.67% | 6.61% | 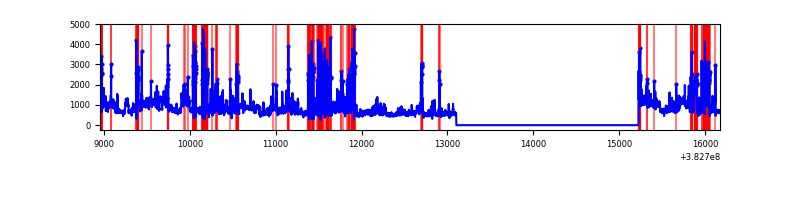 |
Top three noisy pixels from each quadrant. If the there are fewer than three noisy pixels in the level2.evt file, extra rows are filled as -1
| Pixel properties | Quadrant properties | ||||||
|---|---|---|---|---|---|---|---|
| Quadrant | DetID | PixID | Counts | Sigma | Mean | Median | Sigma |
| A | 10 | 83 | 40769 | 306.25 | 667 | 657 | 131.0 |
| A | 9 | 143 | 35130 | 263.19 | 667 | 657 | 131.0 |
| A | 13 | 6 | 12886 | 93.37 | 667 | 657 | 131.0 |
| B | 5 | 172 | 471754 | 3869.93 | 652 | 637 | 121.7 |
| B | 5 | 236 | 118358 | 967.0 | 652 | 637 | 121.7 |
| B | 0 | 245 | 106254 | 867.58 | 652 | 637 | 121.7 |
| C | 15 | 214 | 231036 | 1552.39 | 649 | 655 | 148.4 |
| C | 0 | 10 | 121883 | 816.88 | 649 | 655 | 148.4 |
| C | 14 | 67 | 46847 | 311.26 | 649 | 655 | 148.4 |
| D | 8 | 195 | 953081 | 6242.52 | 626 | 609 | 152.6 |
| D | 13 | 249 | 360838 | 2360.95 | 626 | 609 | 152.6 |
| D | 1 | 52 | 296844 | 1941.53 | 626 | 609 | 152.6 |
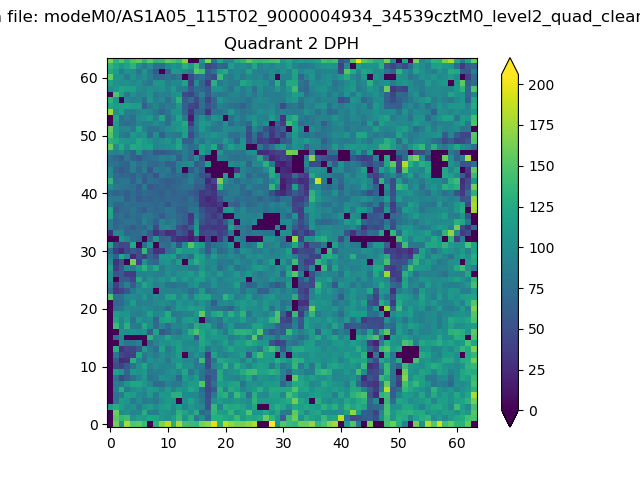
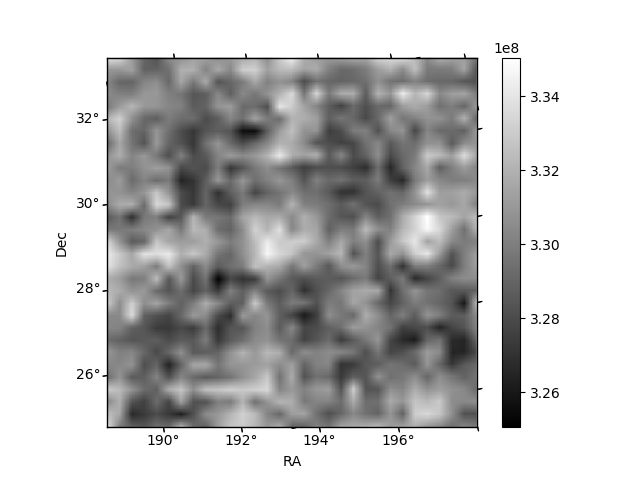
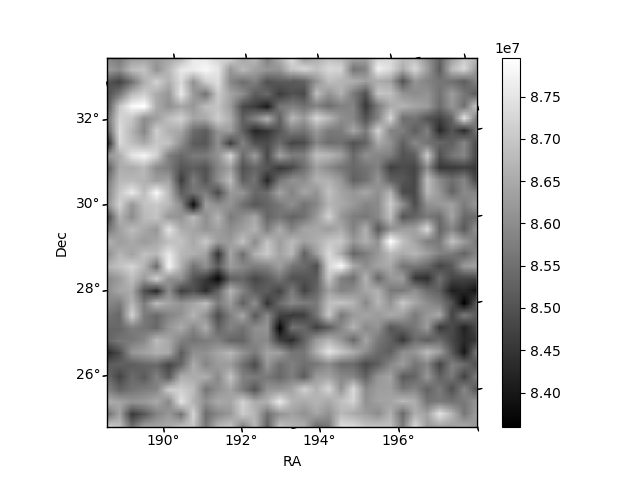
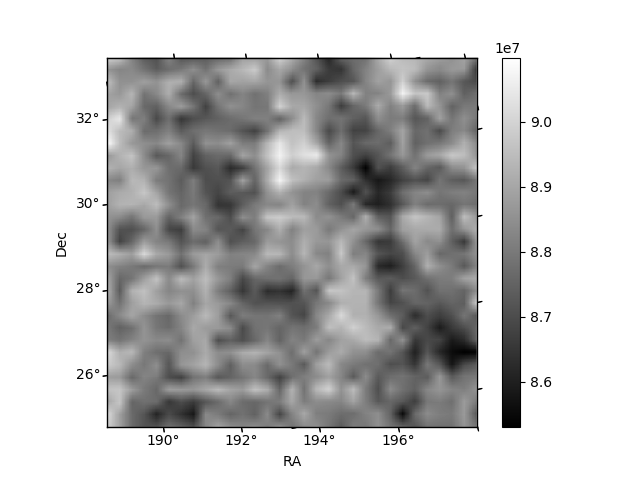
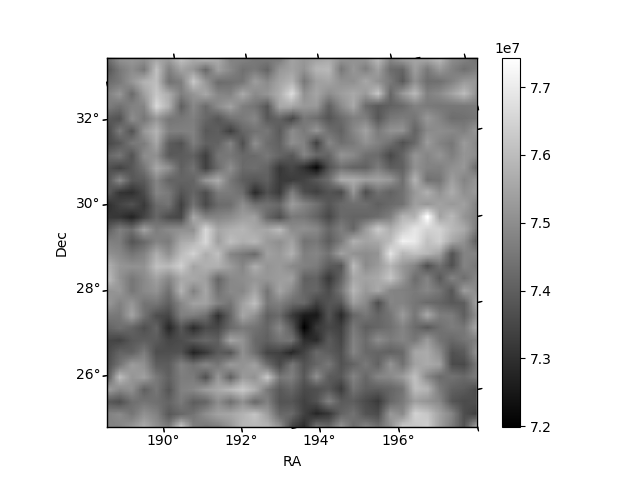
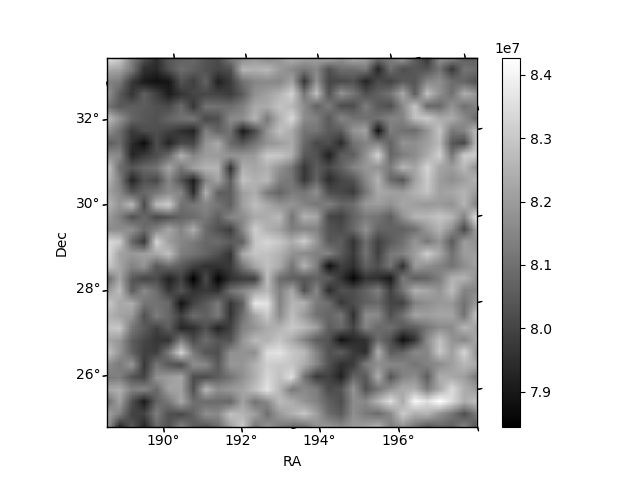
Histogram calculated using DETX and DETY for each event in the final _common_clean file
| Quadrant A | 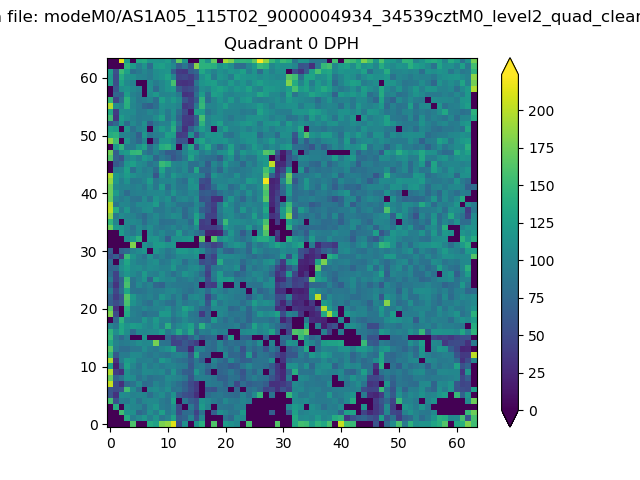 |
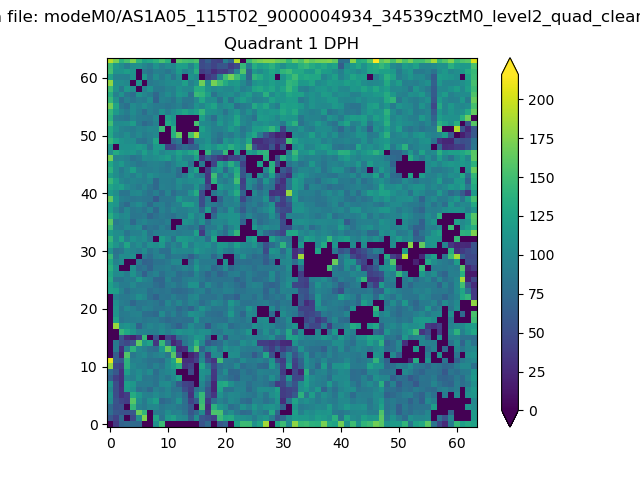 |
Quadrant B |
|---|---|---|---|
| Quadrant D | 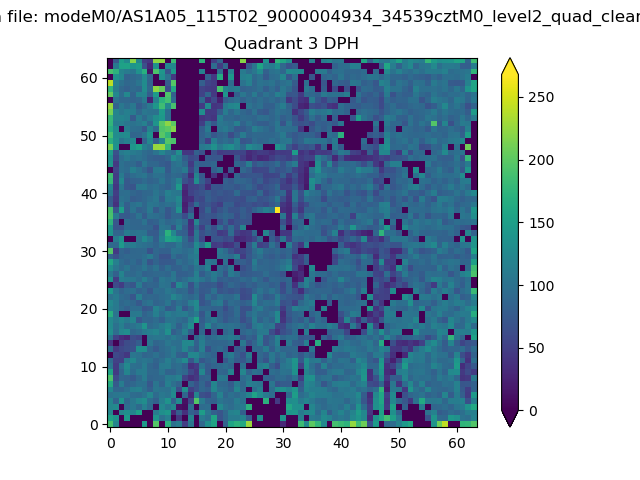 |
 |
Quadrant C |
| Plot type | Count rate plots | Images |
|---|---|---|
| Comparison with Poisson distribution Blue bars denote a histogram of data divided into 1 sec bins. Red curve is a Poisson curve with rate = median count rate of data. |
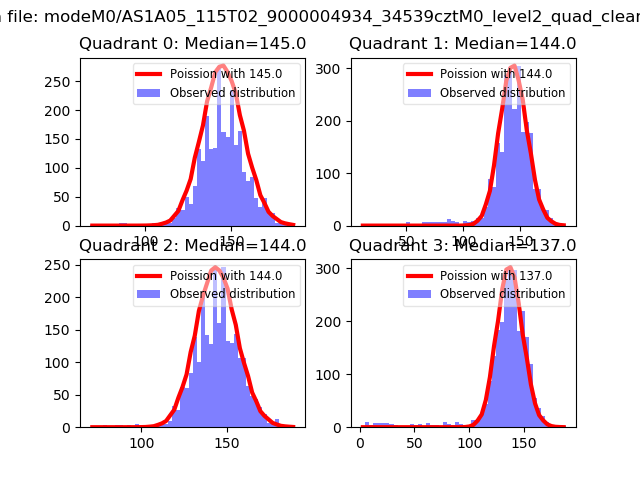 |
 |
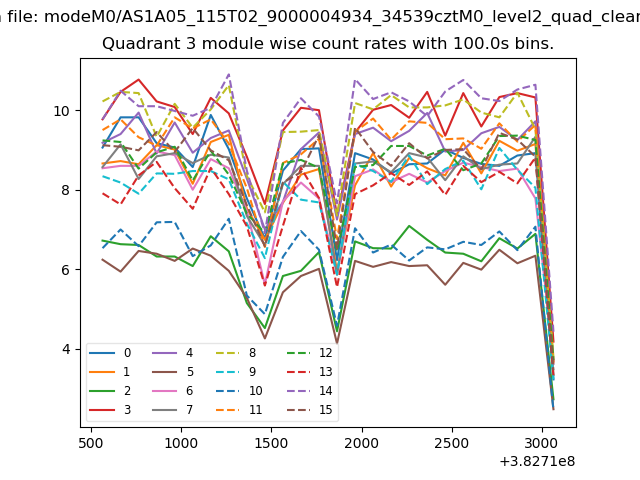
| Quadrant-wise count rates Data is divided into 100 sec bins |
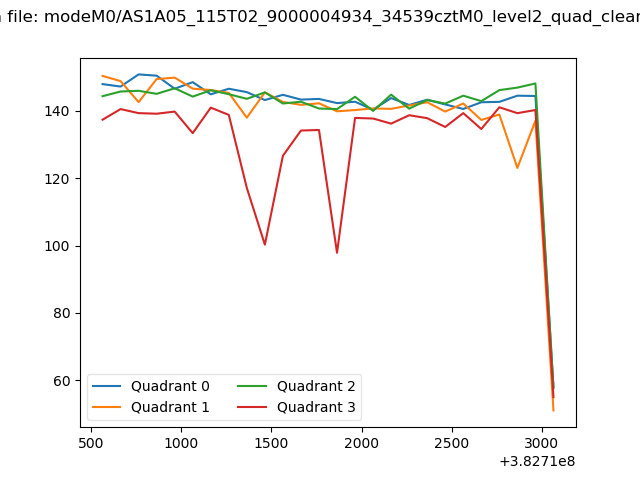 |
|
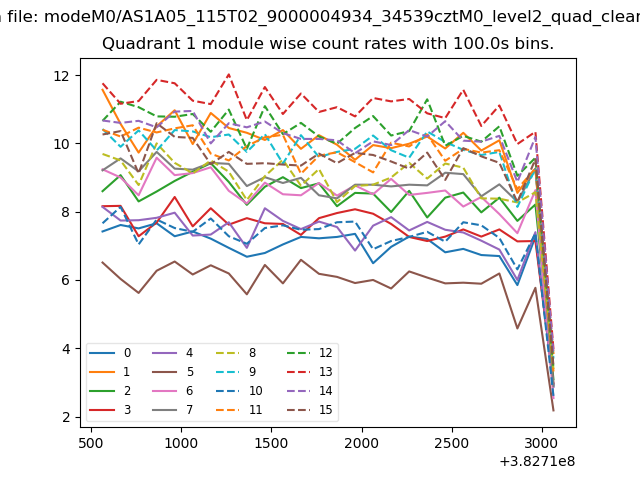
| Module-wise count rates for Quadrant A Data is divided into 100 sec bins |
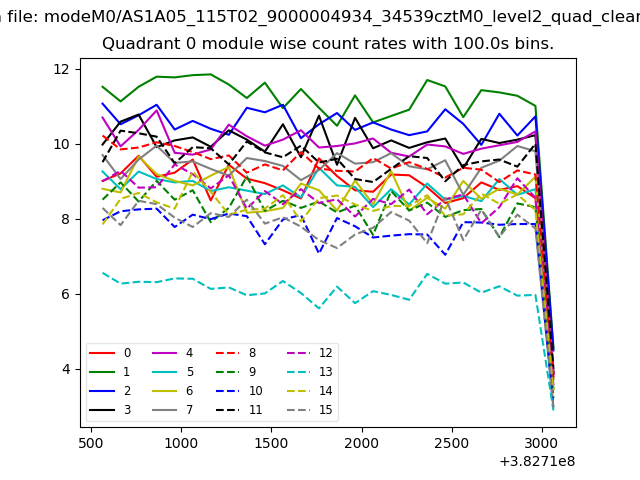 |
 |
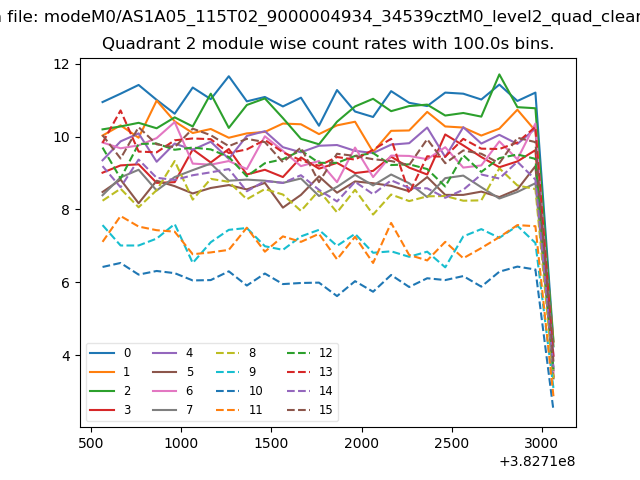
| Module-wise count rates for Quadrant B Data is divided into 100 sec bins |
 |
 |
| Module-wise count rates for Quadrant C Data is divided into 100 sec bins |
 |
 |
| Module-wise count rates for Quadrant D Data is divided into 100 sec bins |
 |
 |
| Parameter | Plot |
|---|---|
| CZT HV Monitor | 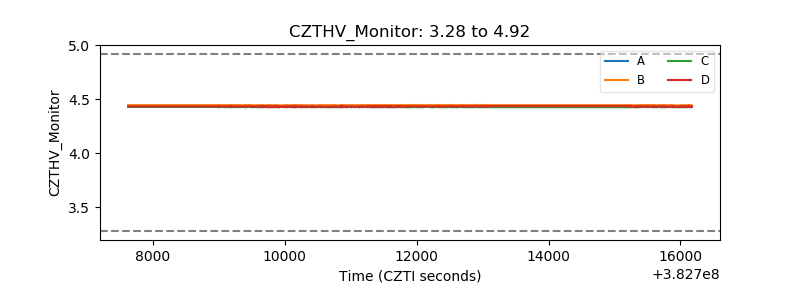 |
| D_VDD | 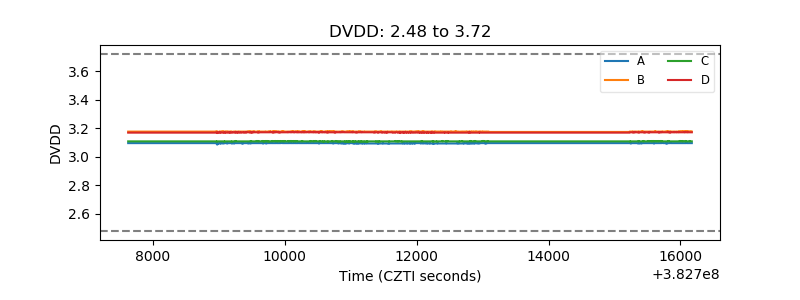 |
| Temperature 1 | 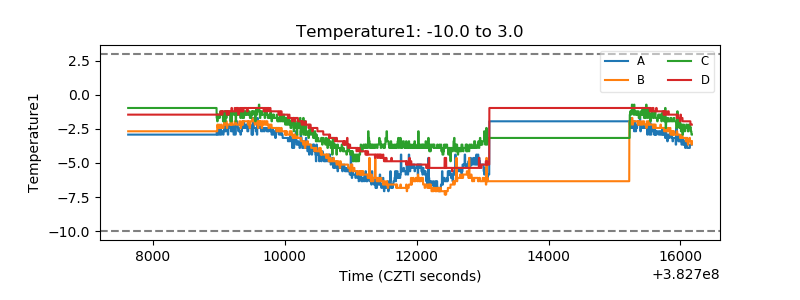 |
| Veto HV Monitor | 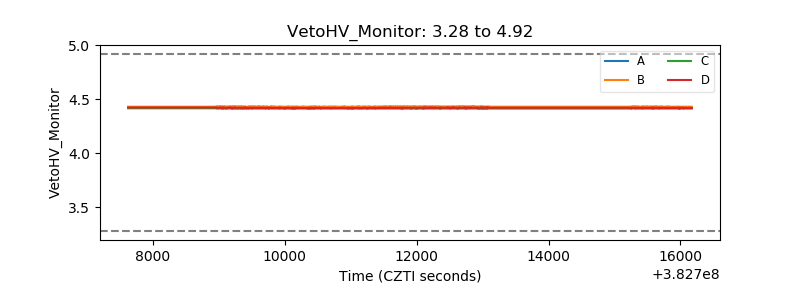 |
| Veto LLD | 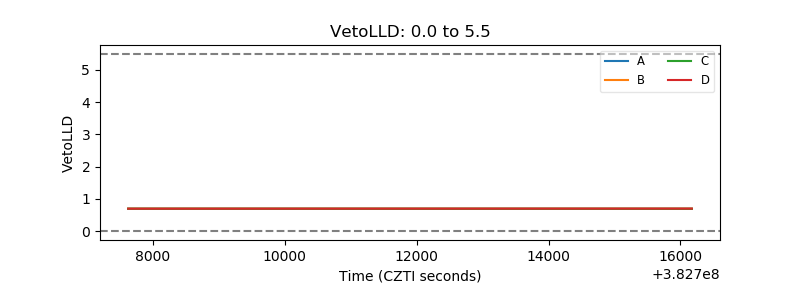 |
| Alpha Counter |  |
| _CPM_Rate | 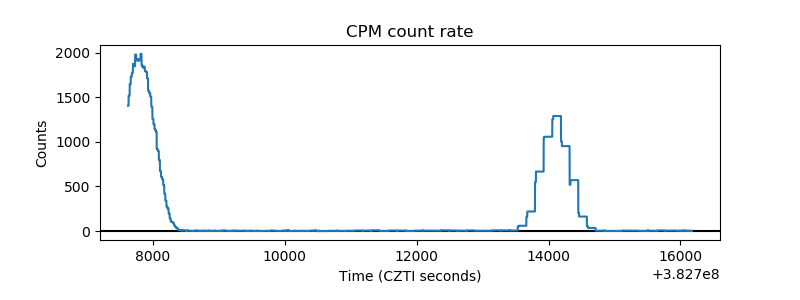 |
| CZT Counter | 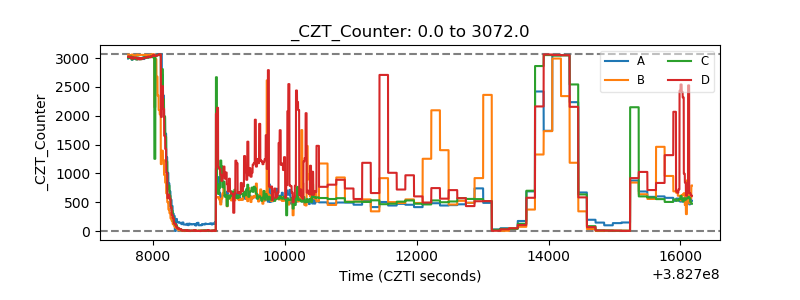 |
| +2.5 Volts monitor | 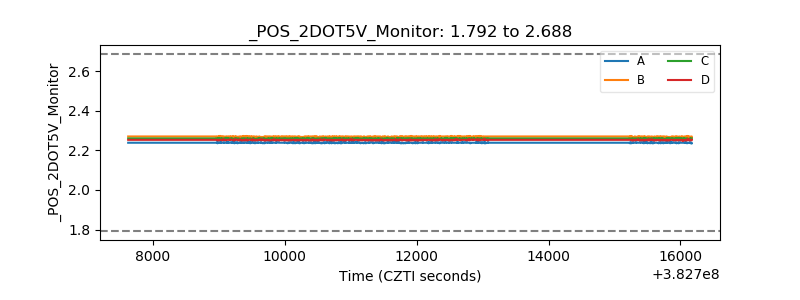 |
| +5 Volts monitor | 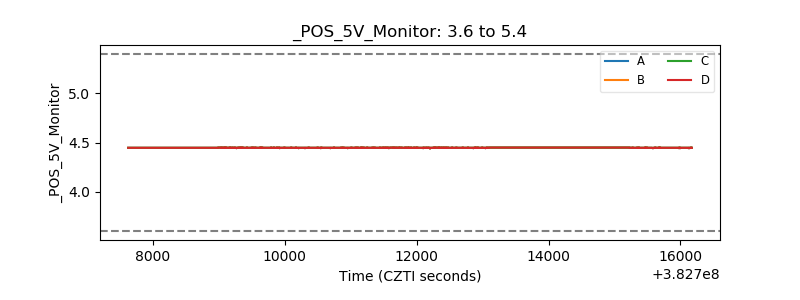 |
| _ROLL_ROT | 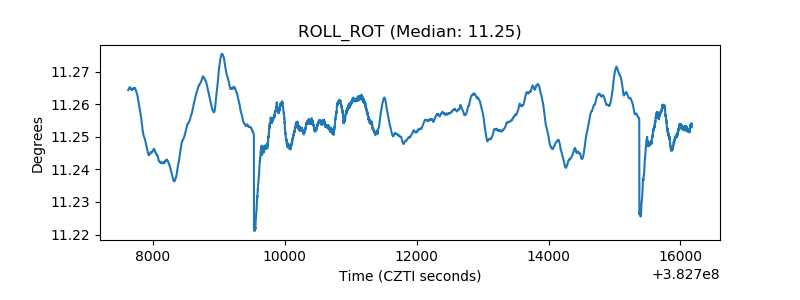 |
| _Roll_DEC | 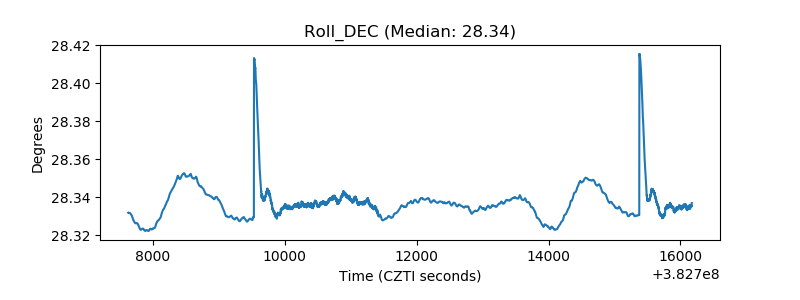 |
| _Roll_RA | 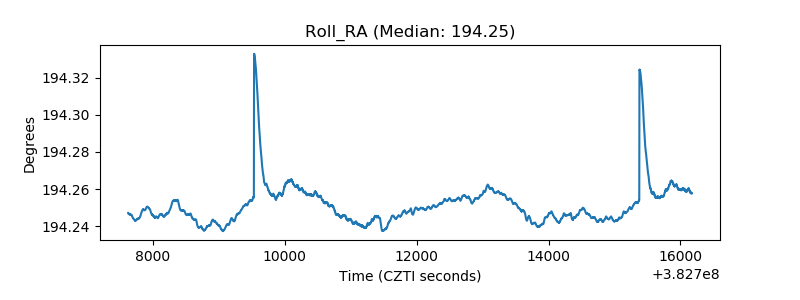 |
| Veto Counter | 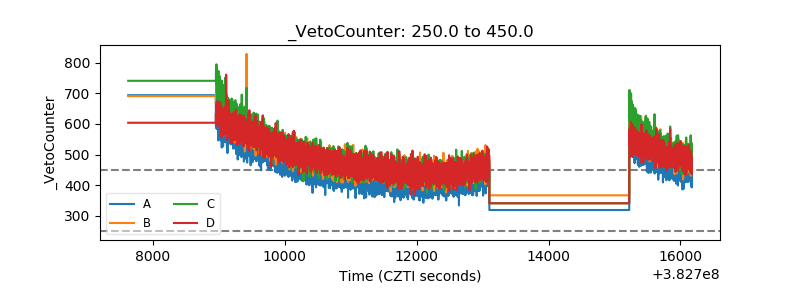 |