| Param | Original file | Final file |
|---|---|---|
| Filename | modeM0/AS1A05_115T02_9000004934_34537cztM0_level2.evt | modeM0/AS1A05_115T02_9000004934_34537cztM0_level2_quad_clean.evt |
| Size (bytes) | 467,660,160 | 52,643,520 |
| Size | 446.0 MB | 50.2 MB |
| Events in quadrant A | 2,878,009 | 311,025 |
| Events in quadrant B | 3,328,659 | 312,747 |
| Events in quadrant C | 3,148,481 | 306,462 |
| Events in quadrant D | 4,445,651 | 288,963 |
| Mode SS | |||
|---|---|---|---|
| Quadrant | BADHDUFLAG | Total packets | Discarded packets |
| A | 0 | 110 | 0 |
| B | 0 | 110 | 0 |
| C | 0 | 110 | 0 |
| D | 0 | 110 | 0 |
| Mode M0 | |||
|---|---|---|---|
| Quadrant | BADHDUFLAG | Total packets | Discarded packets |
| A | 0 | 11630 | 3 |
| B | 0 | 13156 | 2 |
| C | 0 | 12494 | 2 |
| D | 0 | 16867 | 2 |
| Mode M9 | |||
|---|---|---|---|
| Quadrant | BADHDUFLAG | Total packets | Discarded packets |
| A | 0 | 24 | 0 |
| B | 0 | 24 | 0 |
| C | 0 | 24 | 0 |
| D | 0 | 25 | 0 |
| Quadrant | Total seconds | Saturated seconds | Saturation percentage |
|---|---|---|---|
| A | 5343 | 17 | 0.318173% |
| B | 5343 | 121 | 2.264645% |
| C | 5343 | 35 | 0.655063% |
| D | 5343 | 109 | 2.040052% |
Noise dominated data is calculated using 1-second bins in cleaned event files. If a bin has >2000 counts, and if more than 50% of those come from <1% of pixels, then it is considered to be noise-dominated and hence unusable.
| Quadrant | # 1 sec bins | Bins with >0 counts | Bins with >2000 counts | High rate bins dominated by noise | Noise dominated (total time) | Noise dominated (detector-on time) | Marked lightcurve |
|---|---|---|---|---|---|---|---|
| A | 7345 | 5344 | 4 | 4 | 0.05% | 0.07% | 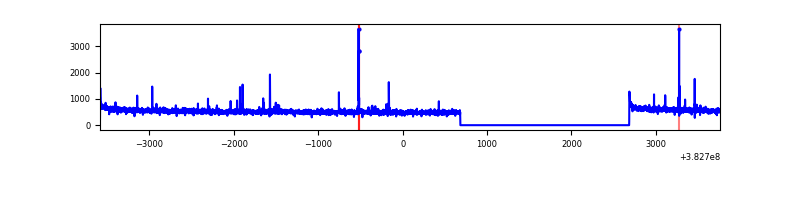 |
| B | 7345 | 5344 | 69 | 69 | 0.94% | 1.29% | 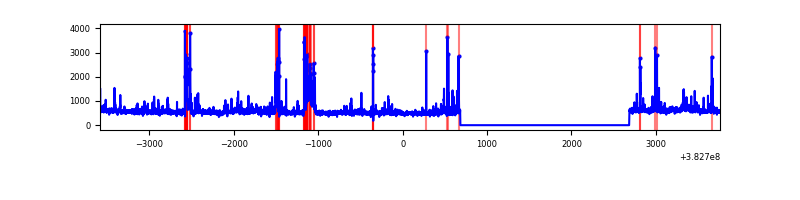 |
| C | 7345 | 5344 | 25 | 25 | 0.34% | 0.47% | 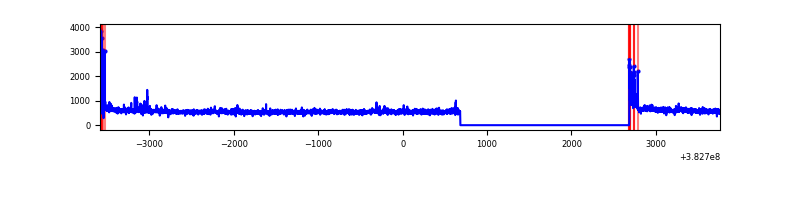 |
| D | 7345 | 5344 | 82 | 82 | 1.12% | 1.53% | 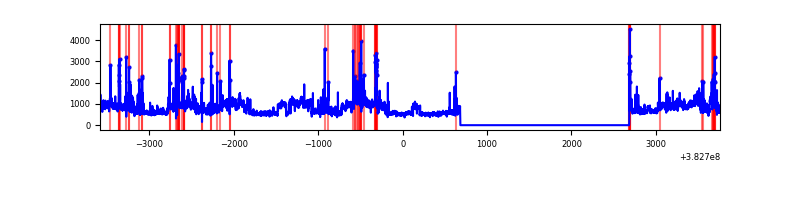 |
Top three noisy pixels from each quadrant. If the there are fewer than three noisy pixels in the level2.evt file, extra rows are filled as -1
| Pixel properties | Quadrant properties | ||||||
|---|---|---|---|---|---|---|---|
| Quadrant | DetID | PixID | Counts | Sigma | Mean | Median | Sigma |
| A | 9 | 143 | 61113 | 423.0 | 717 | 706 | 142.8 |
| A | 10 | 83 | 40026 | 275.34 | 717 | 706 | 142.8 |
| A | 13 | 254 | 8958 | 57.78 | 717 | 706 | 142.8 |
| B | 5 | 172 | 450527 | 3419.04 | 699 | 683 | 131.6 |
| B | 0 | 245 | 36068 | 268.94 | 699 | 683 | 131.6 |
| B | 4 | 171 | 16774 | 122.3 | 699 | 683 | 131.6 |
| C | 15 | 214 | 243201 | 1538.77 | 687 | 695 | 157.6 |
| C | 0 | 10 | 128286 | 809.6 | 687 | 695 | 157.6 |
| C | 14 | 67 | 90644 | 570.75 | 687 | 695 | 157.6 |
| D | 8 | 195 | 1186670 | 6993.06 | 692 | 674 | 169.6 |
| D | 12 | 6 | 119978 | 703.46 | 692 | 674 | 169.6 |
| D | 2 | 249 | 117049 | 686.19 | 692 | 674 | 169.6 |
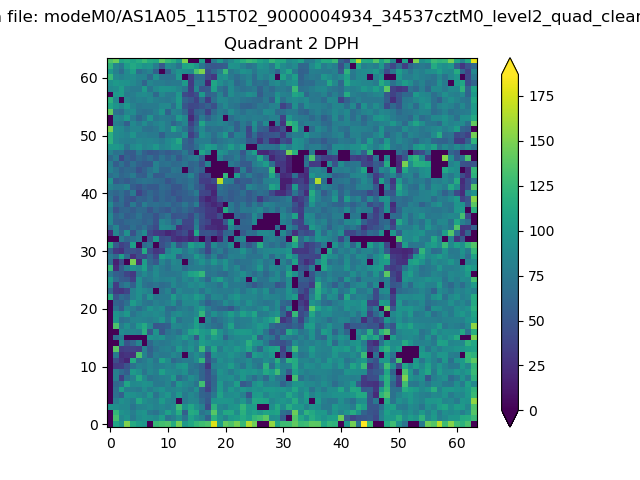
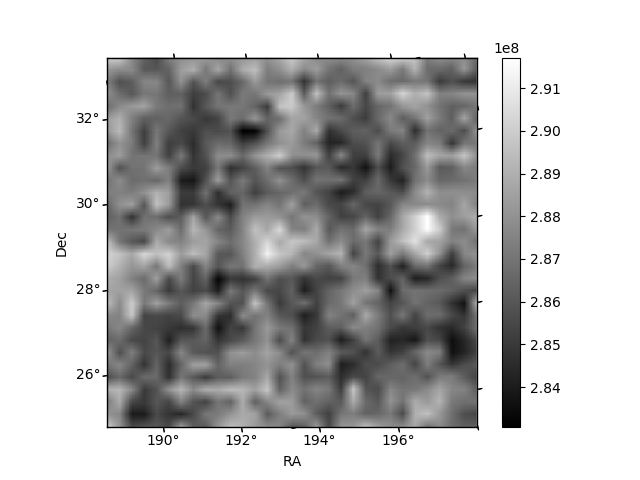
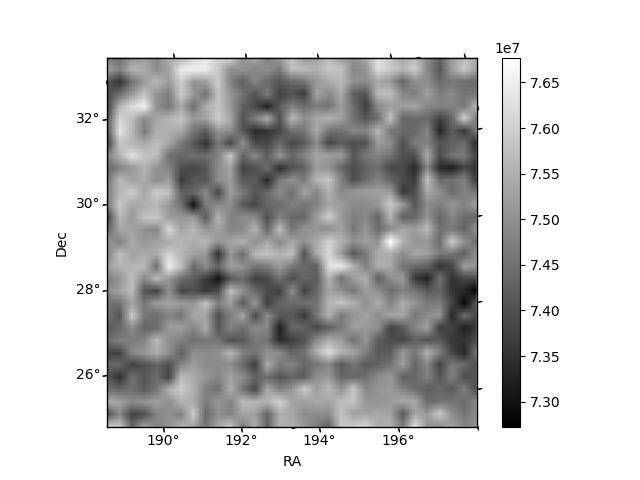
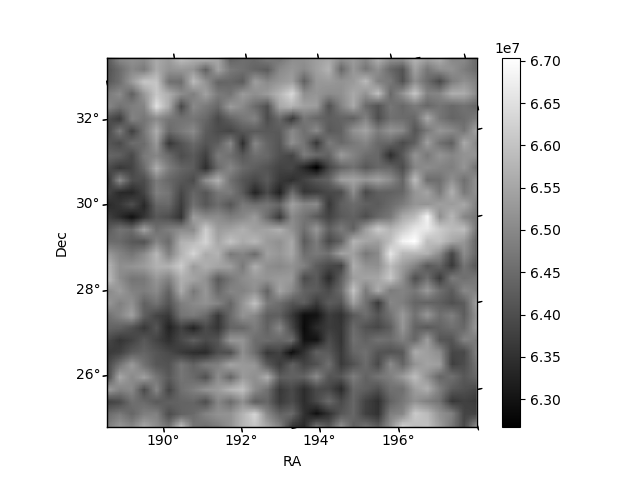
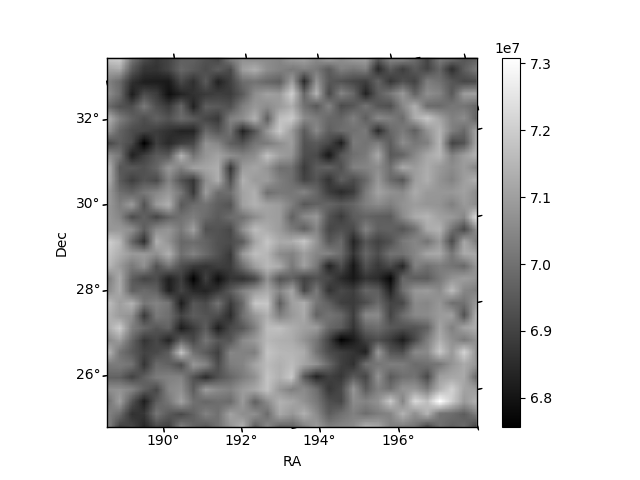
Histogram calculated using DETX and DETY for each event in the final _common_clean file
| Quadrant A | 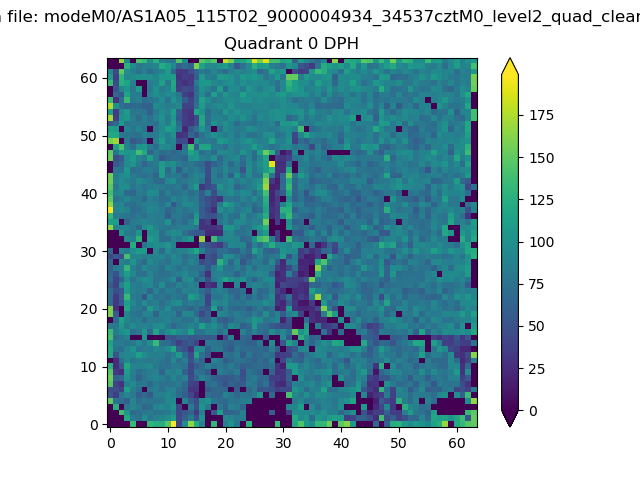 |
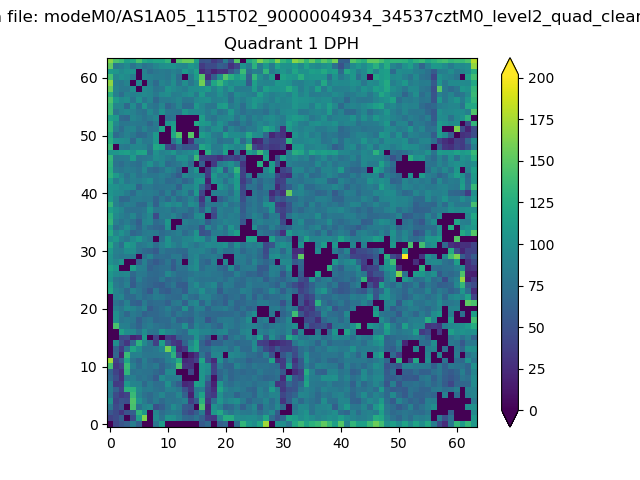 |
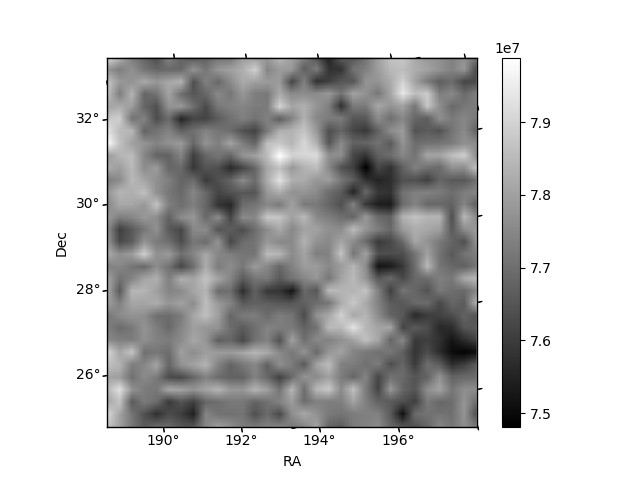
Quadrant B |
|---|---|---|---|
| Quadrant D | 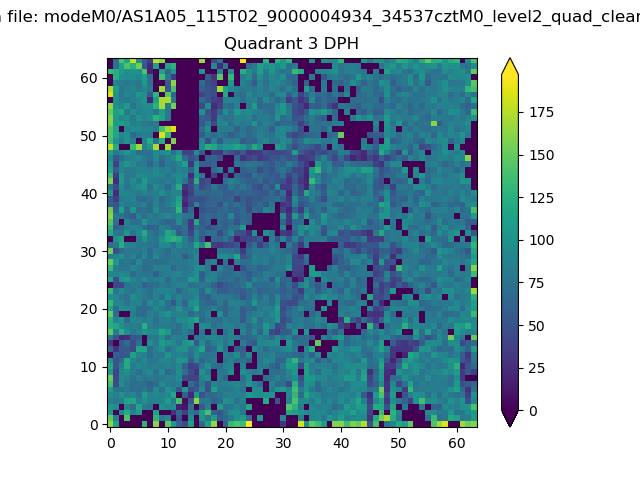 |
 |
Quadrant C |
| Plot type | Count rate plots | Images |
|---|---|---|
| Comparison with Poisson distribution Blue bars denote a histogram of data divided into 1 sec bins. Red curve is a Poisson curve with rate = median count rate of data. |
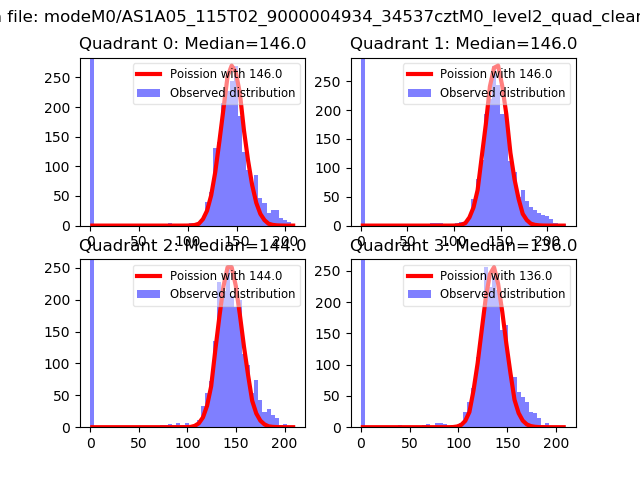 |
 |
| Quadrant-wise count rates Data is divided into 100 sec bins |
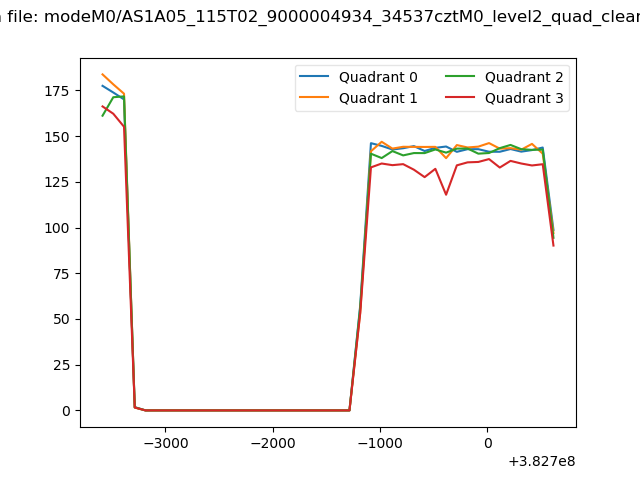 |
|
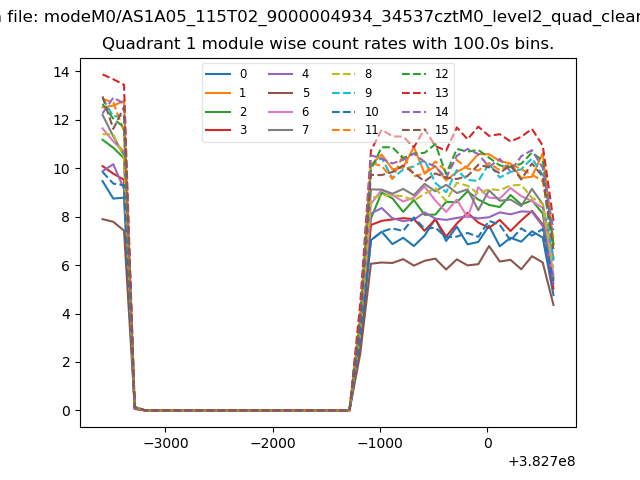
| Module-wise count rates for Quadrant A Data is divided into 100 sec bins |
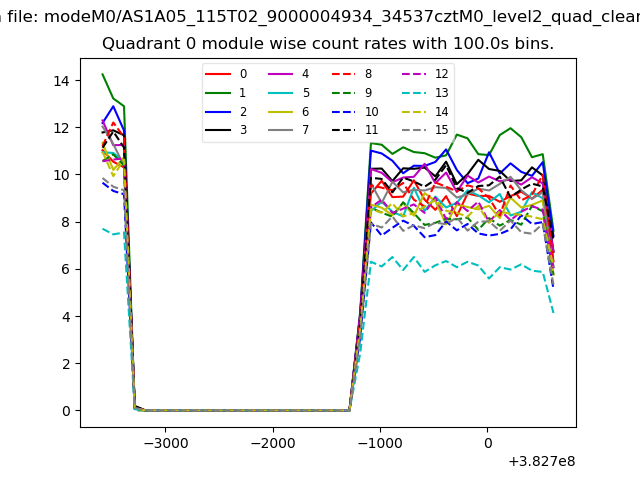 |
 |
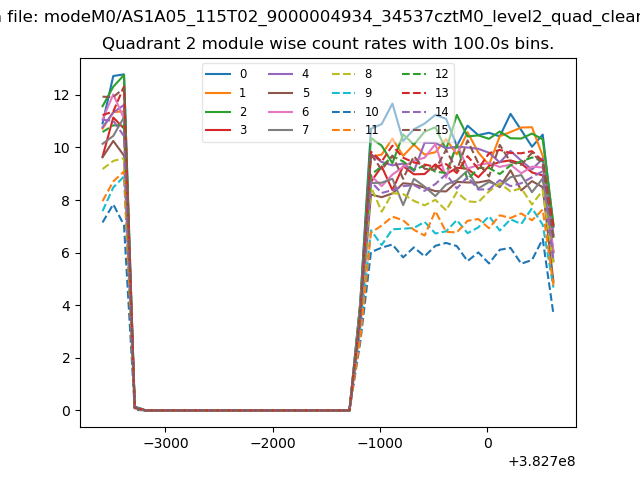
| Module-wise count rates for Quadrant B Data is divided into 100 sec bins |
 |
 |
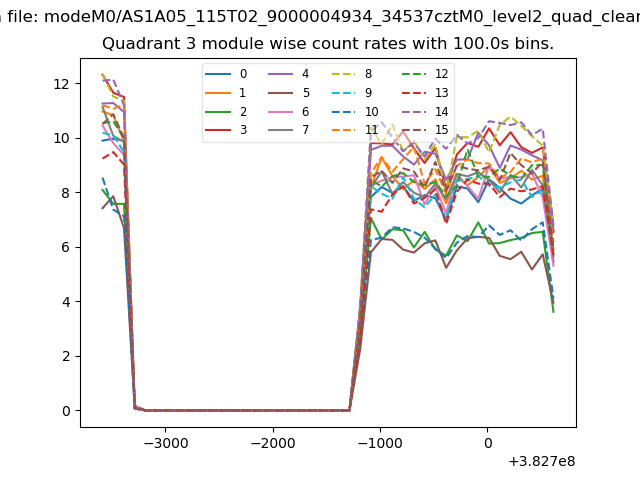
| Module-wise count rates for Quadrant C Data is divided into 100 sec bins |
 |
 |
| Module-wise count rates for Quadrant D Data is divided into 100 sec bins |
 |
 |
| Parameter | Plot |
|---|---|
| CZT HV Monitor | 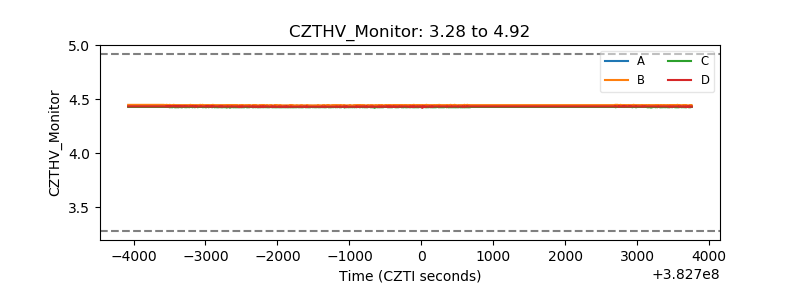 |
| D_VDD | 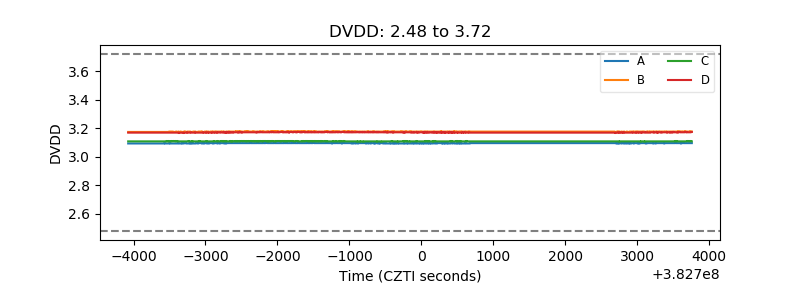 |
| Temperature 1 | 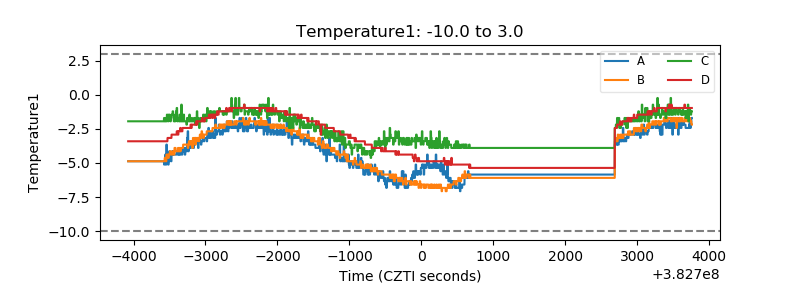 |
| Veto HV Monitor | 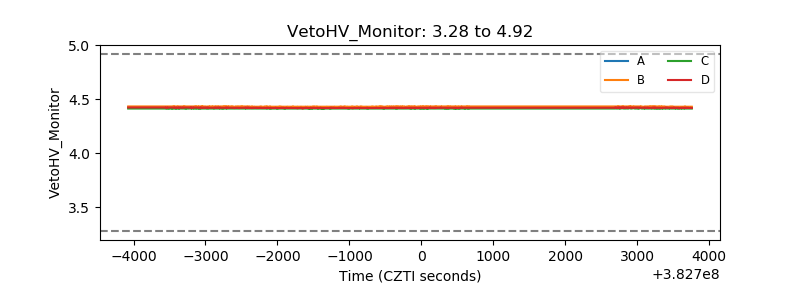 |
| Veto LLD | 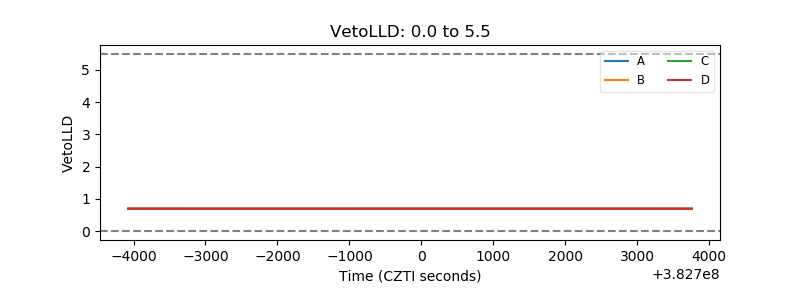 |
| Alpha Counter | 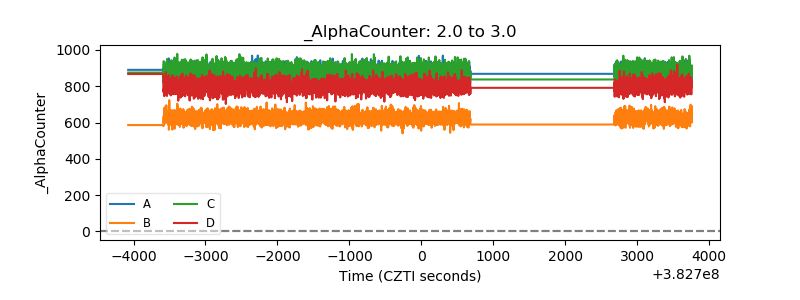 |
| _CPM_Rate | 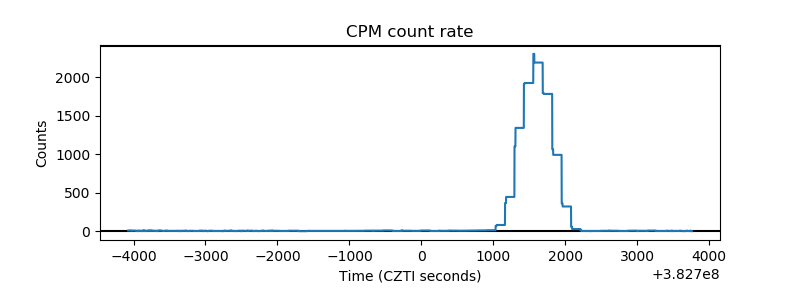 |
| CZT Counter | 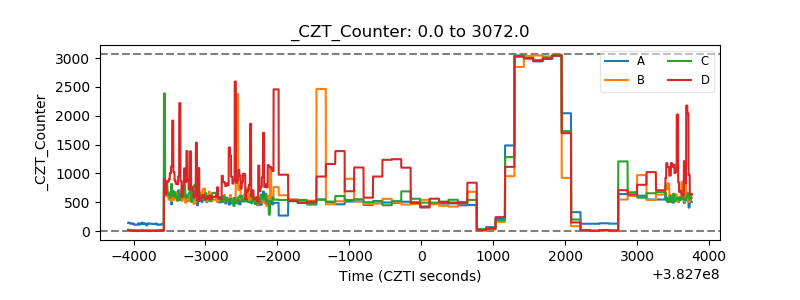 |
| +2.5 Volts monitor | 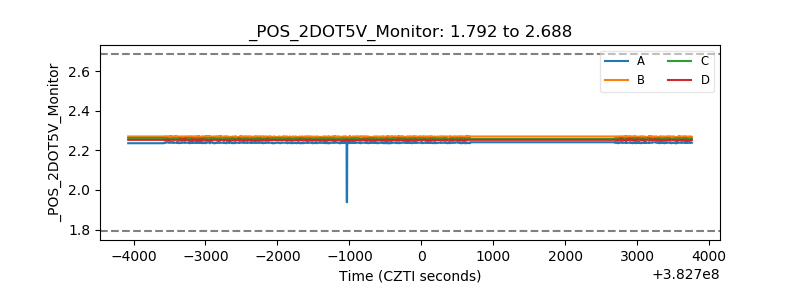 |
| +5 Volts monitor | 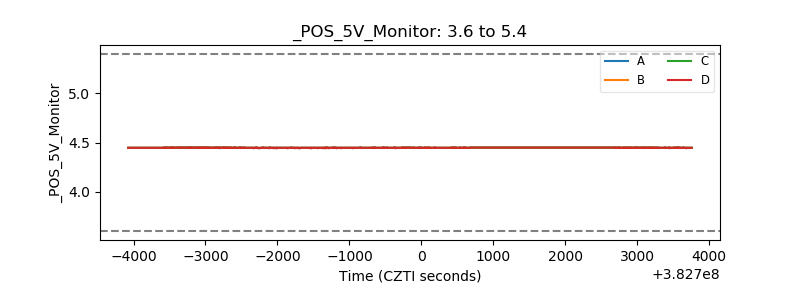 |
| _ROLL_ROT | 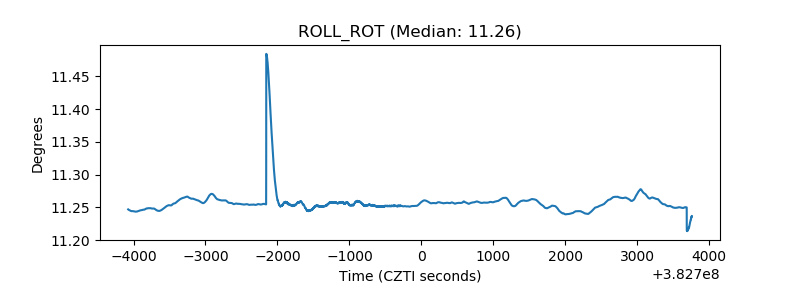 |
| _Roll_DEC | 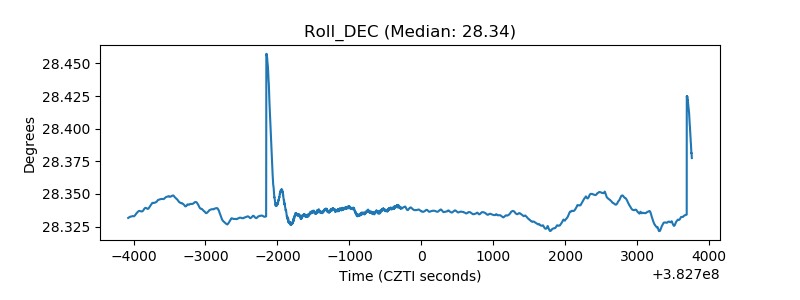 |
| _Roll_RA | 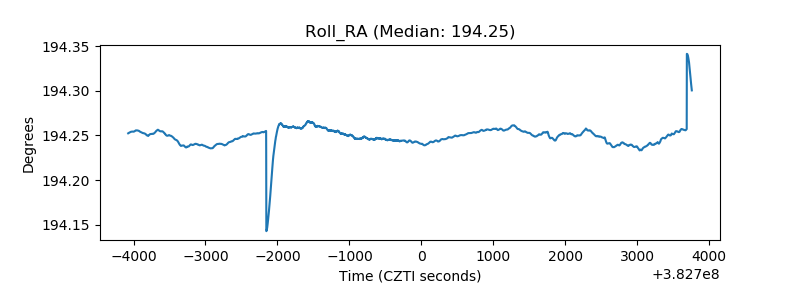 |
| Veto Counter | 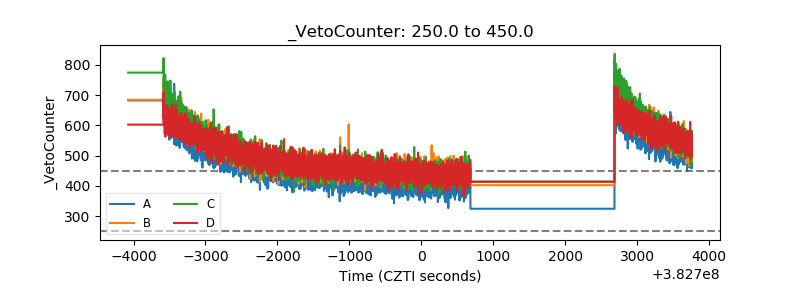 |