| Param | Original file | Final file |
|---|---|---|
| Filename | modeM0/AS1A05_115T02_9000004934cztM0_level2_bc.evt | modeM0/AS1A05_115T02_9000004934cztM0_level2_quad_clean.evt |
| Size (bytes) | 2,072,108,160 | 591,658,560 |
| Size | 1.9 GB | 564.2 MB |
| Events in quadrant A | 9,760,491 | 3,797,392 |
| Events in quadrant B | 13,241,772 | 3,765,044 |
| Events in quadrant C | 12,043,293 | 3,814,800 |
| Events in quadrant D | 24,762,014 | 3,570,191 |
| Mode SS | |||
|---|---|---|---|
| Quadrant | BADHDUFLAG | Total packets | Discarded packets |
| A | 0 | 884 | 0 |
| B | 0 | 884 | 0 |
| C | 0 | 884 | 0 |
| D | 0 | 884 | 0 |
| Mode M0 | |||
|---|---|---|---|
| Quadrant | BADHDUFLAG | Total packets | Discarded packets |
| A | 0 | 90230 | 0 |
| B | 0 | 105199 | 0 |
| C | 0 | 94073 | 0 |
| D | 0 | 139813 | 0 |
| Mode M9 | |||
|---|---|---|---|
| Quadrant | BADHDUFLAG | Total packets | Discarded packets |
| A | 0 | 171 | 0 |
| B | 0 | 171 | 0 |
| C | 0 | 171 | 0 |
| D | 0 | 171 | 0 |
| Quadrant | Total seconds | Saturated seconds | Saturation percentage |
|---|---|---|---|
| A | 43322 | 94 | 0.216980% |
| B | 43322 | 1216 | 2.806888% |
| C | 43322 | 191 | 0.440885% |
| D | 43322 | 1731 | 3.995660% |
Noise dominated data is calculated using 1-second bins in cleaned event files. If a bin has >2000 counts, and if more than 50% of those come from <1% of pixels, then it is considered to be noise-dominated and hence unusable.
| Quadrant | # 1 sec bins | Bins with >0 counts | Bins with >2000 counts | High rate bins dominated by noise | Noise dominated (total time) | Noise dominated (detector-on time) | Marked lightcurve |
|---|---|---|---|---|---|---|---|
| A | 58884 | 43328 | 12 | 12 | 0.02% | 0.03% | 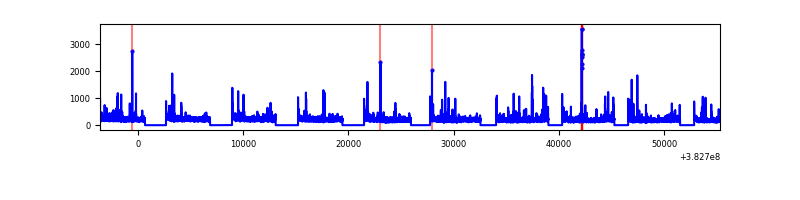 |
| B | 58884 | 43321 | 127 | 127 | 0.22% | 0.29% | 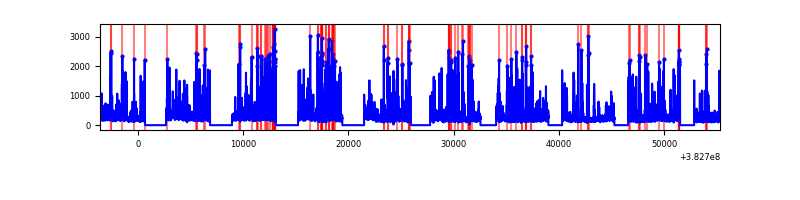 |
| C | 58884 | 43323 | 26 | 26 | 0.04% | 0.06% | 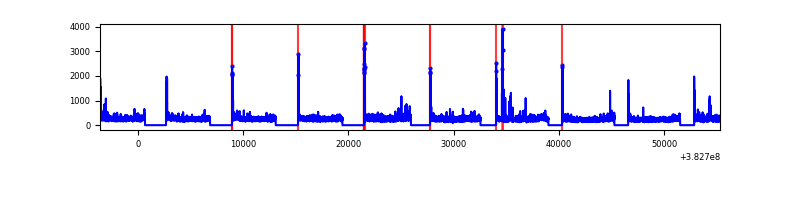 |
| D | 58884 | 43321 | 295 | 295 | 0.50% | 0.68% | 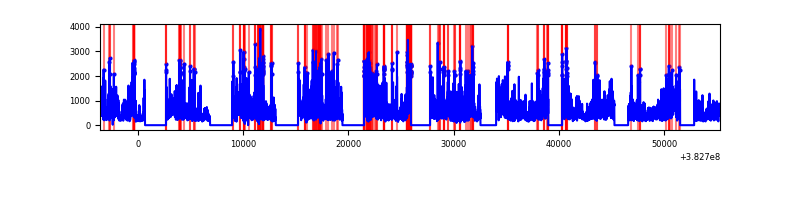 |
Top three noisy pixels from each quadrant. If the there are fewer than three noisy pixels in the level2.evt file, extra rows are filled as -1
| Pixel properties | Quadrant properties | ||||||
|---|---|---|---|---|---|---|---|
| Quadrant | DetID | PixID | Counts | Sigma | Mean | Median | Sigma |
| A | 9 | 143 | 336449 | 652.61 | 2349 | 2315 | 512.0 |
| A | 10 | 83 | 218422 | 422.09 | 2349 | 2315 | 512.0 |
| A | 13 | 254 | 68679 | 129.62 | 2349 | 2315 | 512.0 |
| B | 5 | 172 | 2916668 | 6447.77 | 2330 | 2287 | 452.0 |
| B | 0 | 245 | 333471 | 732.71 | 2330 | 2287 | 452.0 |
| B | 0 | 229 | 238566 | 522.74 | 2330 | 2287 | 452.0 |
| C | 15 | 214 | 1841289 | 3532.09 | 2303 | 2292 | 520.7 |
| C | 14 | 67 | 515282 | 985.28 | 2303 | 2292 | 520.7 |
| C | 0 | 10 | 442416 | 845.33 | 2303 | 2292 | 520.7 |
| D | 8 | 195 | 9407357 | 16602.51 | 2280 | 2220 | 566.5 |
| D | 7 | 80 | 1153782 | 2032.81 | 2280 | 2220 | 566.5 |
| D | 1 | 52 | 907349 | 1597.79 | 2280 | 2220 | 566.5 |
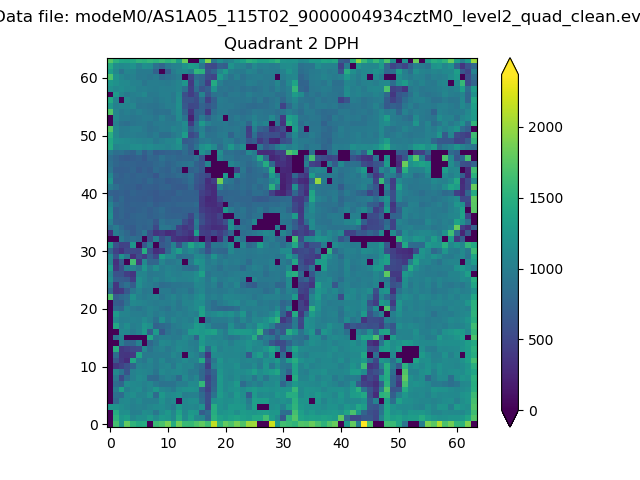
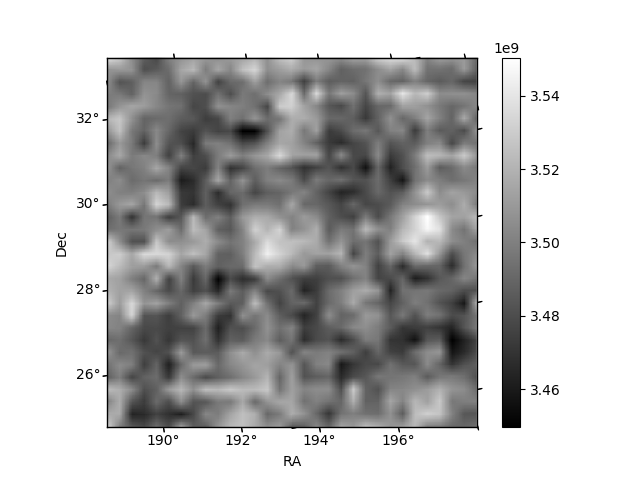
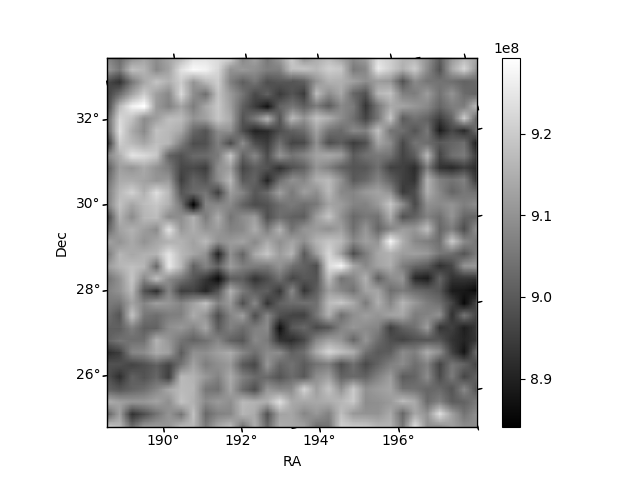
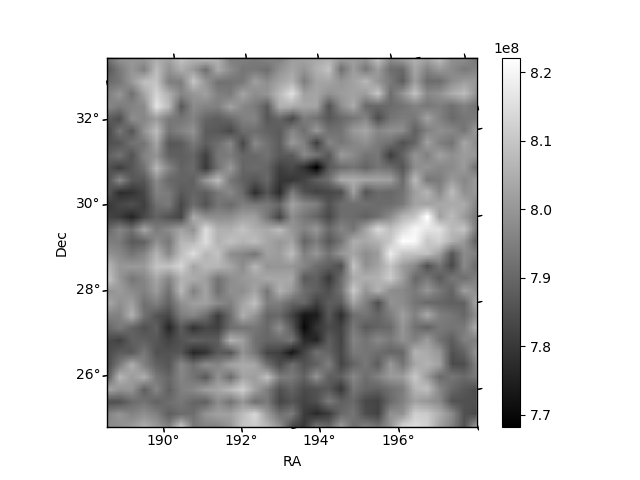
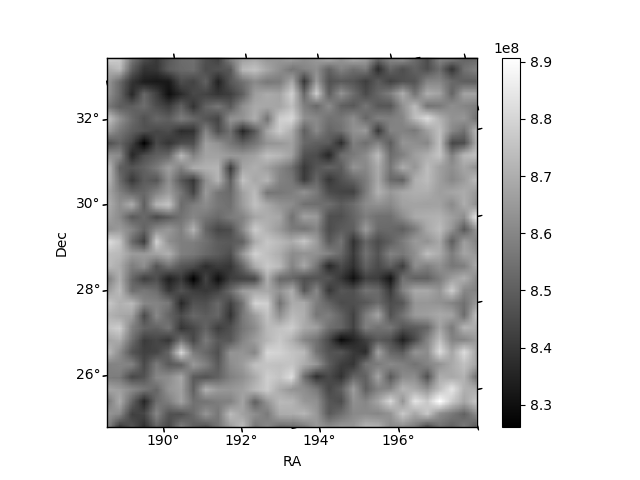
Histogram calculated using DETX and DETY for each event in the final _common_clean file
| Quadrant A | 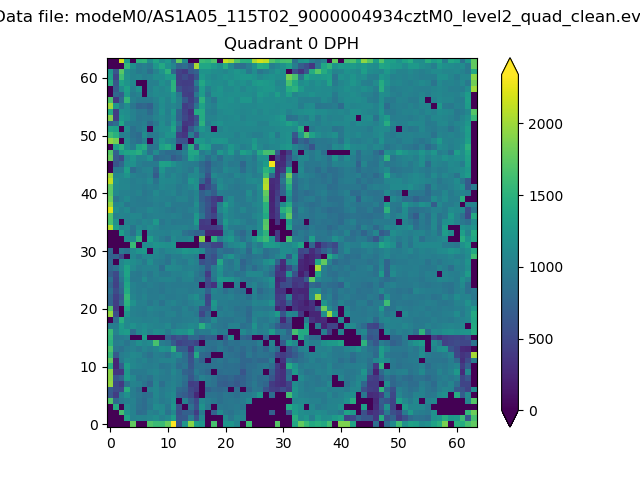 |
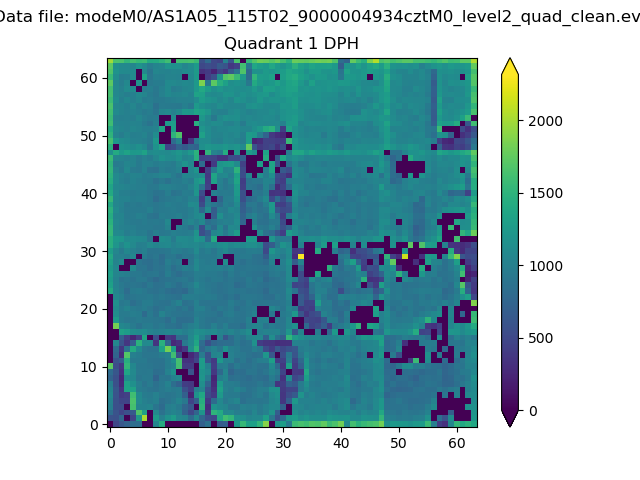 |
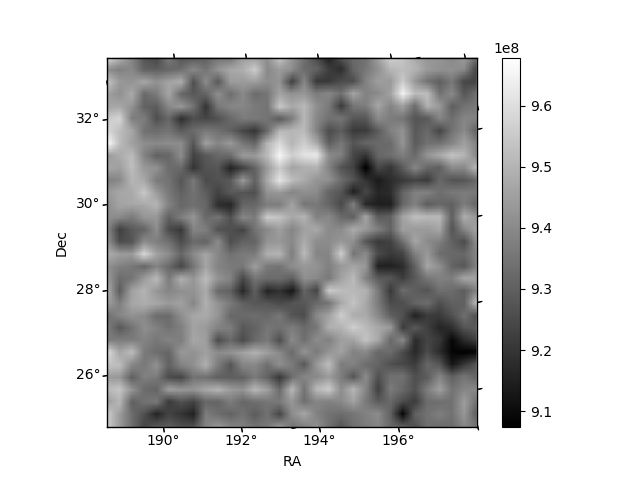
Quadrant B |
|---|---|---|---|
| Quadrant D | 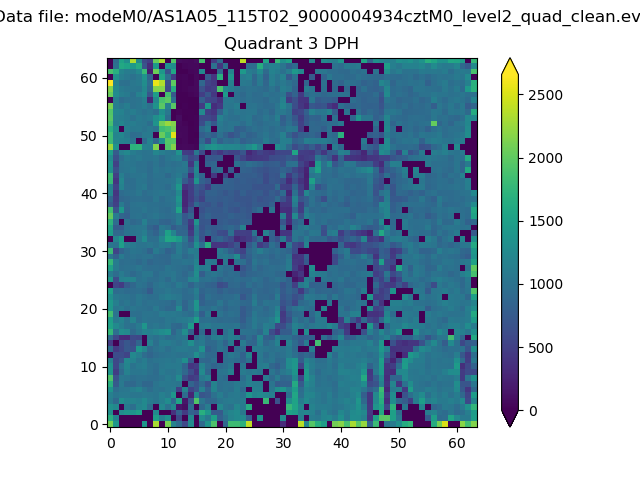 |
 |
Quadrant C |
| Plot type | Count rate plots | Images |
|---|---|---|
| Comparison with Poisson distribution Blue bars denote a histogram of data divided into 1 sec bins. Red curve is a Poisson curve with rate = median count rate of data. |
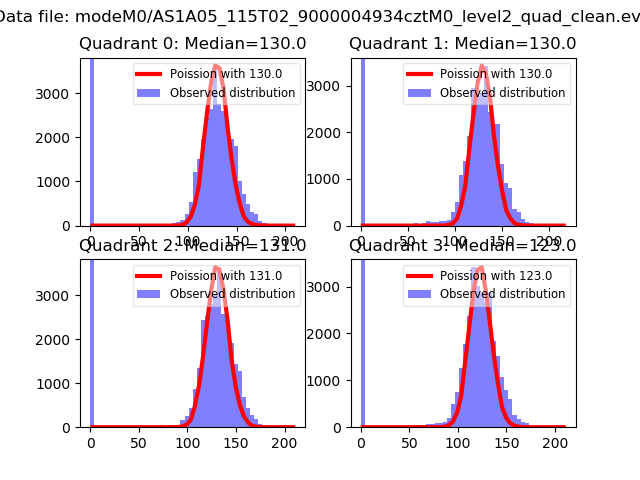 |
 |
| Quadrant-wise count rates Data is divided into 100 sec bins |
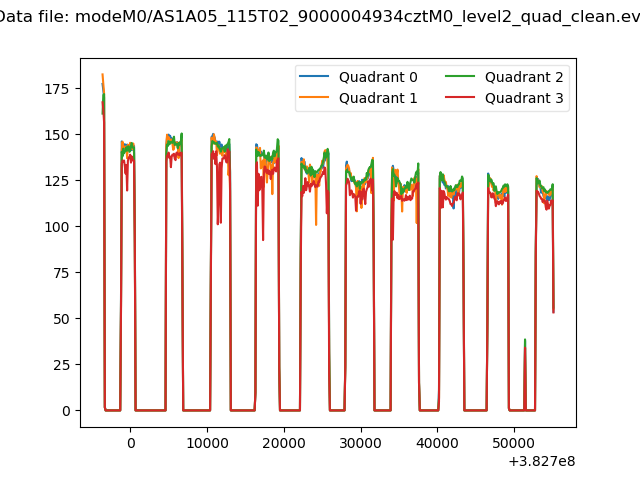 |
|
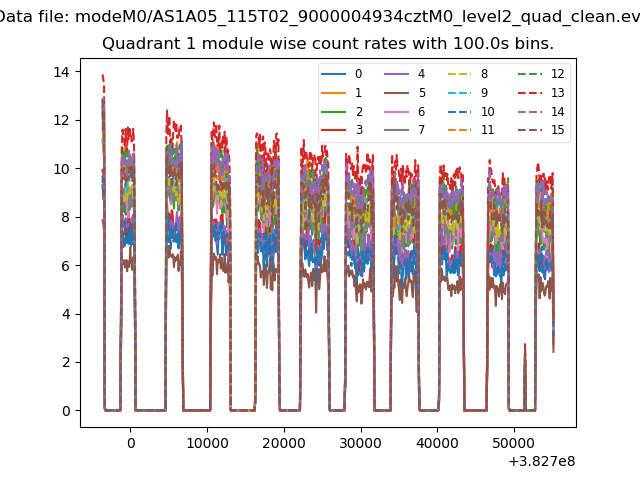
| Module-wise count rates for Quadrant A Data is divided into 100 sec bins |
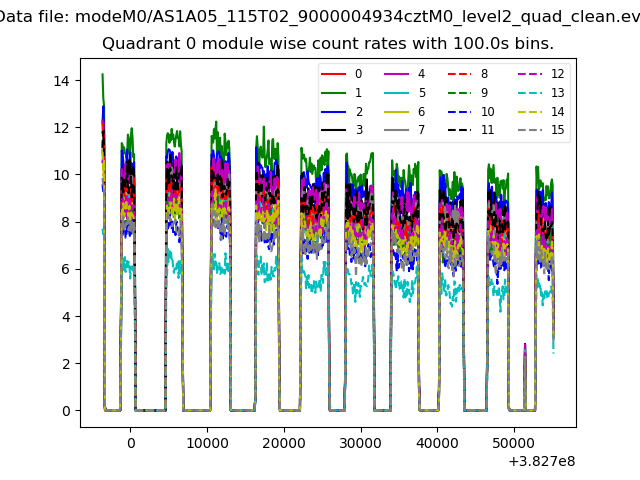 |
 |
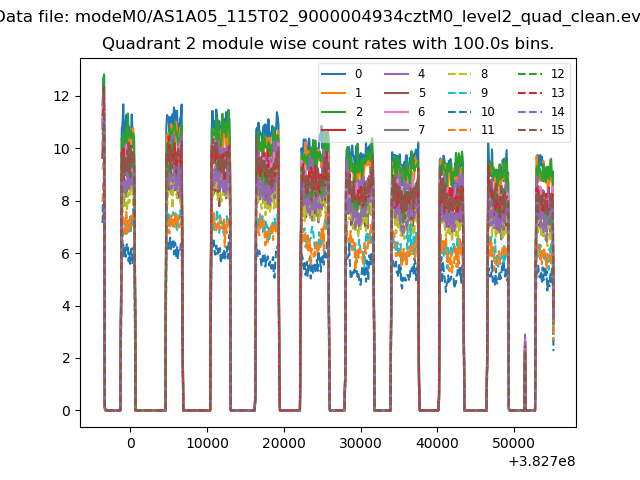
| Module-wise count rates for Quadrant B Data is divided into 100 sec bins |
 |
 |
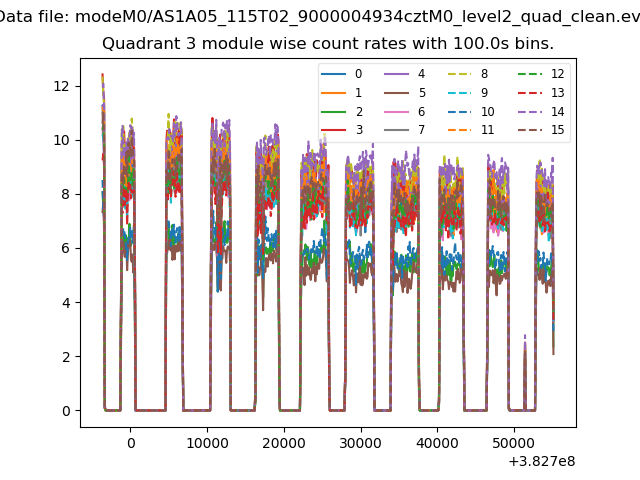
| Module-wise count rates for Quadrant C Data is divided into 100 sec bins |
 |
 |
| Module-wise count rates for Quadrant D Data is divided into 100 sec bins |
 |
 |
| Parameter | Plot |
|---|---|
| CZT HV Monitor | 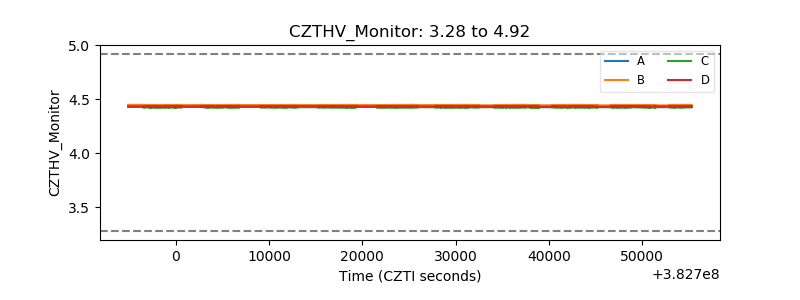 |
| D_VDD | 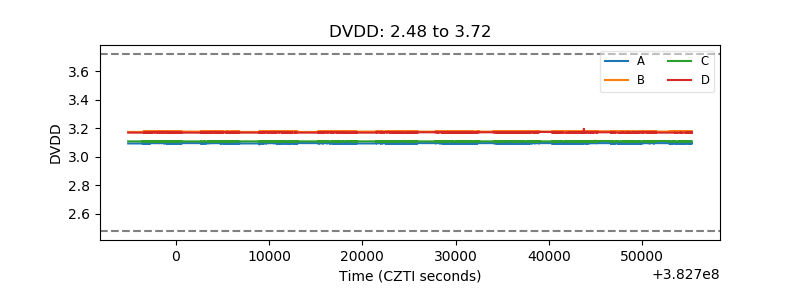 |
| Temperature 1 | 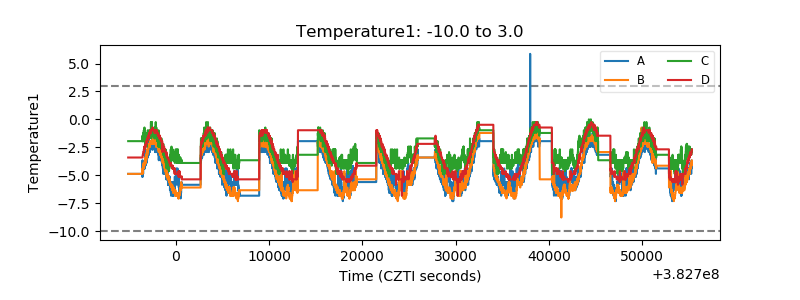 |
| Veto HV Monitor | 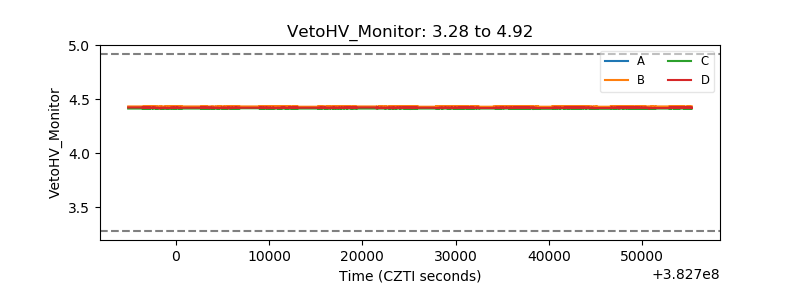 |
| Veto LLD | 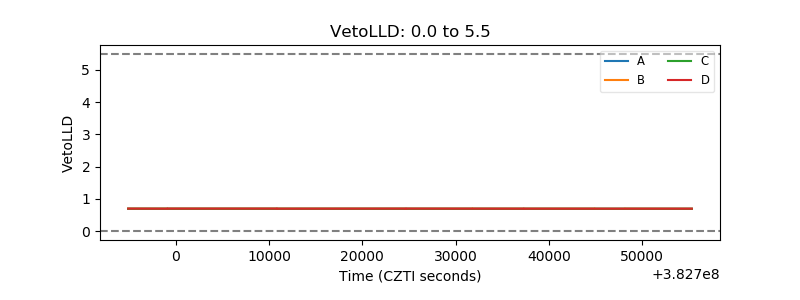 |
| Alpha Counter | 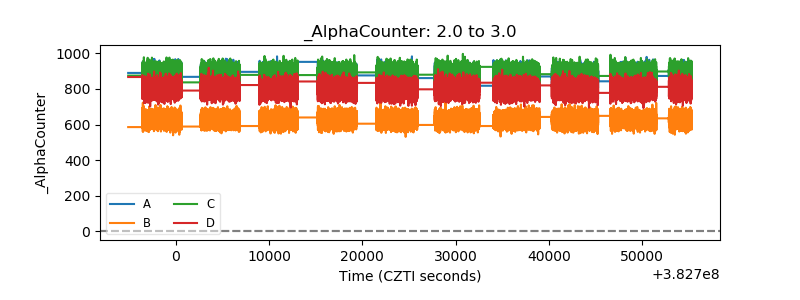 |
| _CPM_Rate | 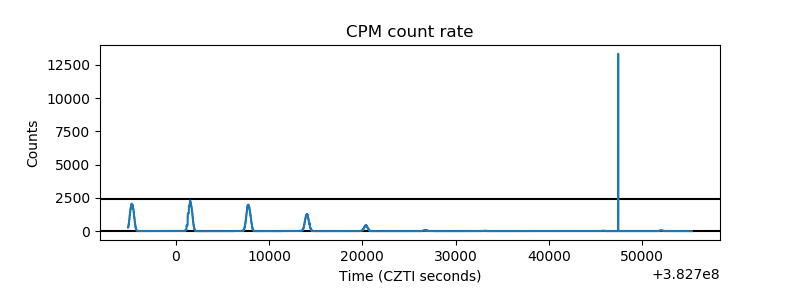 |
| CZT Counter | 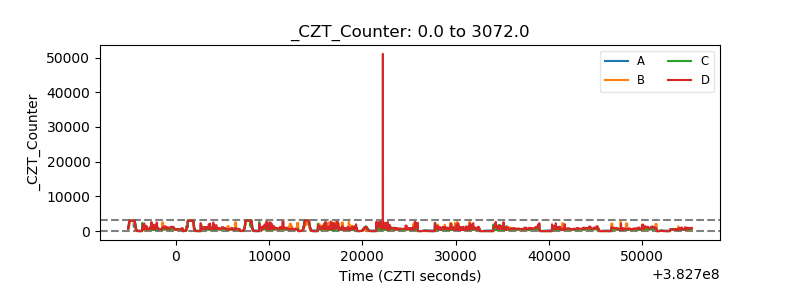 |
| +2.5 Volts monitor | 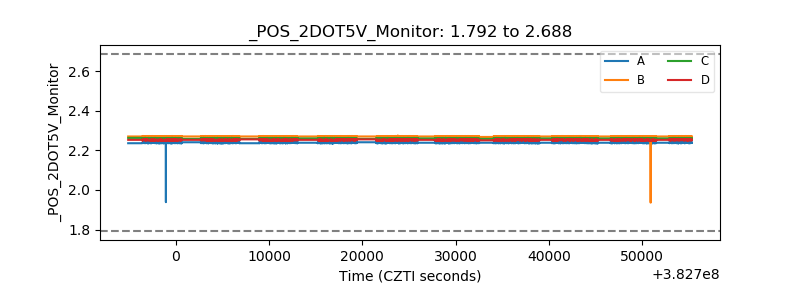 |
| +5 Volts monitor | 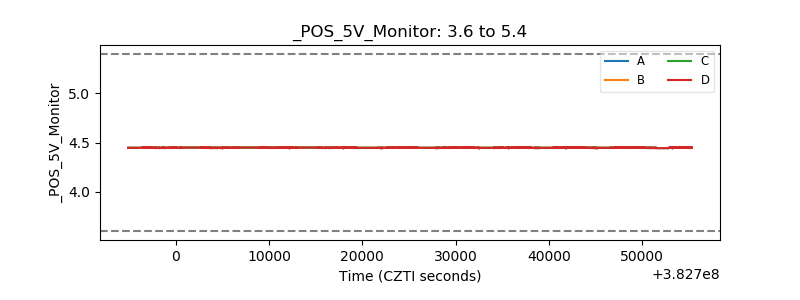 |
| _ROLL_ROT | 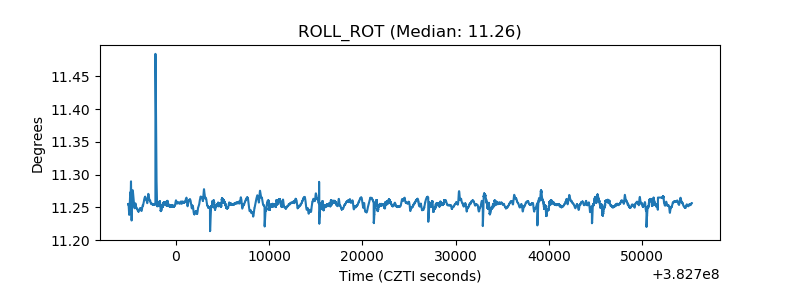 |
| _Roll_DEC | 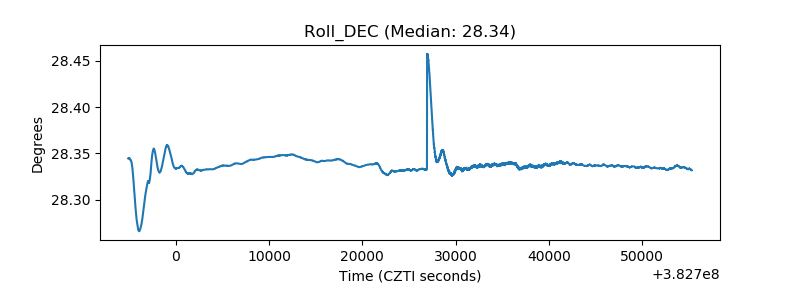 |
| _Roll_RA | 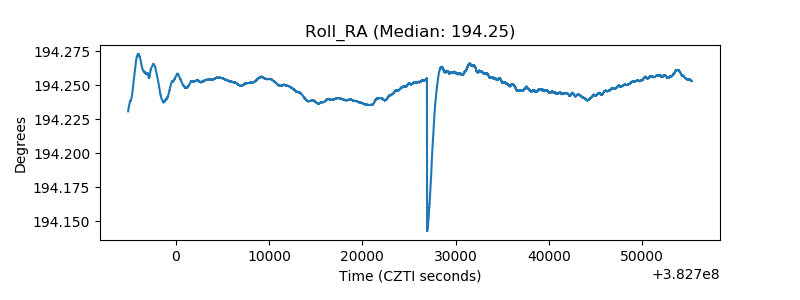 |
| Veto Counter | 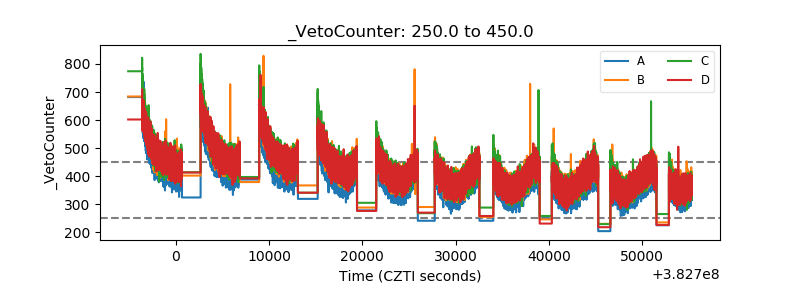 |