| Param | Original file | Final file |
|---|---|---|
| Filename | modeM0/AS1A06_005T01_9000004932_34536cztM0_level2.evt | modeM0/AS1A06_005T01_9000004932_34536cztM0_level2_quad_clean.evt |
| Size (bytes) | 315,132,480 | 37,356,480 |
| Size | 300.5 MB | 35.6 MB |
| Events in quadrant A | 1,781,277 | 224,436 |
| Events in quadrant B | 2,701,020 | 214,727 |
| Events in quadrant C | 2,119,415 | 223,676 |
| Events in quadrant D | 2,695,712 | 211,839 |
| Mode M9 | |||
|---|---|---|---|
| Quadrant | BADHDUFLAG | Total packets | Discarded packets |
| A | 0 | 4 | 0 |
| B | 0 | 4 | 0 |
| C | 0 | 4 | 0 |
| D | 0 | 5 | 0 |
| Mode SS | |||
|---|---|---|---|
| Quadrant | BADHDUFLAG | Total packets | Discarded packets |
| A | 0 | 72 | 0 |
| B | 0 | 72 | 0 |
| C | 0 | 72 | 0 |
| D | 0 | 72 | 0 |
| Mode M0 | |||
|---|---|---|---|
| Quadrant | BADHDUFLAG | Total packets | Discarded packets |
| A | 0 | 7455 | 1 |
| B | 0 | 10329 | 1 |
| C | 0 | 8479 | 1 |
| D | 0 | 10373 | 1 |
| Quadrant | Total seconds | Saturated seconds | Saturation percentage |
|---|---|---|---|
| A | 3616 | 3 | 0.082965% |
| B | 3616 | 256 | 7.079646% |
| C | 3616 | 16 | 0.442478% |
| D | 3616 | 76 | 2.101770% |
Noise dominated data is calculated using 1-second bins in cleaned event files. If a bin has >2000 counts, and if more than 50% of those come from <1% of pixels, then it is considered to be noise-dominated and hence unusable.
| Quadrant | # 1 sec bins | Bins with >0 counts | Bins with >2000 counts | High rate bins dominated by noise | Noise dominated (total time) | Noise dominated (detector-on time) | Marked lightcurve |
|---|---|---|---|---|---|---|---|
| A | 3616 | 3616 | 0 | 0 | 0.00% | 0.00% | 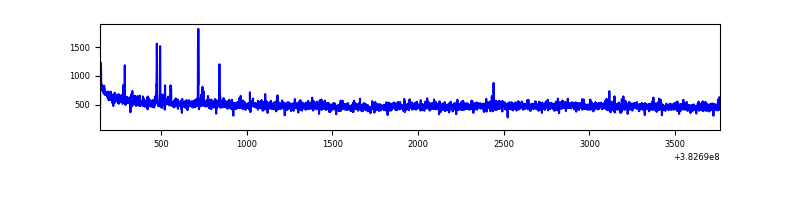 |
| B | 3616 | 3616 | 164 | 164 | 4.54% | 4.54% | 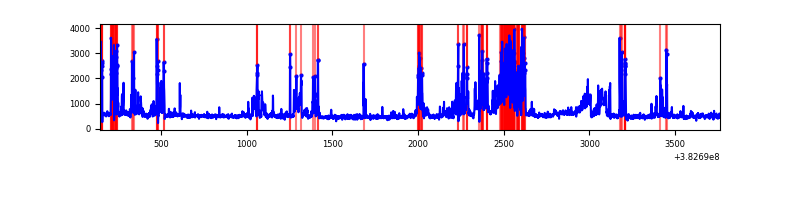 |
| C | 3616 | 3616 | 12 | 12 | 0.33% | 0.33% | 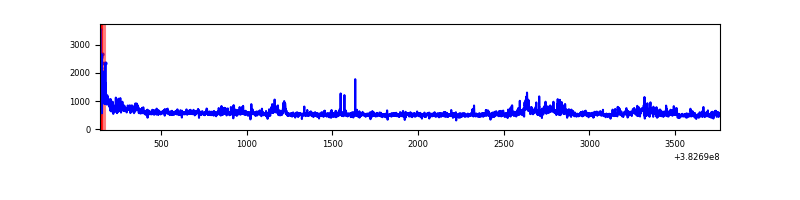 |
| D | 3616 | 3616 | 56 | 56 | 1.55% | 1.55% | 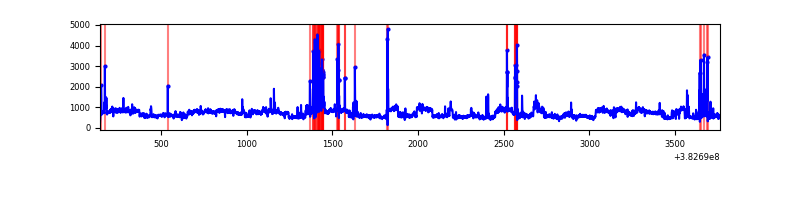 |
Top three noisy pixels from each quadrant. If the there are fewer than three noisy pixels in the level2.evt file, extra rows are filled as -1
| Pixel properties | Quadrant properties | ||||||
|---|---|---|---|---|---|---|---|
| Quadrant | DetID | PixID | Counts | Sigma | Mean | Median | Sigma |
| A | 10 | 83 | 21288 | 232.26 | 448 | 440 | 89.8 |
| A | 9 | 143 | 18551 | 201.76 | 448 | 440 | 89.8 |
| A | 13 | 6 | 7876 | 82.84 | 448 | 440 | 89.8 |
| B | 5 | 172 | 976386 | 11802.17 | 432 | 422 | 82.7 |
| B | 4 | 170 | 10042 | 116.33 | 432 | 422 | 82.7 |
| B | 12 | 111 | 9558 | 110.48 | 432 | 422 | 82.7 |
| C | 14 | 67 | 187654 | 1835.88 | 439 | 442 | 102.0 |
| C | 15 | 214 | 160032 | 1565.01 | 439 | 442 | 102.0 |
| C | 0 | 10 | 50160 | 487.56 | 439 | 442 | 102.0 |
| D | 8 | 195 | 691298 | 6442.21 | 438 | 426 | 107.2 |
| D | 13 | 249 | 157060 | 1460.57 | 438 | 426 | 107.2 |
| D | 12 | 6 | 62831 | 581.91 | 438 | 426 | 107.2 |
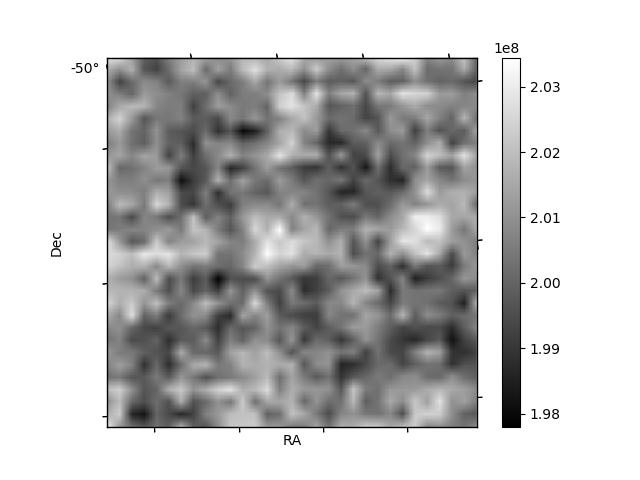
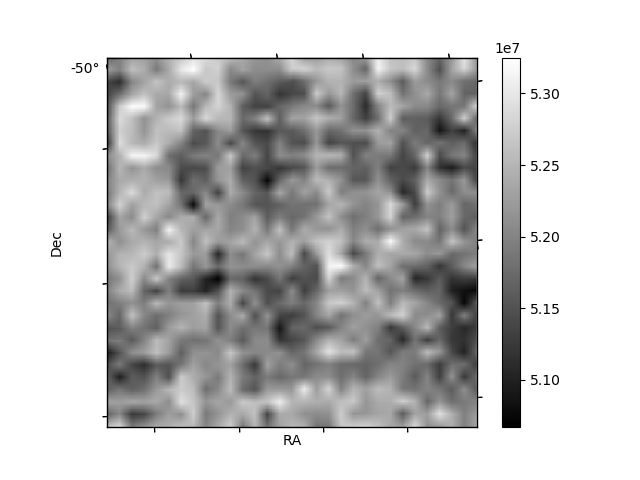
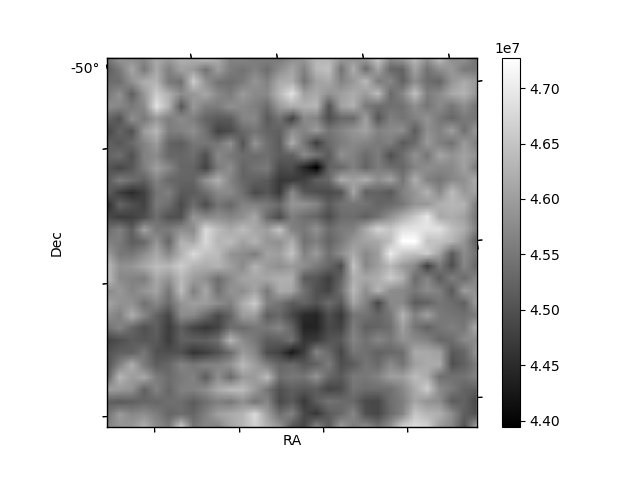
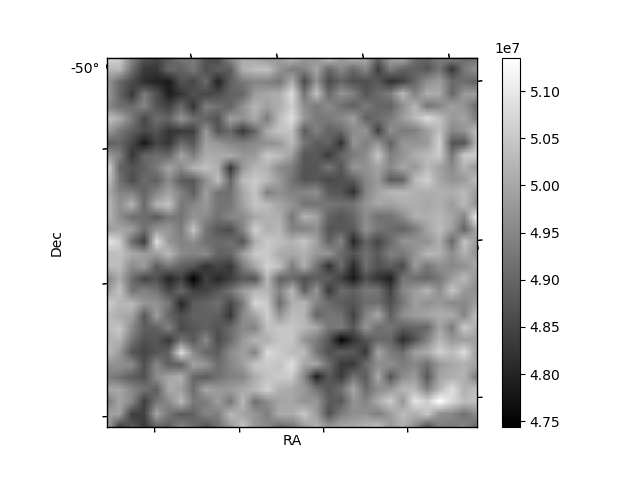
Histogram calculated using DETX and DETY for each event in the final _common_clean file
| Quadrant A | 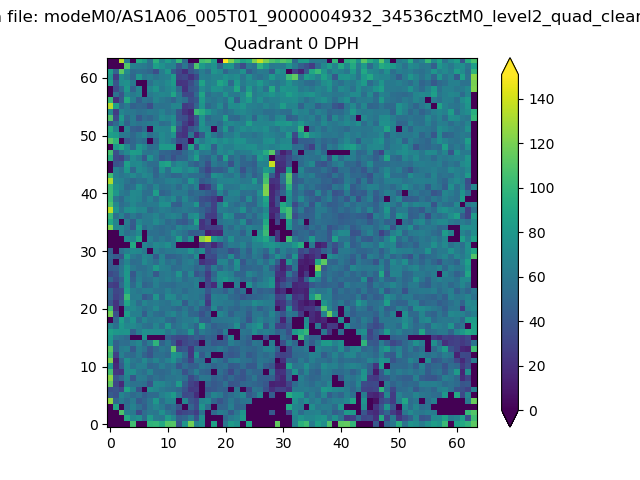 |
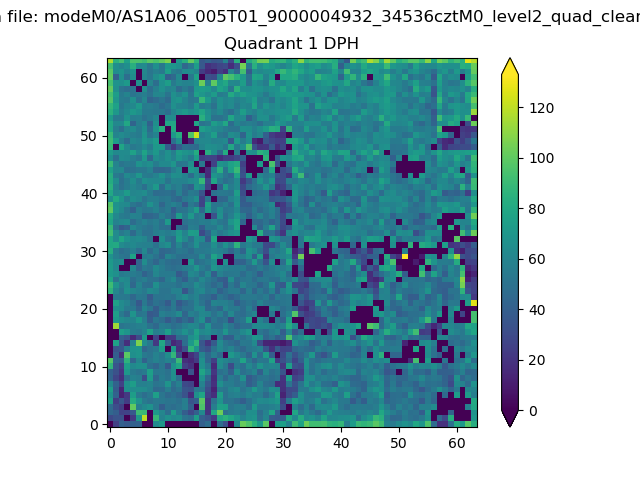 |
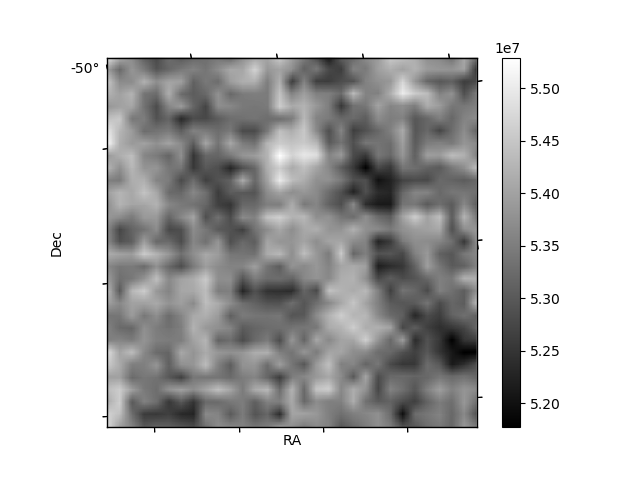
Quadrant B |
|---|---|---|---|
| Quadrant D | 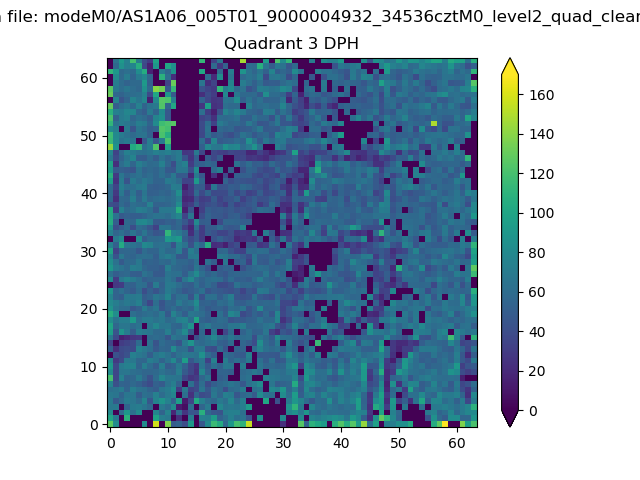 |
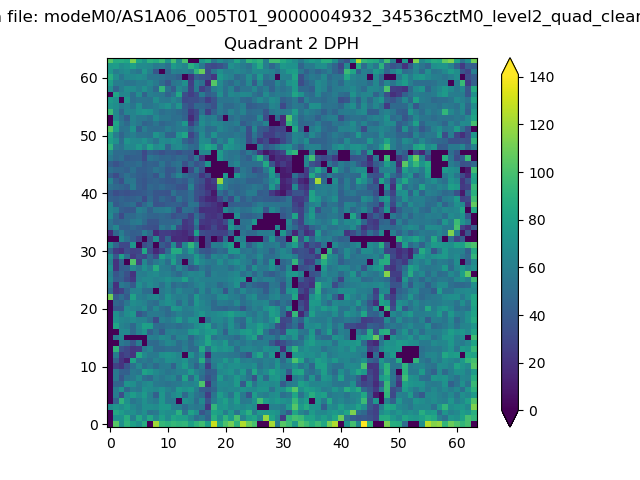 |
Quadrant C |
| Plot type | Count rate plots | Images |
|---|---|---|
| Comparison with Poisson distribution Blue bars denote a histogram of data divided into 1 sec bins. Red curve is a Poisson curve with rate = median count rate of data. |
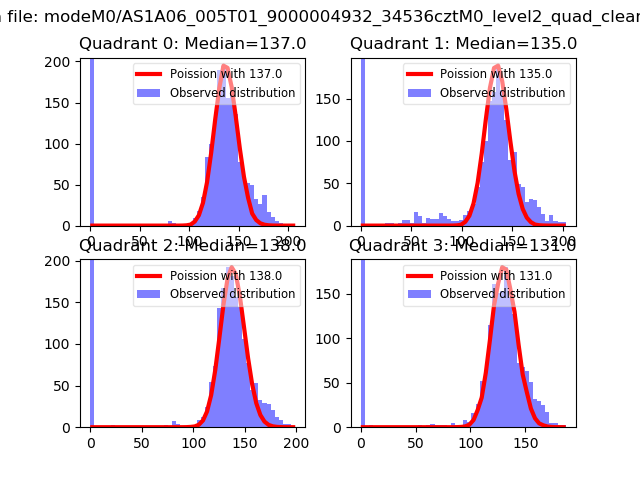 |
 |
| Quadrant-wise count rates Data is divided into 100 sec bins |
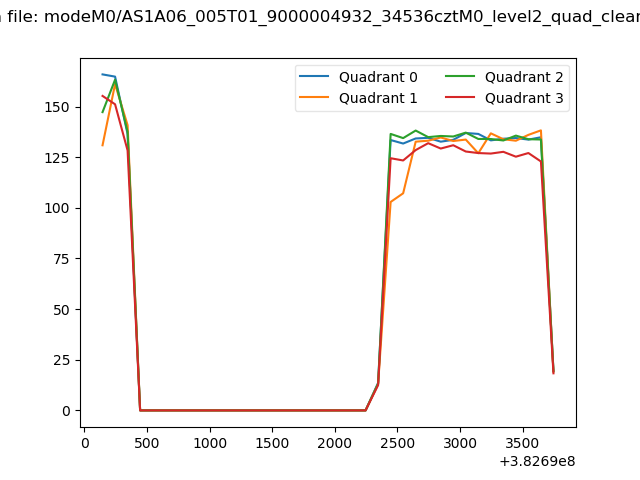 |
|
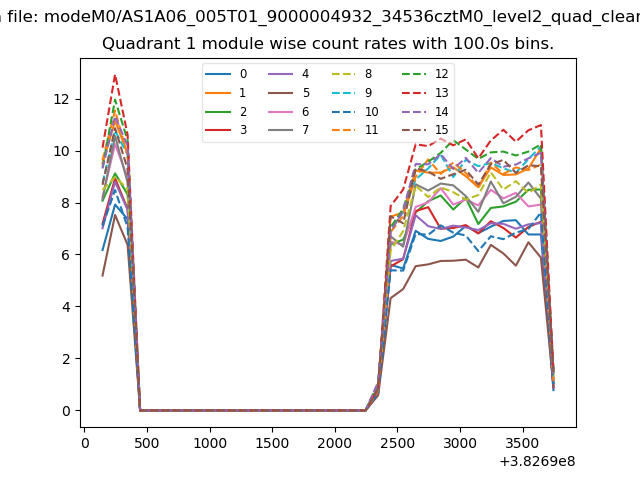
| Module-wise count rates for Quadrant A Data is divided into 100 sec bins |
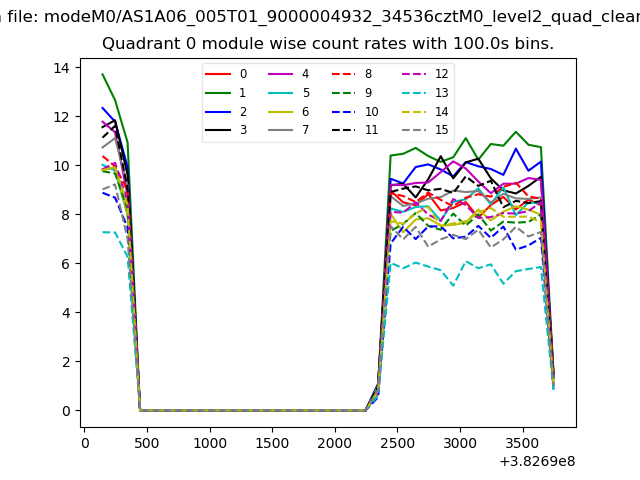 |
 |
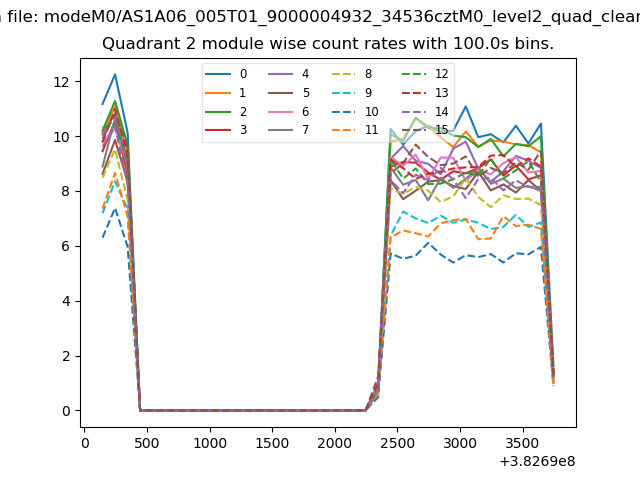
| Module-wise count rates for Quadrant B Data is divided into 100 sec bins |
 |
 |
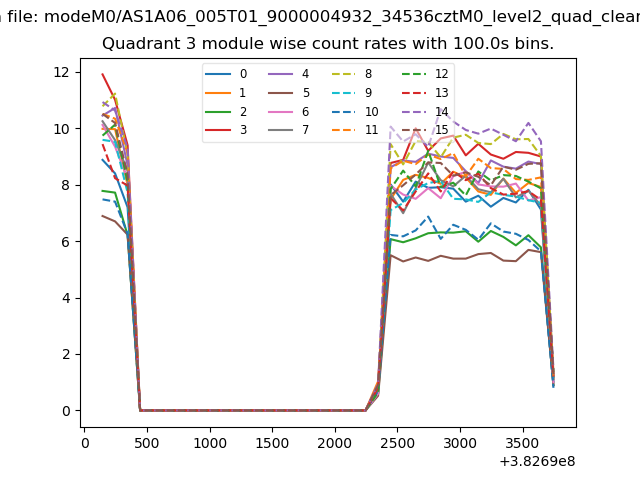
| Module-wise count rates for Quadrant C Data is divided into 100 sec bins |
 |
 |
| Module-wise count rates for Quadrant D Data is divided into 100 sec bins |
 |
 |
| Parameter | Plot |
|---|---|
| CZT HV Monitor | 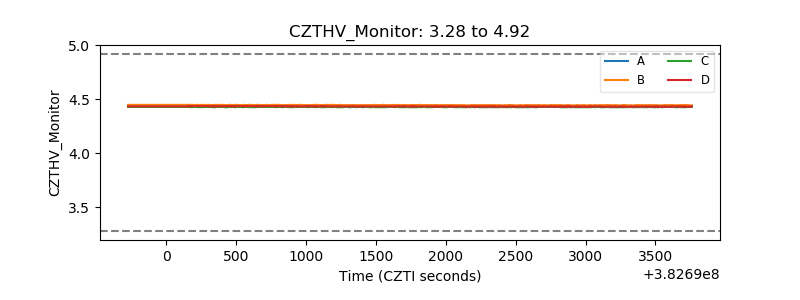 |
| D_VDD | 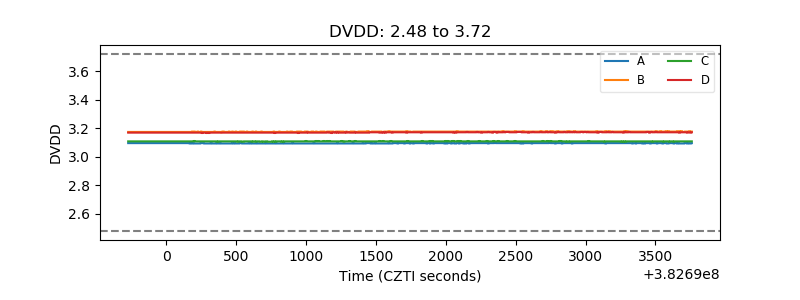 |
| Temperature 1 | 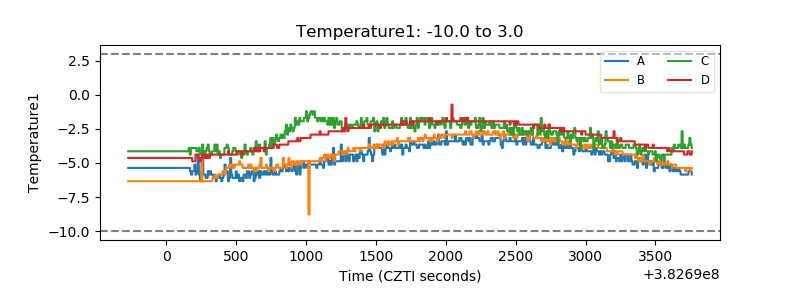 |
| Veto HV Monitor | 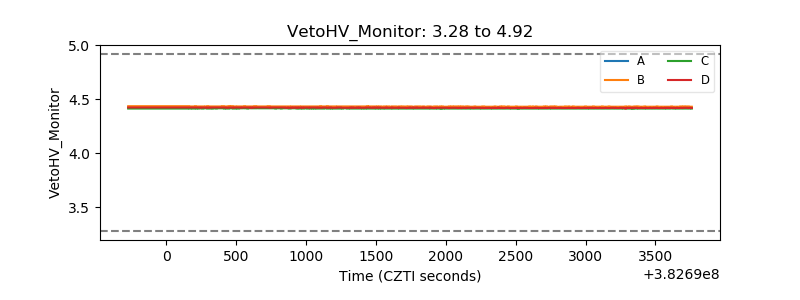 |
| Veto LLD | 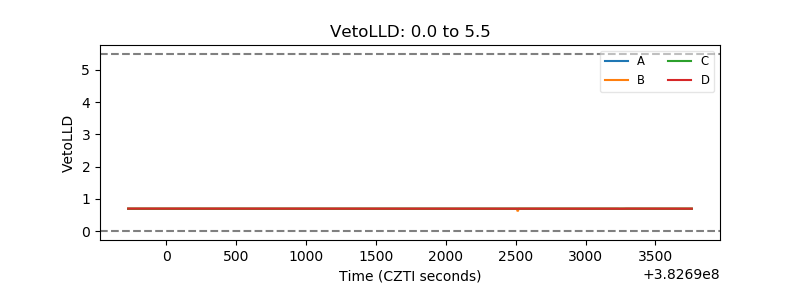 |
| Alpha Counter | 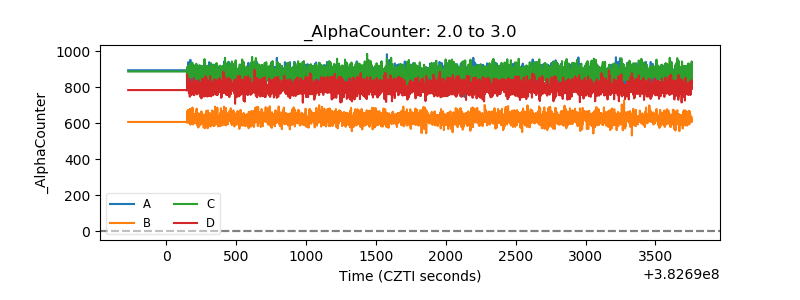 |
| _CPM_Rate | 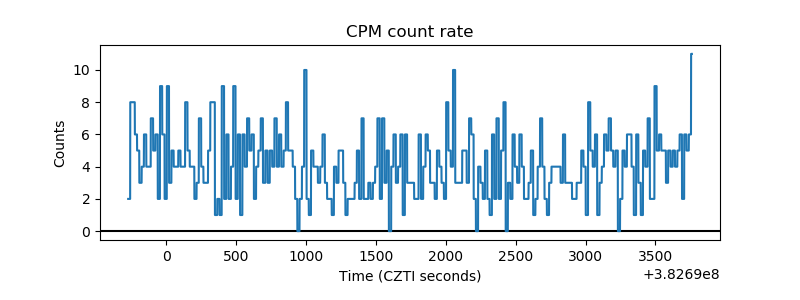 |
| CZT Counter | 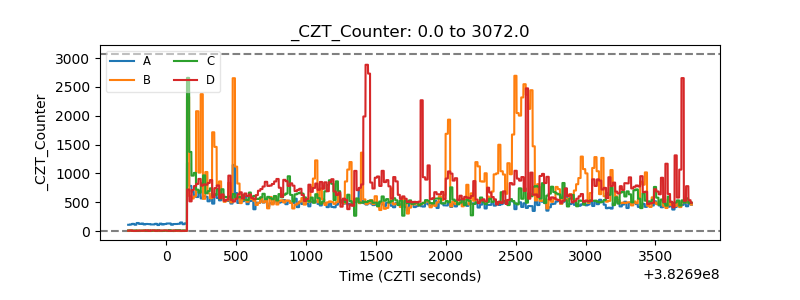 |
| +2.5 Volts monitor | 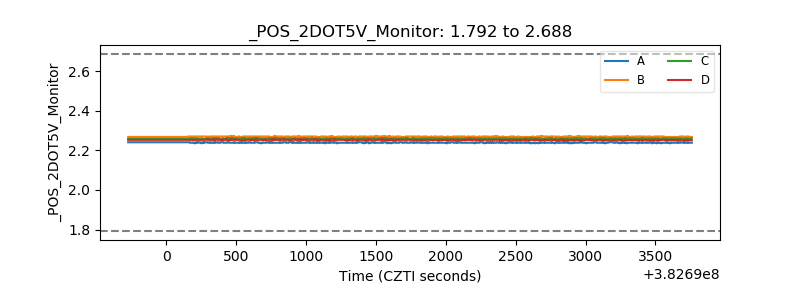 |
| +5 Volts monitor | 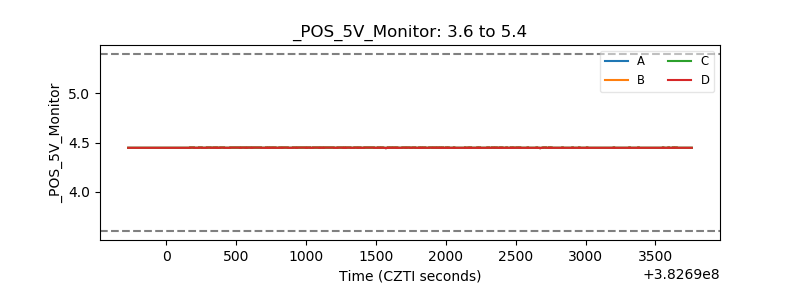 |
| _ROLL_ROT | 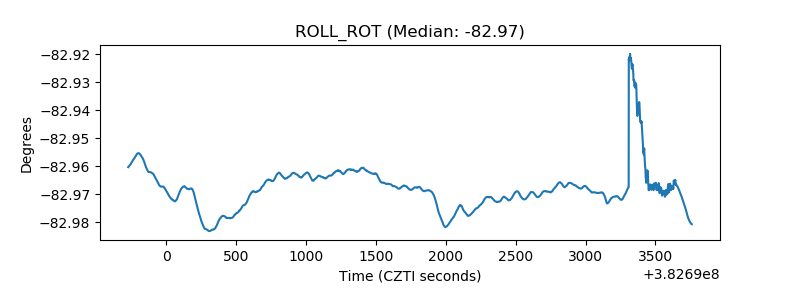 |
| _Roll_DEC | 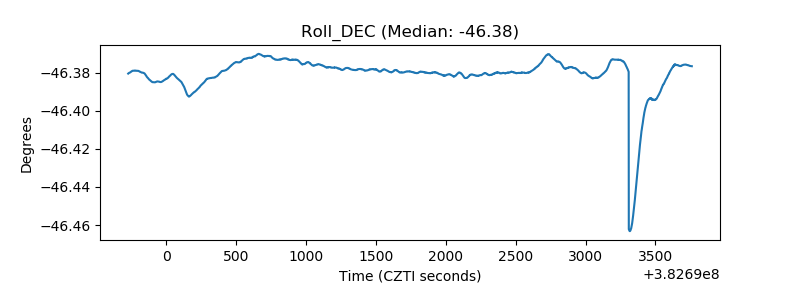 |
| _Roll_RA | 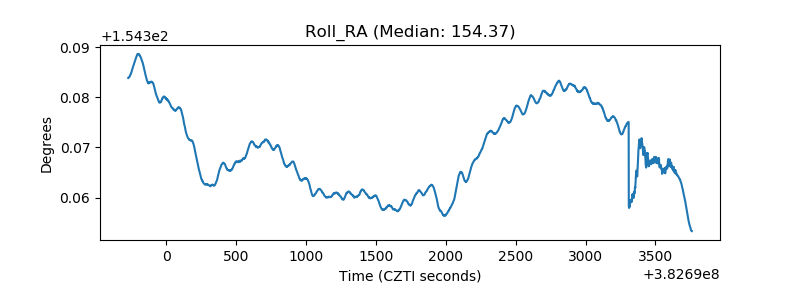 |
| Veto Counter | 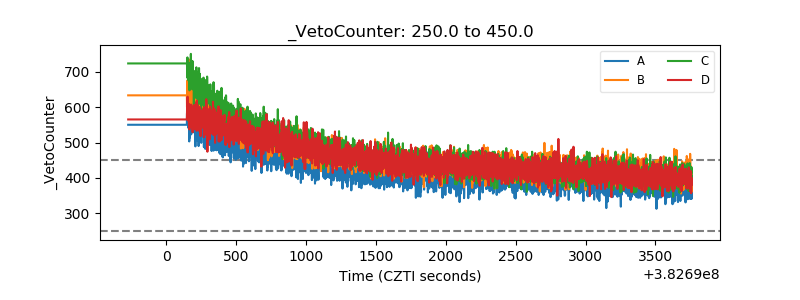 |