| Param | Original file | Final file |
|---|---|---|
| Filename | modeM0/AS1A06_005T01_9000004932_34535cztM0_level2.evt | modeM0/AS1A06_005T01_9000004932_34535cztM0_level2_quad_clean.evt |
| Size (bytes) | 465,327,360 | 61,220,160 |
| Size | 443.8 MB | 58.4 MB |
| Events in quadrant A | 2,623,744 | 378,622 |
| Events in quadrant B | 3,945,221 | 369,647 |
| Events in quadrant C | 3,045,315 | 377,169 |
| Events in quadrant D | 4,113,988 | 352,077 |
| Mode M9 | |||
|---|---|---|---|
| Quadrant | BADHDUFLAG | Total packets | Discarded packets |
| A | 0 | 22 | 0 |
| B | 0 | 22 | 0 |
| C | 0 | 22 | 0 |
| D | 0 | 23 | 0 |
| Mode SS | |||
|---|---|---|---|
| Quadrant | BADHDUFLAG | Total packets | Discarded packets |
| A | 0 | 108 | 0 |
| B | 0 | 108 | 0 |
| C | 0 | 108 | 0 |
| D | 0 | 108 | 0 |
| Mode M0 | |||
|---|---|---|---|
| Quadrant | BADHDUFLAG | Total packets | Discarded packets |
| A | 0 | 11125 | 3 |
| B | 0 | 15128 | 2 |
| C | 0 | 12299 | 2 |
| D | 0 | 15866 | 2 |
| Quadrant | Total seconds | Saturated seconds | Saturation percentage |
|---|---|---|---|
| A | 5374 | 9 | 0.167473% |
| B | 5374 | 390 | 7.257164% |
| C | 5374 | 25 | 0.465203% |
| D | 5374 | 121 | 2.251582% |
Noise dominated data is calculated using 1-second bins in cleaned event files. If a bin has >2000 counts, and if more than 50% of those come from <1% of pixels, then it is considered to be noise-dominated and hence unusable.
| Quadrant | # 1 sec bins | Bins with >0 counts | Bins with >2000 counts | High rate bins dominated by noise | Noise dominated (total time) | Noise dominated (detector-on time) | Marked lightcurve |
|---|---|---|---|---|---|---|---|
| A | 7137 | 5375 | 1 | 1 | 0.01% | 0.02% | 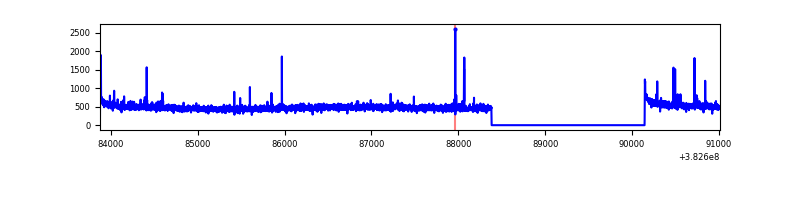 |
| B | 7137 | 5375 | 272 | 272 | 3.81% | 5.06% | 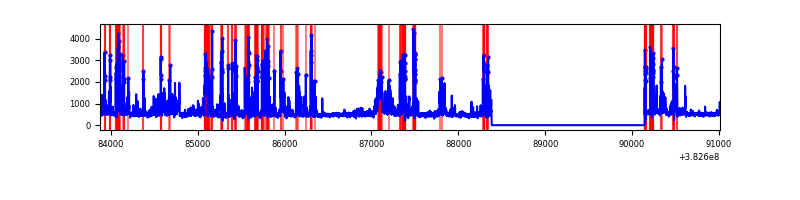 |
| C | 7137 | 5375 | 17 | 17 | 0.24% | 0.32% | 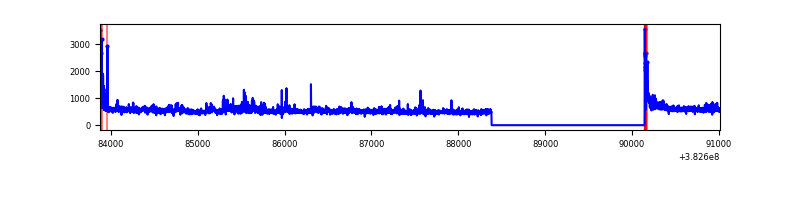 |
| D | 7137 | 5375 | 94 | 94 | 1.32% | 1.75% | 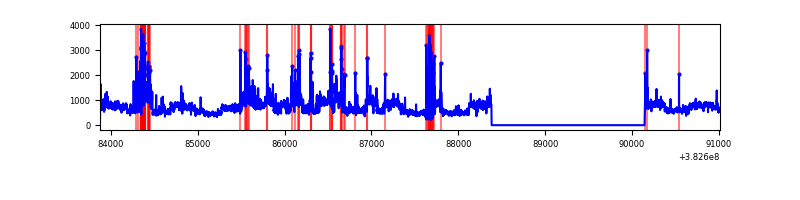 |
Top three noisy pixels from each quadrant. If the there are fewer than three noisy pixels in the level2.evt file, extra rows are filled as -1
| Pixel properties | Quadrant properties | ||||||
|---|---|---|---|---|---|---|---|
| Quadrant | DetID | PixID | Counts | Sigma | Mean | Median | Sigma |
| A | 9 | 143 | 43975 | 334.43 | 650 | 638 | 129.6 |
| A | 10 | 83 | 39388 | 299.03 | 650 | 638 | 129.6 |
| A | 13 | 6 | 17783 | 132.31 | 650 | 638 | 129.6 |
| B | 5 | 172 | 1425646 | 11875.02 | 627 | 612 | 120.0 |
| B | 4 | 171 | 20106 | 162.45 | 627 | 612 | 120.0 |
| B | 5 | 173 | 14961 | 119.57 | 627 | 612 | 120.0 |
| C | 15 | 214 | 242709 | 1639.98 | 639 | 644 | 147.6 |
| C | 14 | 67 | 207087 | 1398.64 | 639 | 644 | 147.6 |
| C | 0 | 10 | 91529 | 615.74 | 639 | 644 | 147.6 |
| D | 8 | 195 | 939521 | 6104.4 | 632 | 615 | 153.8 |
| D | 7 | 80 | 270863 | 1757.05 | 632 | 615 | 153.8 |
| D | 2 | 249 | 110259 | 712.86 | 632 | 615 | 153.8 |
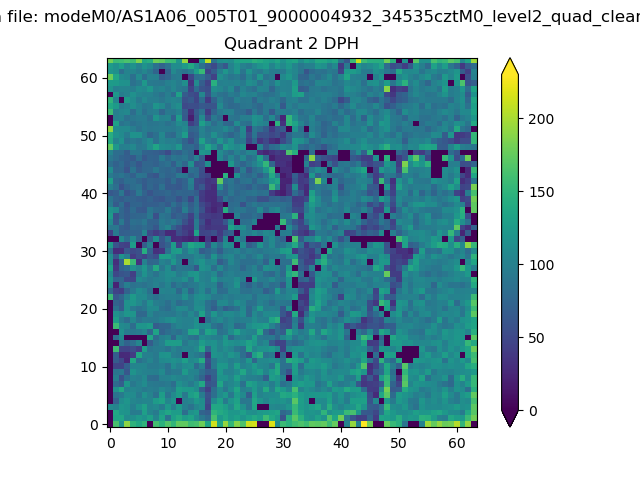
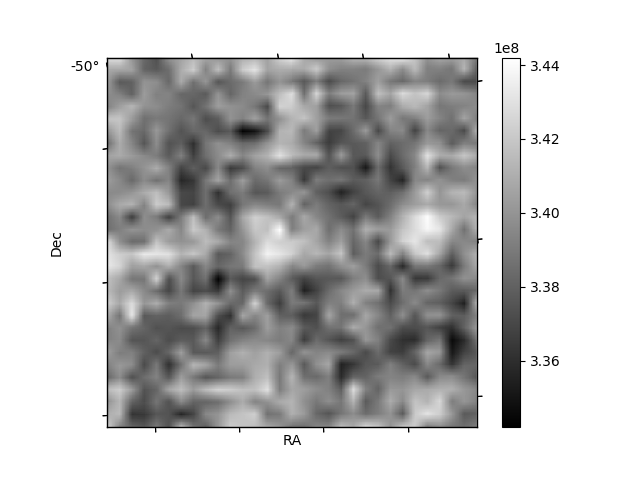
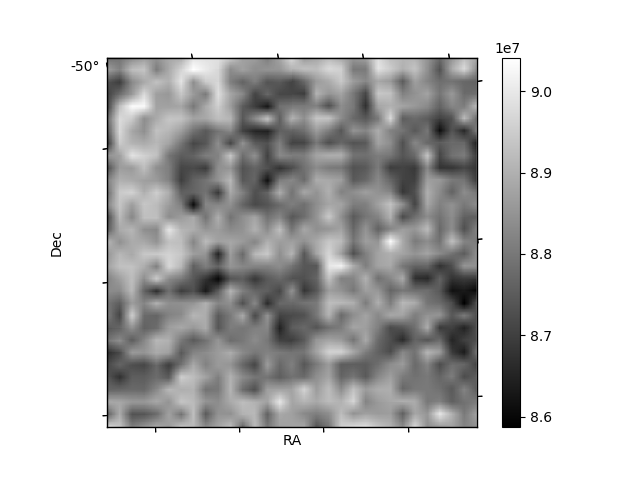
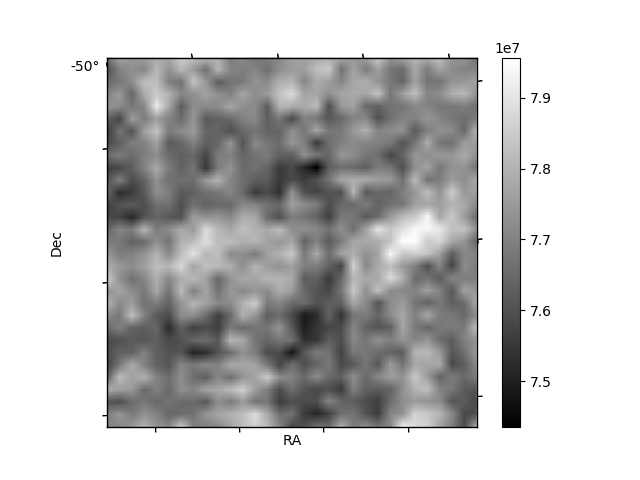
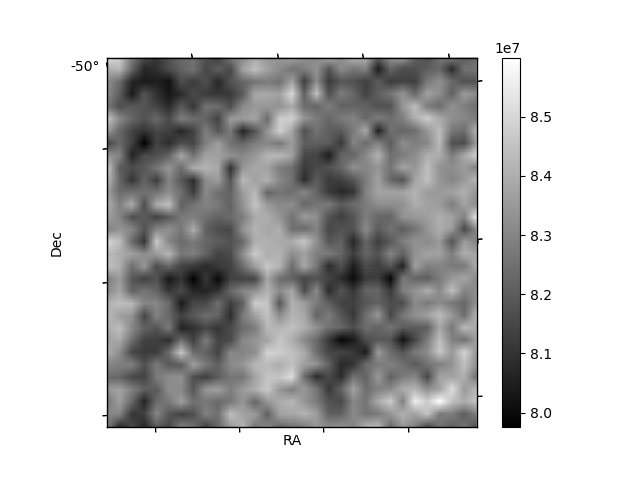
Histogram calculated using DETX and DETY for each event in the final _common_clean file
| Quadrant A | 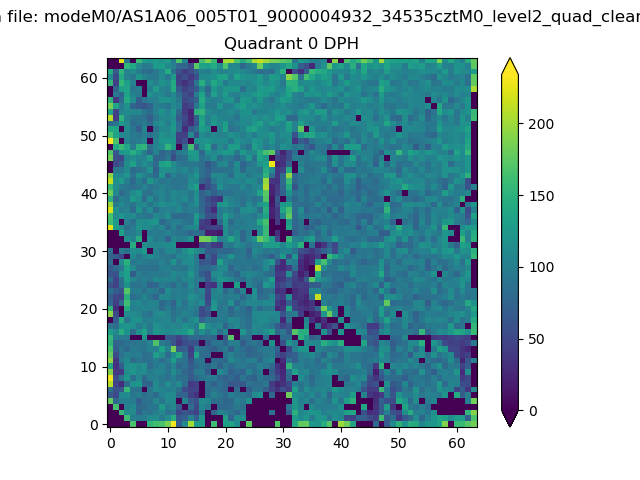 |
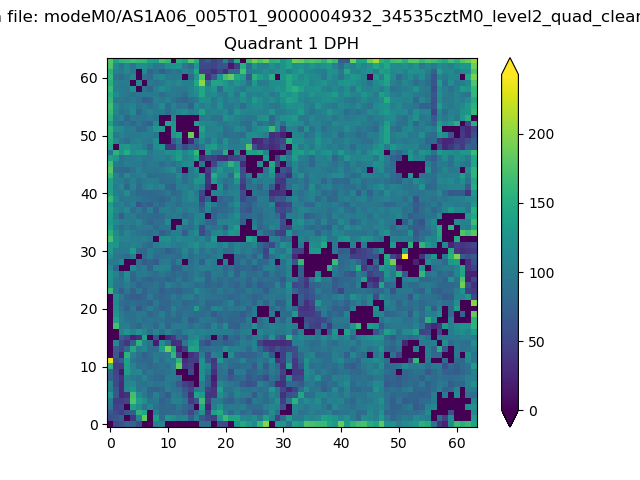 |
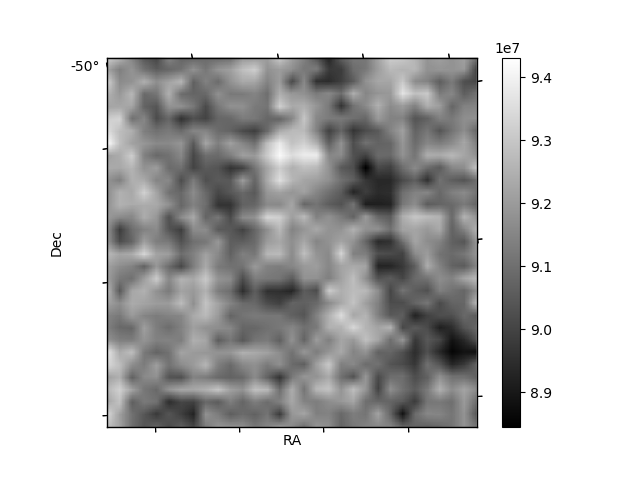
Quadrant B |
|---|---|---|---|
| Quadrant D | 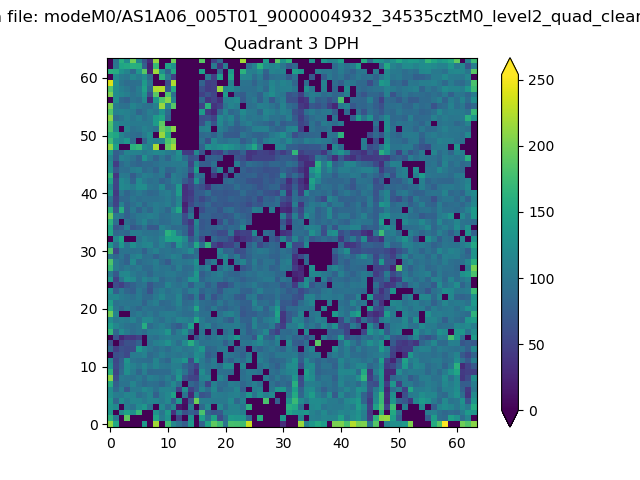 |
 |
Quadrant C |
| Plot type | Count rate plots | Images |
|---|---|---|
| Comparison with Poisson distribution Blue bars denote a histogram of data divided into 1 sec bins. Red curve is a Poisson curve with rate = median count rate of data. |
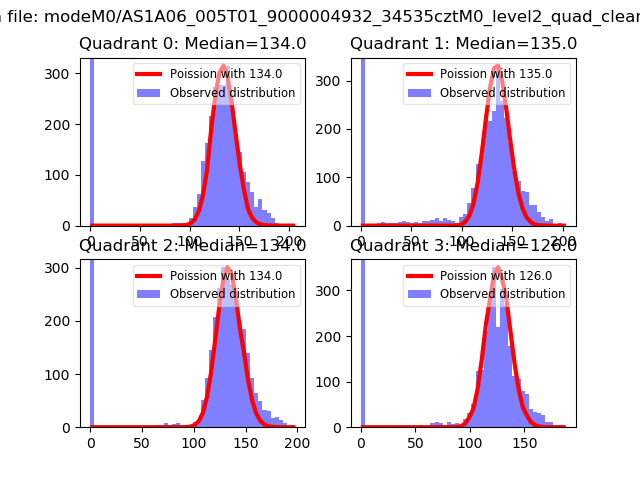 |
 |
| Quadrant-wise count rates Data is divided into 100 sec bins |
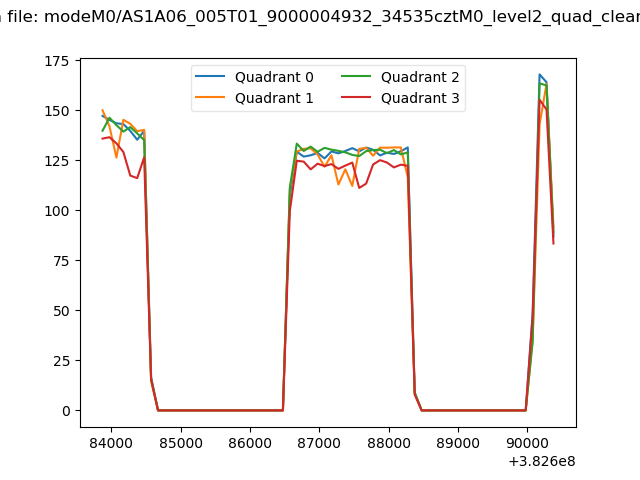 |
|
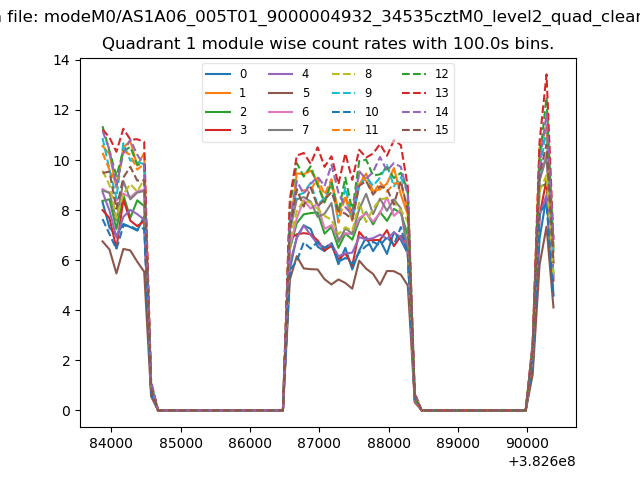
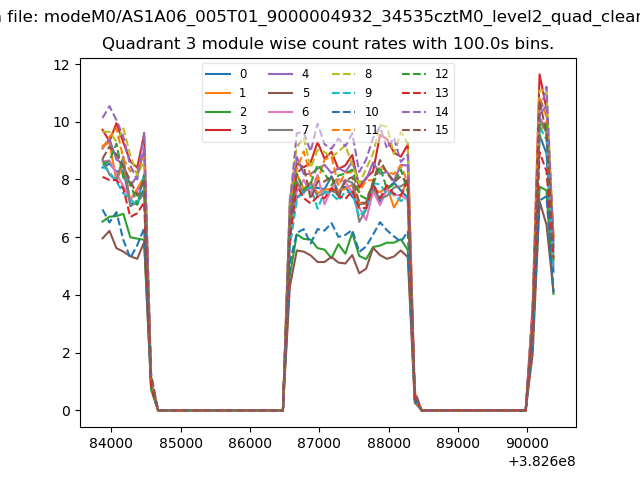
| Module-wise count rates for Quadrant A Data is divided into 100 sec bins |
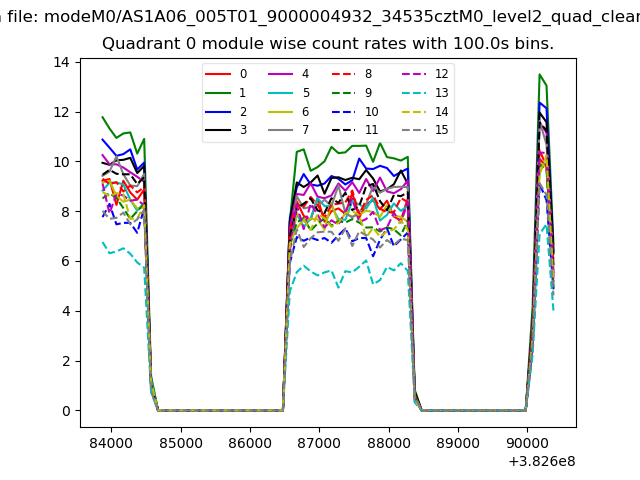 |
 |
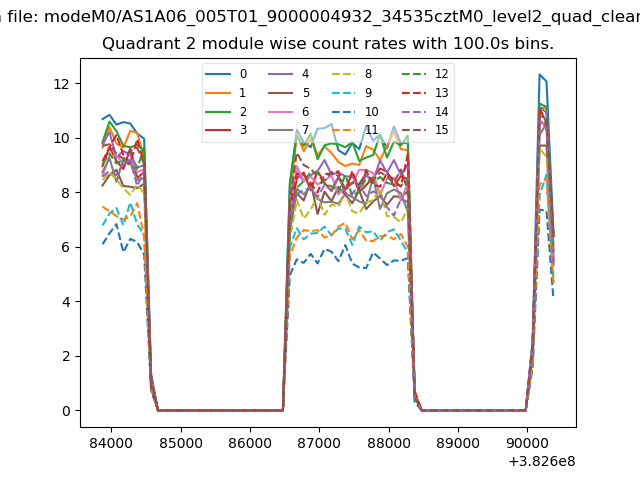
| Module-wise count rates for Quadrant B Data is divided into 100 sec bins |
 |
 |
| Module-wise count rates for Quadrant C Data is divided into 100 sec bins |
 |
 |
| Module-wise count rates for Quadrant D Data is divided into 100 sec bins |
 |
 |
| Parameter | Plot |
|---|---|
| CZT HV Monitor |  |
| D_VDD | 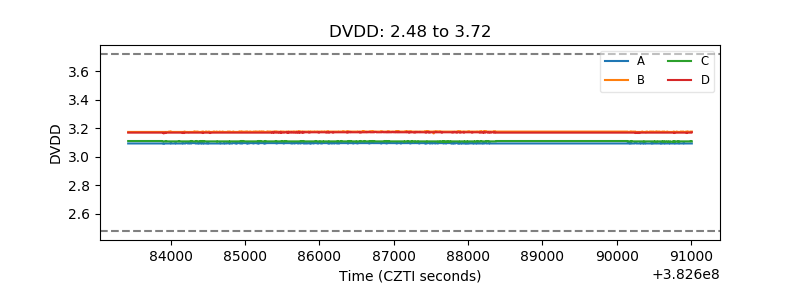 |
| Temperature 1 | 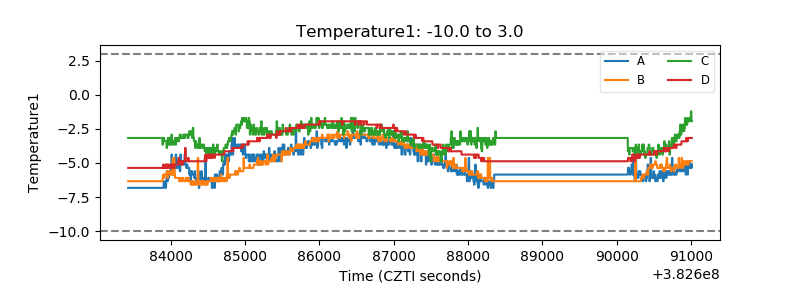 |
| Veto HV Monitor | 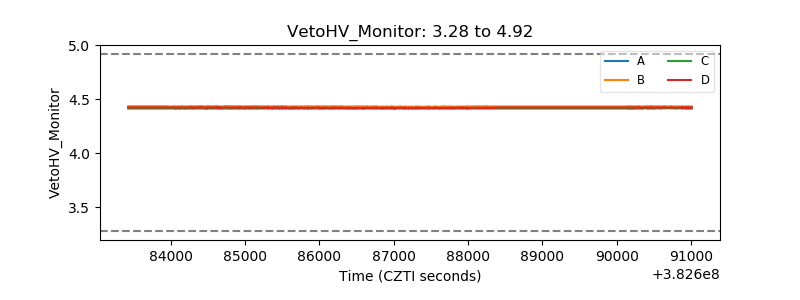 |
| Veto LLD | 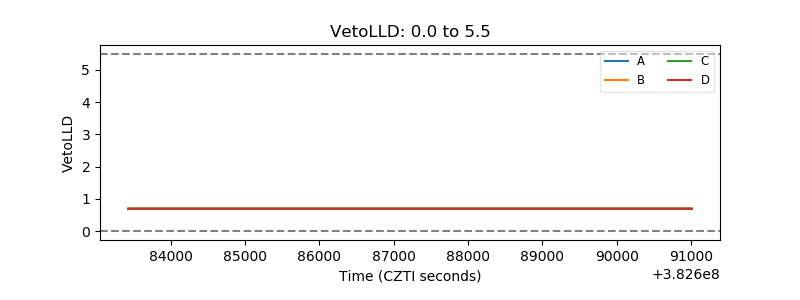 |
| Alpha Counter | 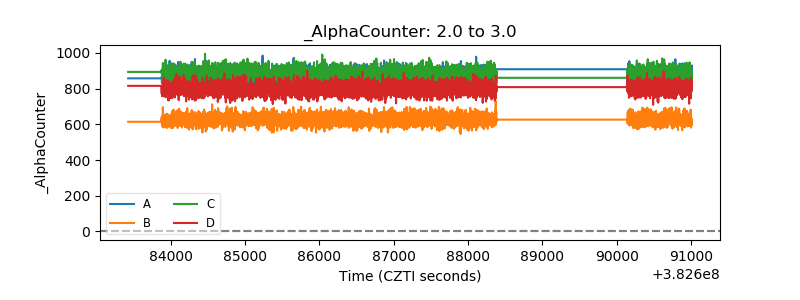 |
| _CPM_Rate | 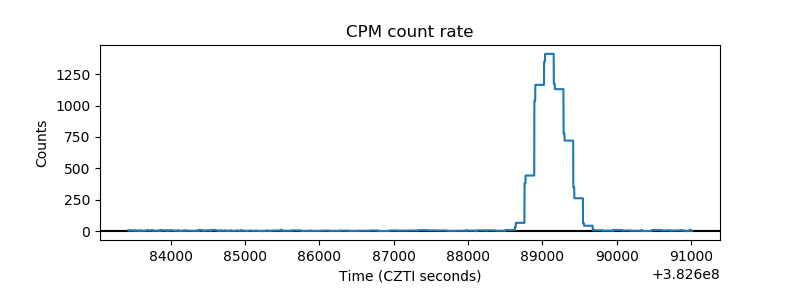 |
| CZT Counter | 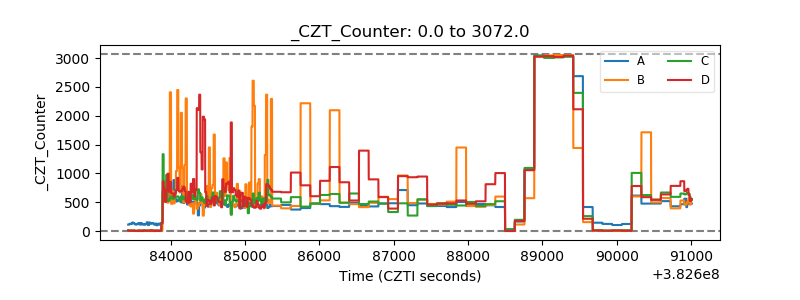 |
| +2.5 Volts monitor | 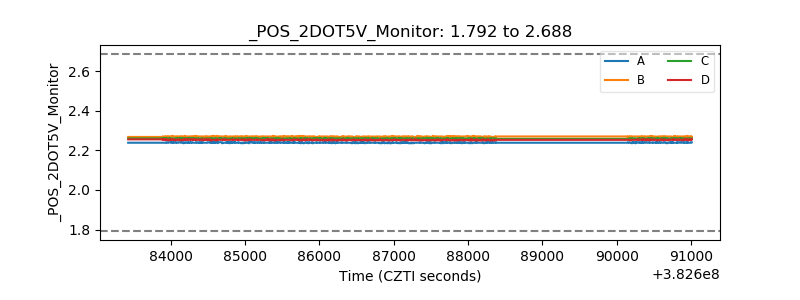 |
| +5 Volts monitor | 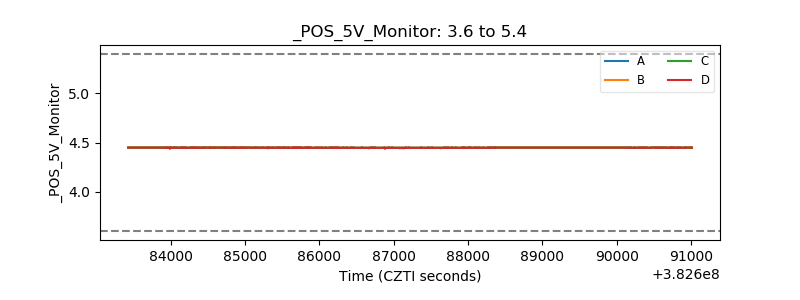 |
| _ROLL_ROT | 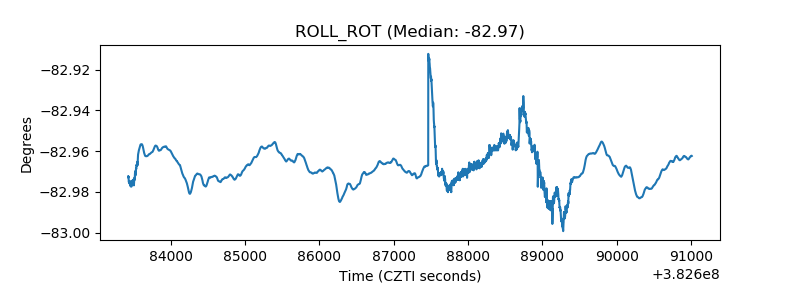 |
| _Roll_DEC | 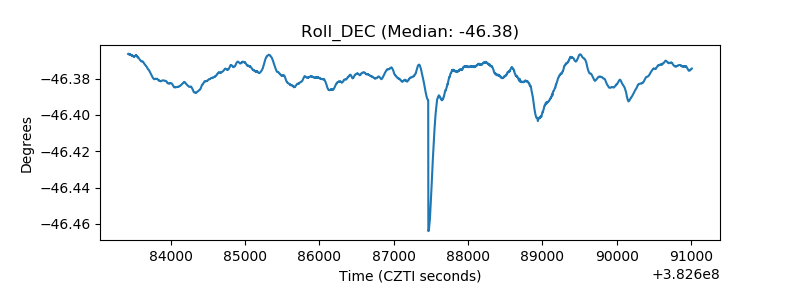 |
| _Roll_RA | 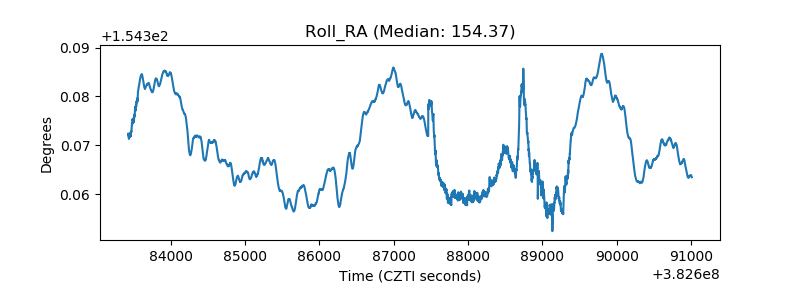 |
| Veto Counter | 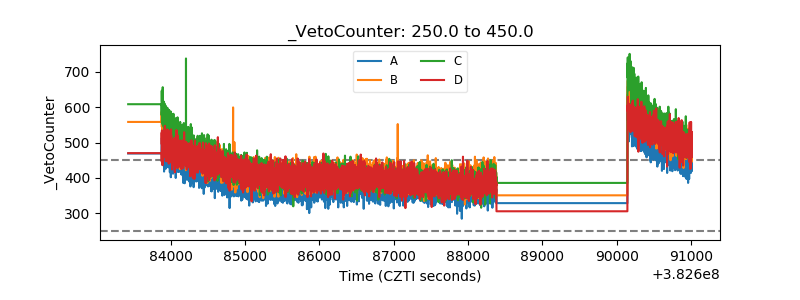 |