| Param | Original file | Final file |
|---|---|---|
| Filename | modeM0/AS1A06_005T01_9000004932_34529cztM0_level2.evt | modeM0/AS1A06_005T01_9000004932_34529cztM0_level2_quad_clean.evt |
| Size (bytes) | 470,712,960 | 75,922,560 |
| Size | 448.9 MB | 72.4 MB |
| Events in quadrant A | 2,726,895 | 485,381 |
| Events in quadrant B | 3,764,800 | 477,510 |
| Events in quadrant C | 3,002,690 | 472,659 |
| Events in quadrant D | 4,358,906 | 449,278 |
| Mode M9 | |||
|---|---|---|---|
| Quadrant | BADHDUFLAG | Total packets | Discarded packets |
| A | 0 | 20 | 0 |
| B | 0 | 20 | 0 |
| C | 0 | 20 | 0 |
| D | 0 | 21 | 0 |
| Mode SS | |||
|---|---|---|---|
| Quadrant | BADHDUFLAG | Total packets | Discarded packets |
| A | 0 | 120 | 0 |
| B | 0 | 120 | 0 |
| C | 0 | 120 | 0 |
| D | 0 | 120 | 0 |
| Mode M0 | |||
|---|---|---|---|
| Quadrant | BADHDUFLAG | Total packets | Discarded packets |
| A | 0 | 12168 | 3 |
| B | 0 | 15095 | 2 |
| C | 0 | 12532 | 2 |
| D | 0 | 17152 | 2 |
| Quadrant | Total seconds | Saturated seconds | Saturation percentage |
|---|---|---|---|
| A | 5930 | 9 | 0.151771% |
| B | 5930 | 274 | 4.620573% |
| C | 5930 | 24 | 0.404722% |
| D | 5930 | 171 | 2.883642% |
Noise dominated data is calculated using 1-second bins in cleaned event files. If a bin has >2000 counts, and if more than 50% of those come from <1% of pixels, then it is considered to be noise-dominated and hence unusable.
| Quadrant | # 1 sec bins | Bins with >0 counts | Bins with >2000 counts | High rate bins dominated by noise | Noise dominated (total time) | Noise dominated (detector-on time) | Marked lightcurve |
|---|---|---|---|---|---|---|---|
| A | 7213 | 5931 | 3 | 3 | 0.04% | 0.05% | 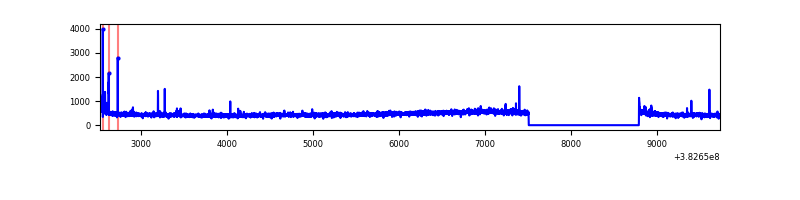 |
| B | 7213 | 5931 | 172 | 172 | 2.38% | 2.90% | 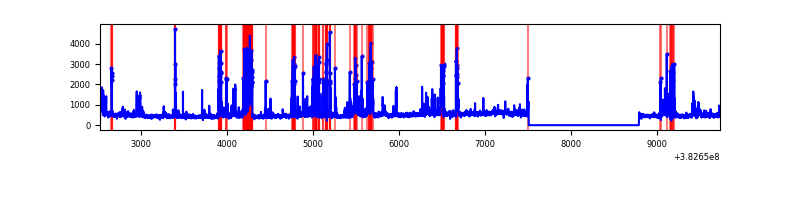 |
| C | 7213 | 5931 | 19 | 19 | 0.26% | 0.32% | 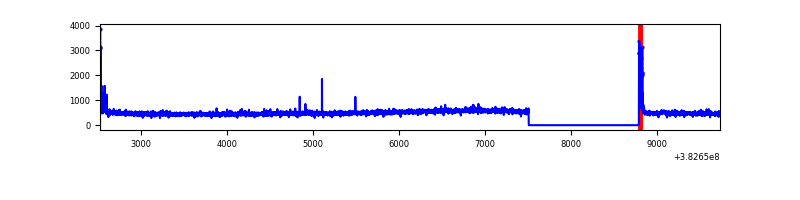 |
| D | 7213 | 5931 | 141 | 141 | 1.95% | 2.38% | 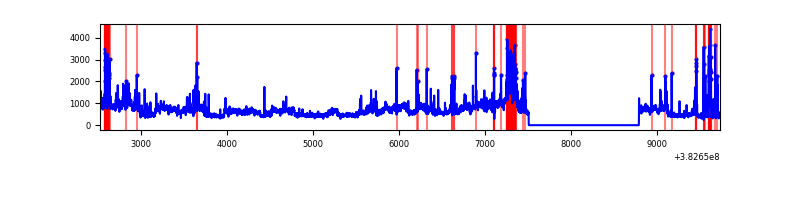 |
Top three noisy pixels from each quadrant. If the there are fewer than three noisy pixels in the level2.evt file, extra rows are filled as -1
| Pixel properties | Quadrant properties | ||||||
|---|---|---|---|---|---|---|---|
| Quadrant | DetID | PixID | Counts | Sigma | Mean | Median | Sigma |
| A | 9 | 143 | 40075 | 286.68 | 682 | 668 | 137.5 |
| A | 10 | 83 | 39676 | 283.78 | 682 | 668 | 137.5 |
| A | 13 | 6 | 10237 | 69.61 | 682 | 668 | 137.5 |
| B | 5 | 172 | 901384 | 6901.64 | 670 | 654 | 130.5 |
| B | 0 | 190 | 62063 | 470.53 | 670 | 654 | 130.5 |
| B | 4 | 232 | 42498 | 320.62 | 670 | 654 | 130.5 |
| C | 15 | 214 | 267359 | 1729.31 | 663 | 669 | 154.2 |
| C | 0 | 10 | 89679 | 577.17 | 663 | 669 | 154.2 |
| C | 14 | 67 | 49454 | 316.34 | 663 | 669 | 154.2 |
| D | 8 | 195 | 1072686 | 6704.26 | 652 | 632 | 159.9 |
| D | 7 | 80 | 504964 | 3153.92 | 652 | 632 | 159.9 |
| D | 12 | 17 | 88811 | 551.44 | 652 | 632 | 159.9 |
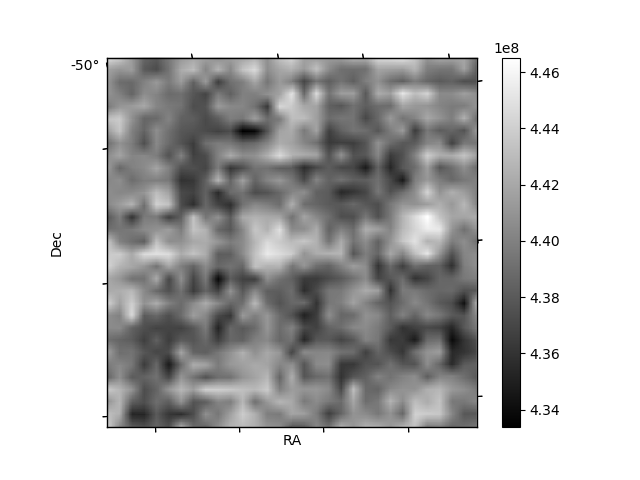
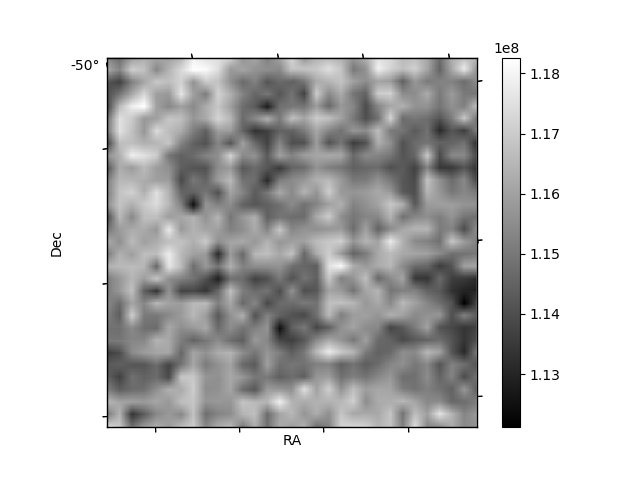
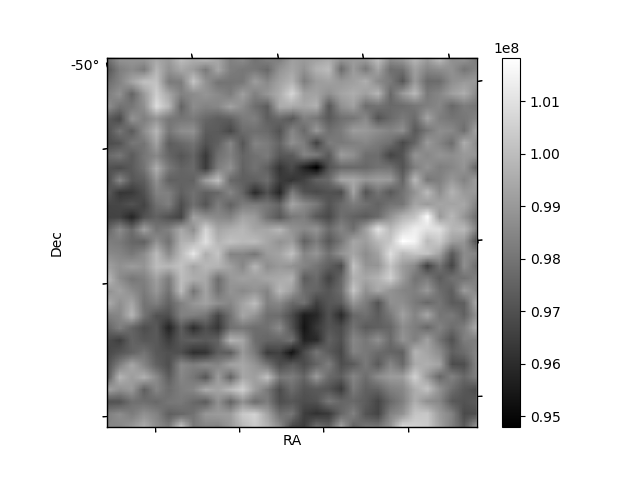
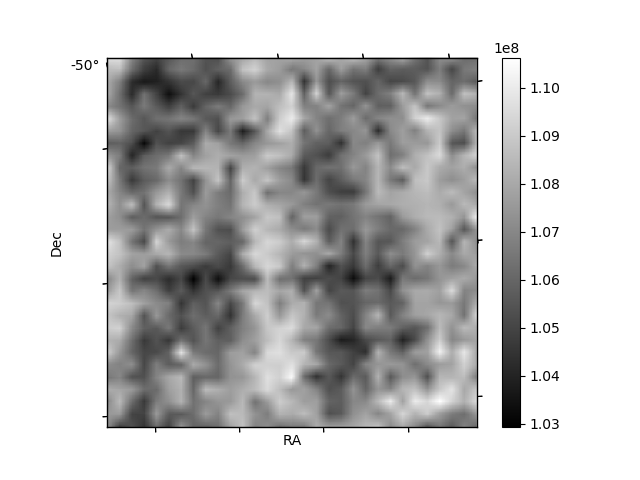
Histogram calculated using DETX and DETY for each event in the final _common_clean file
| Quadrant A | 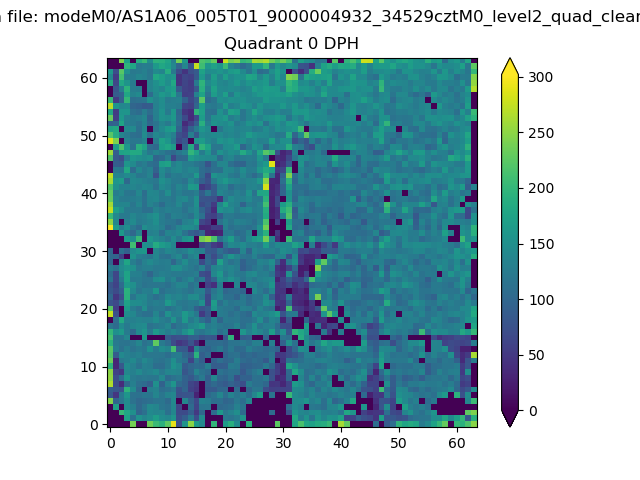 |
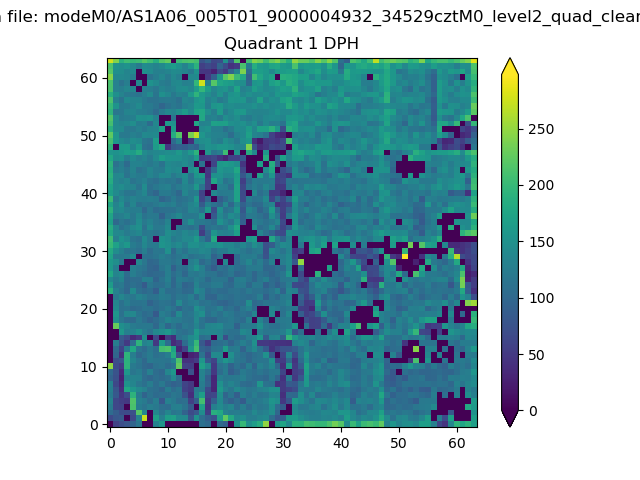 |
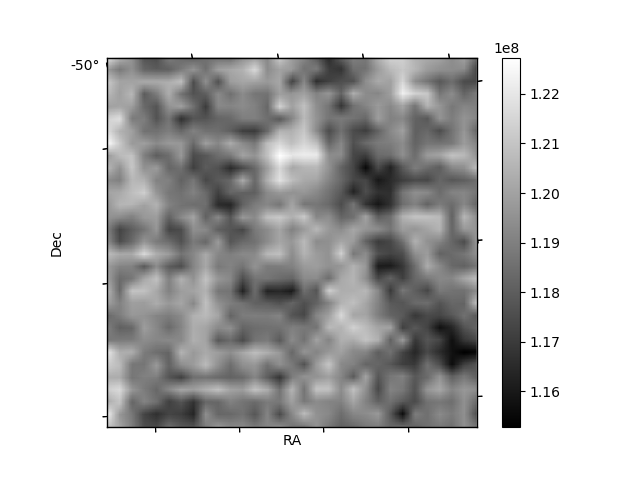
Quadrant B |
|---|---|---|---|
| Quadrant D | 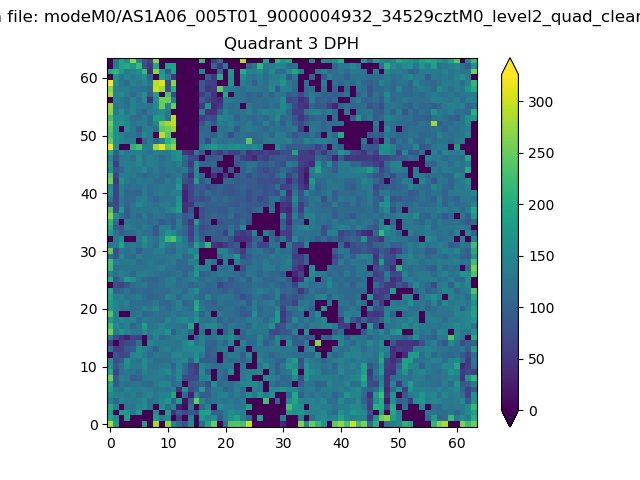 |
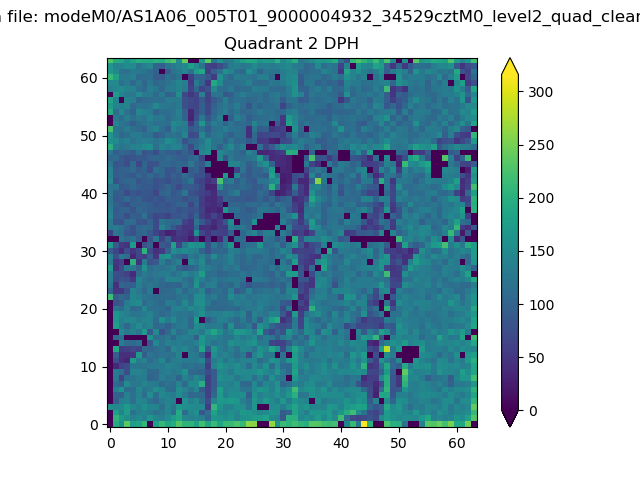 |
Quadrant C |
| Plot type | Count rate plots | Images |
|---|---|---|
| Comparison with Poisson distribution Blue bars denote a histogram of data divided into 1 sec bins. Red curve is a Poisson curve with rate = median count rate of data. |
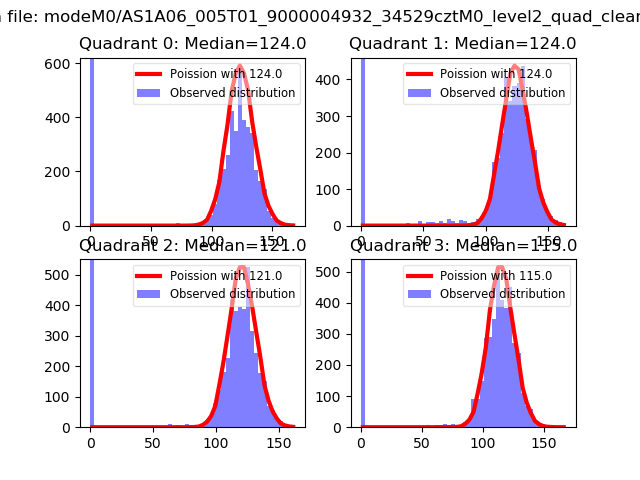 |
 |
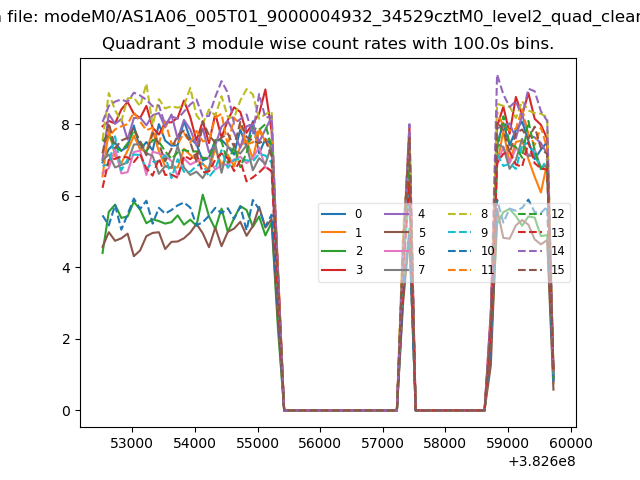
| Quadrant-wise count rates Data is divided into 100 sec bins |
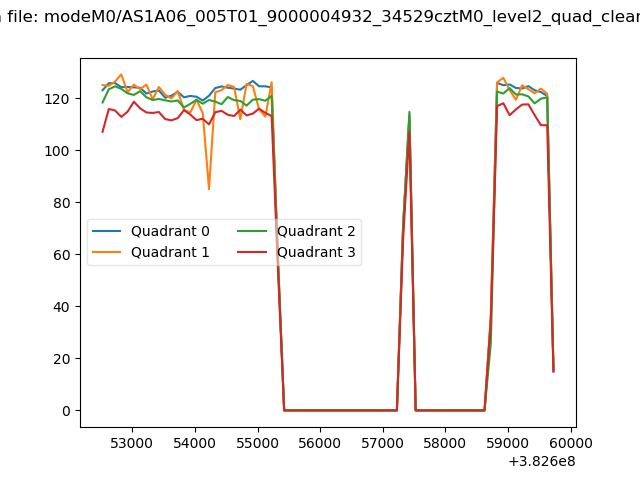 |
|
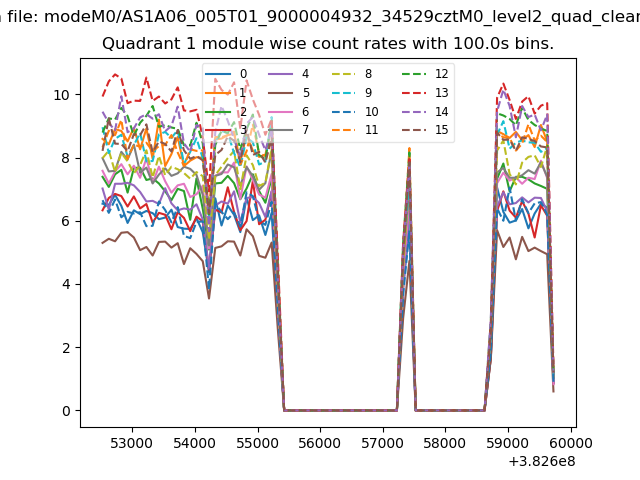
| Module-wise count rates for Quadrant A Data is divided into 100 sec bins |
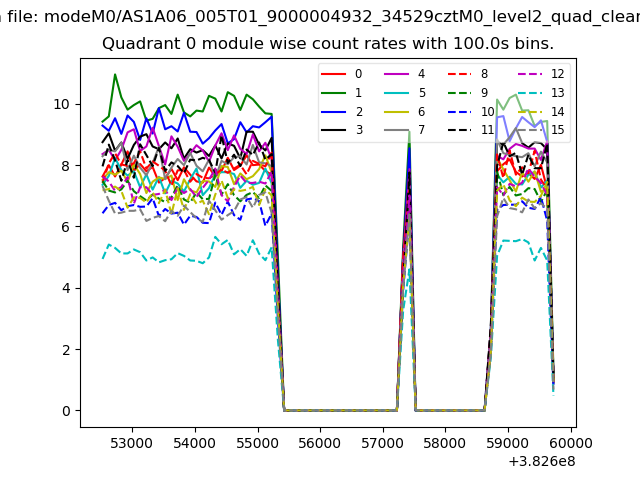 |
 |
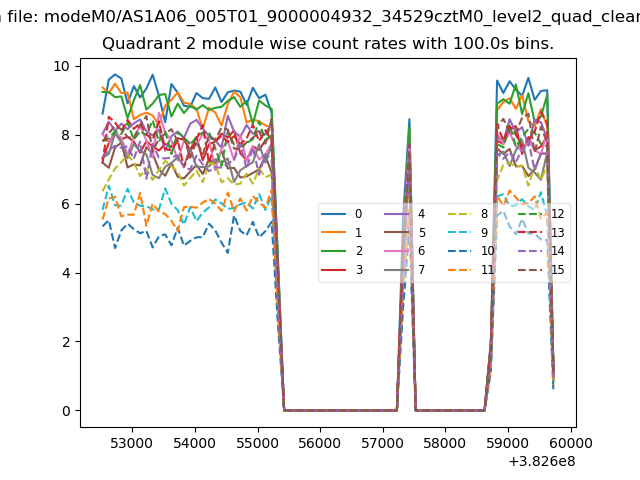
| Module-wise count rates for Quadrant B Data is divided into 100 sec bins |
 |
 |
| Module-wise count rates for Quadrant C Data is divided into 100 sec bins |
 |
 |
| Module-wise count rates for Quadrant D Data is divided into 100 sec bins |
 |
 |
| Parameter | Plot |
|---|---|
| CZT HV Monitor | 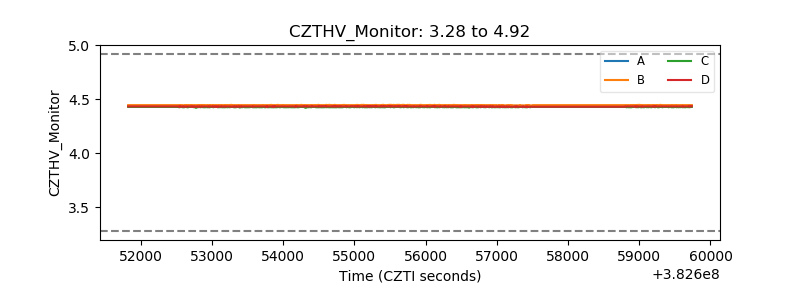 |
| D_VDD | 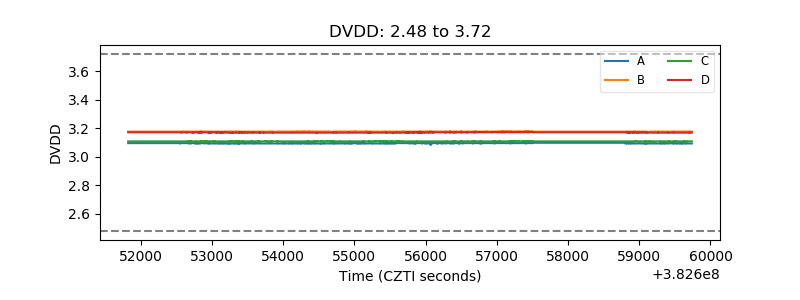 |
| Temperature 1 | 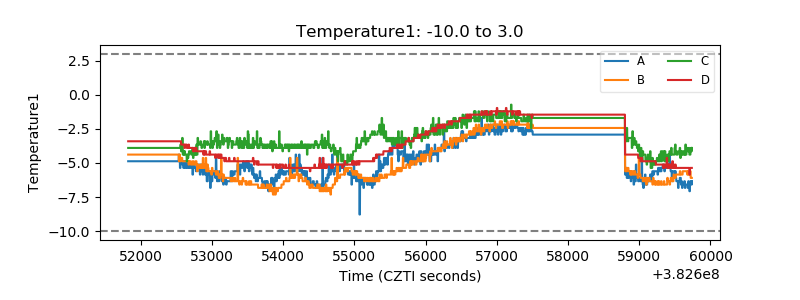 |
| Veto HV Monitor | 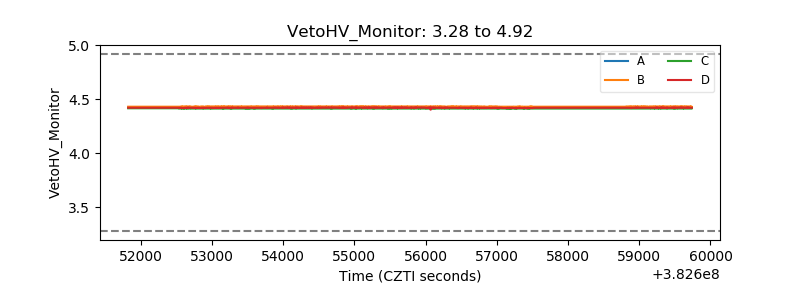 |
| Veto LLD | 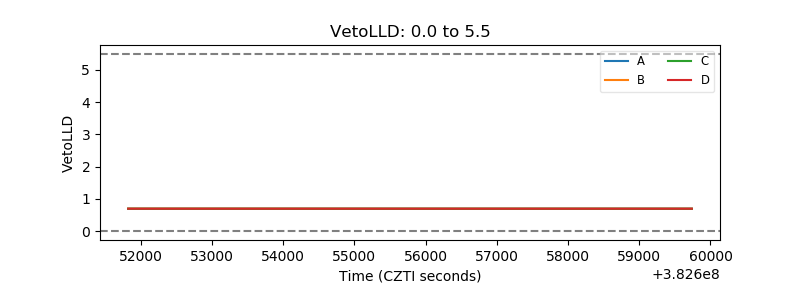 |
| Alpha Counter | 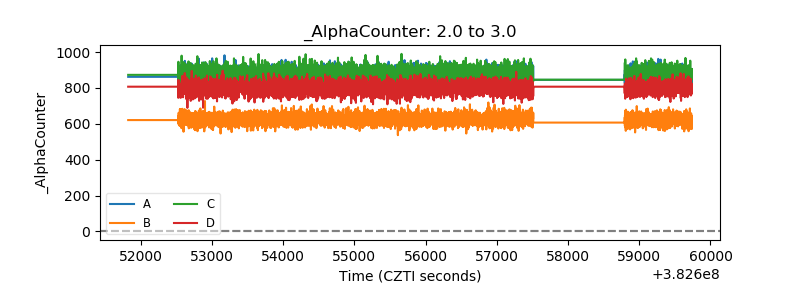 |
| _CPM_Rate | 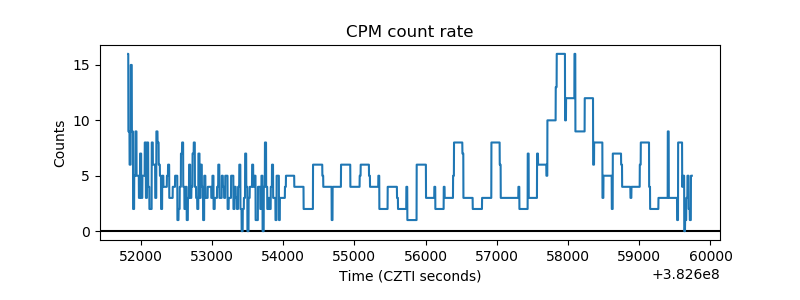 |
| CZT Counter | 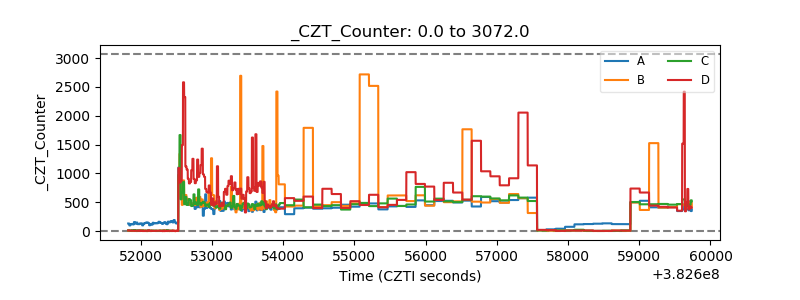 |
| +2.5 Volts monitor | 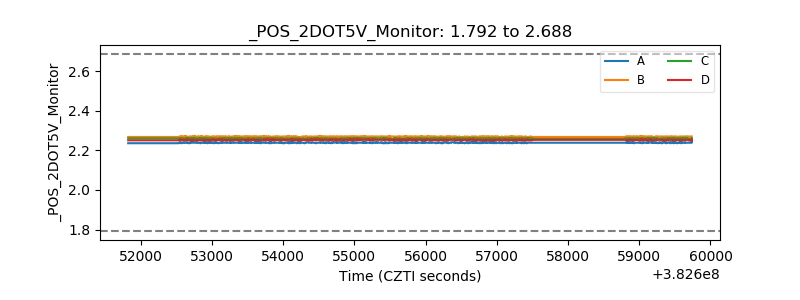 |
| +5 Volts monitor | 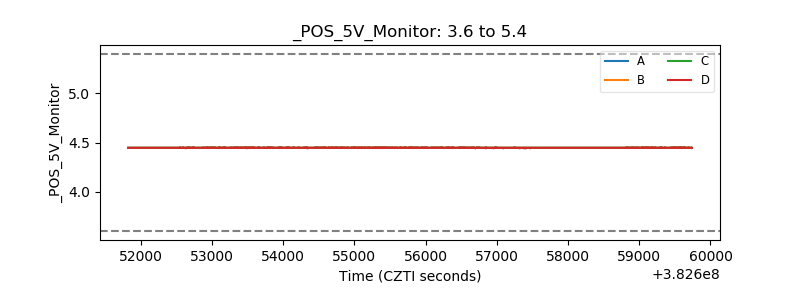 |
| _ROLL_ROT | 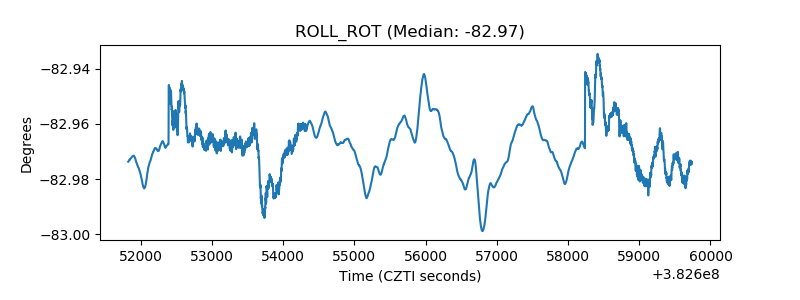 |
| _Roll_DEC | 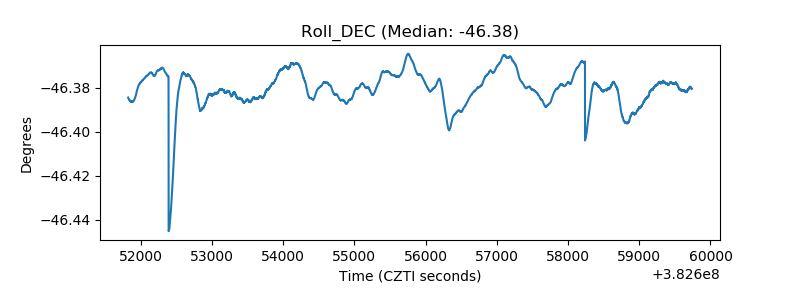 |
| _Roll_RA | 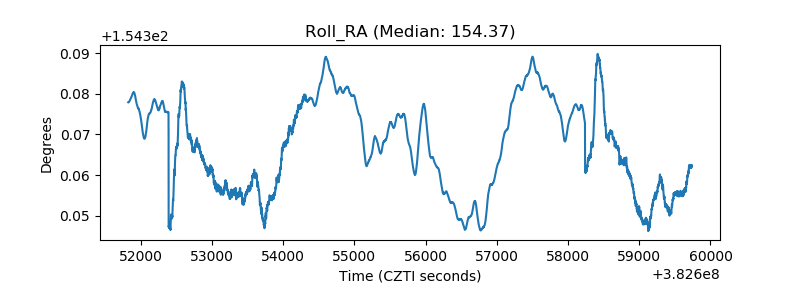 |
| Veto Counter | 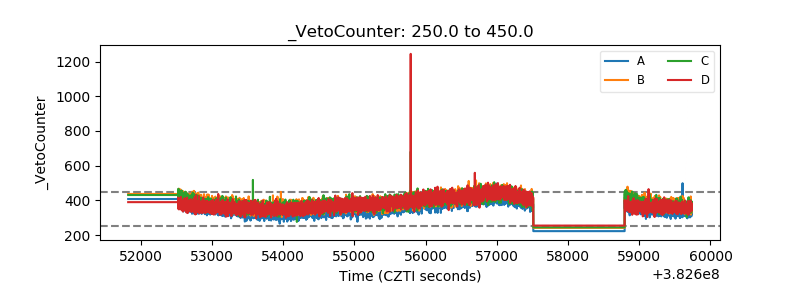 |