| Param | Original file | Final file |
|---|---|---|
| Filename | modeM0/AS1A06_005T01_9000004932_34528cztM0_level2.evt | modeM0/AS1A06_005T01_9000004932_34528cztM0_level2_quad_clean.evt |
| Size (bytes) | 527,279,040 | 82,831,680 |
| Size | 502.9 MB | 79.0 MB |
| Events in quadrant A | 2,766,143 | 546,501 |
| Events in quadrant B | 3,835,445 | 539,083 |
| Events in quadrant C | 3,091,578 | 531,451 |
| Events in quadrant D | 5,867,786 | 471,174 |
| Mode M9 | |||
|---|---|---|---|
| Quadrant | BADHDUFLAG | Total packets | Discarded packets |
| A | 0 | 25 | 0 |
| B | 0 | 25 | 0 |
| C | 0 | 25 | 0 |
| D | 0 | 26 | 0 |
| Mode SS | |||
|---|---|---|---|
| Quadrant | BADHDUFLAG | Total packets | Discarded packets |
| A | 0 | 122 | 0 |
| B | 0 | 122 | 0 |
| C | 0 | 122 | 0 |
| D | 0 | 122 | 0 |
| Mode M0 | |||
|---|---|---|---|
| Quadrant | BADHDUFLAG | Total packets | Discarded packets |
| A | 0 | 12346 | 3 |
| B | 0 | 15391 | 2 |
| C | 0 | 13048 | 2 |
| D | 0 | 21654 | 2 |
| Quadrant | Total seconds | Saturated seconds | Saturation percentage |
|---|---|---|---|
| A | 6012 | 15 | 0.249501% |
| B | 6012 | 278 | 4.624085% |
| C | 6012 | 31 | 0.515635% |
| D | 6012 | 823 | 13.689288% |
Noise dominated data is calculated using 1-second bins in cleaned event files. If a bin has >2000 counts, and if more than 50% of those come from <1% of pixels, then it is considered to be noise-dominated and hence unusable.
| Quadrant | # 1 sec bins | Bins with >0 counts | Bins with >2000 counts | High rate bins dominated by noise | Noise dominated (total time) | Noise dominated (detector-on time) | Marked lightcurve |
|---|---|---|---|---|---|---|---|
| A | 7385 | 6013 | 4 | 4 | 0.05% | 0.07% | 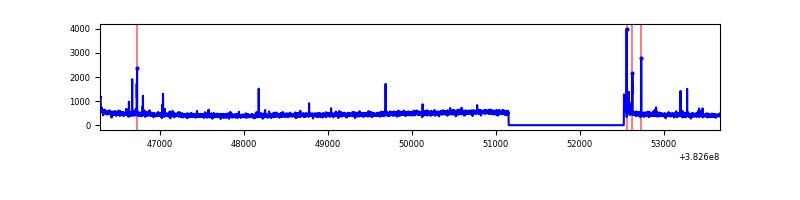 |
| B | 7385 | 6013 | 187 | 187 | 2.53% | 3.11% | 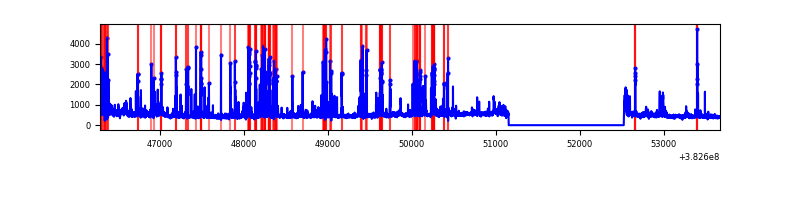 |
| C | 7385 | 6013 | 18 | 18 | 0.24% | 0.30% | 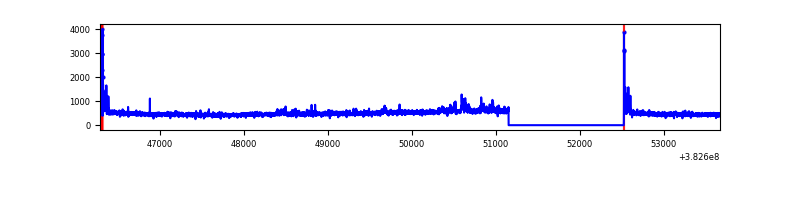 |
| D | 7385 | 6013 | 674 | 674 | 9.13% | 11.21% | 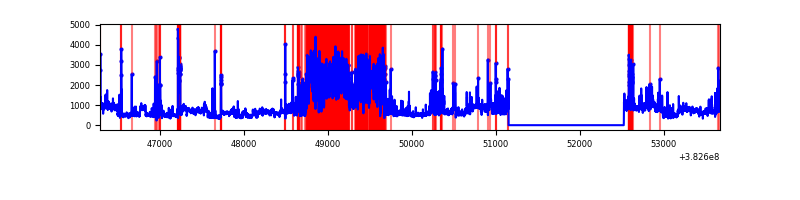 |
Top three noisy pixels from each quadrant. If the there are fewer than three noisy pixels in the level2.evt file, extra rows are filled as -1
| Pixel properties | Quadrant properties | ||||||
|---|---|---|---|---|---|---|---|
| Quadrant | DetID | PixID | Counts | Sigma | Mean | Median | Sigma |
| A | 9 | 143 | 56234 | 398.25 | 688 | 674 | 139.5 |
| A | 10 | 83 | 40397 | 284.73 | 688 | 674 | 139.5 |
| A | 13 | 6 | 12384 | 83.94 | 688 | 674 | 139.5 |
| B | 5 | 172 | 851957 | 6547.33 | 675 | 657 | 130.0 |
| B | 4 | 171 | 163605 | 1253.23 | 675 | 657 | 130.0 |
| B | 0 | 190 | 69957 | 532.98 | 675 | 657 | 130.0 |
| C | 15 | 214 | 269621 | 1736.45 | 666 | 672 | 154.9 |
| C | 0 | 10 | 112173 | 719.9 | 666 | 672 | 154.9 |
| C | 14 | 67 | 98743 | 633.19 | 666 | 672 | 154.9 |
| D | 10 | 118 | 1790716 | 11528.94 | 628 | 612 | 155.3 |
| D | 8 | 195 | 985137 | 6340.71 | 628 | 612 | 155.3 |
| D | 7 | 80 | 253577 | 1629.19 | 628 | 612 | 155.3 |
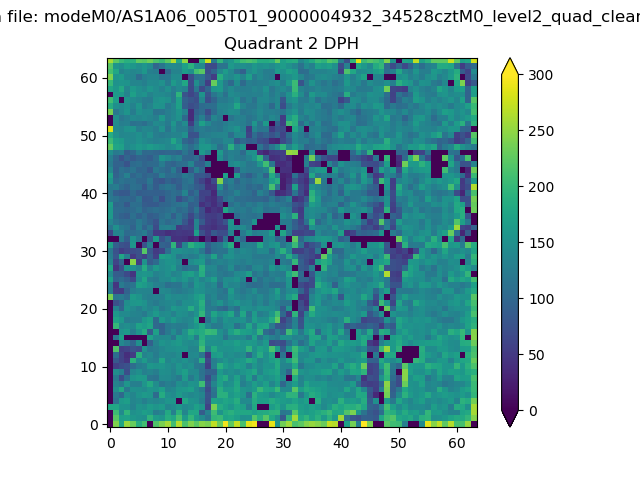
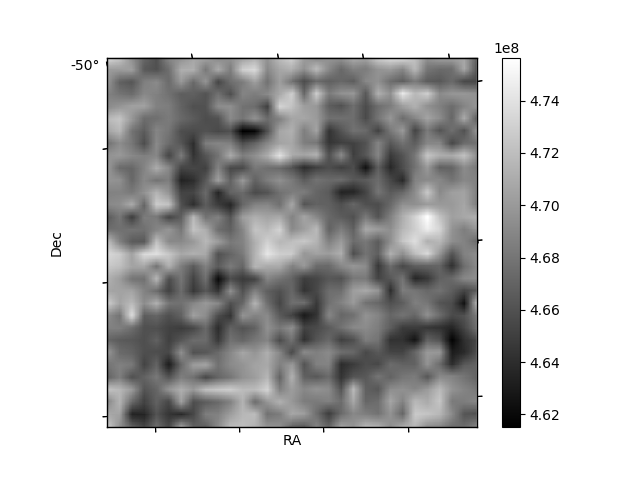
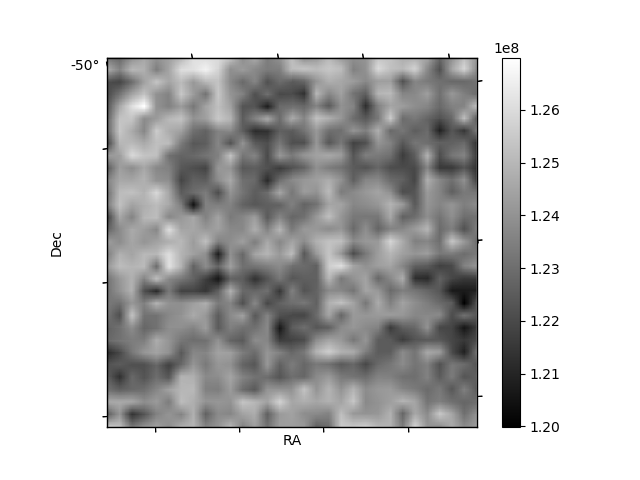
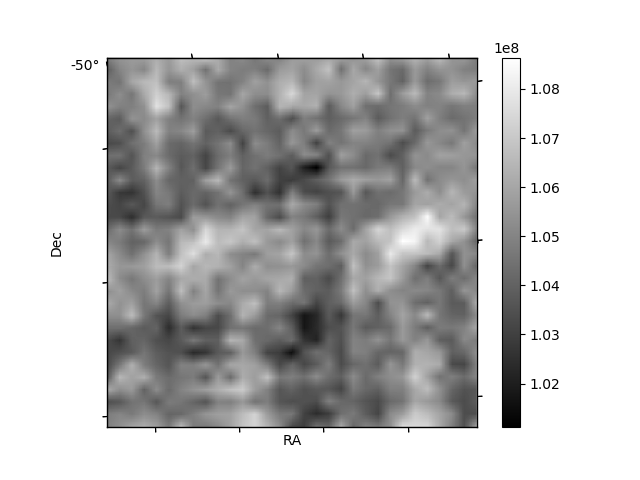
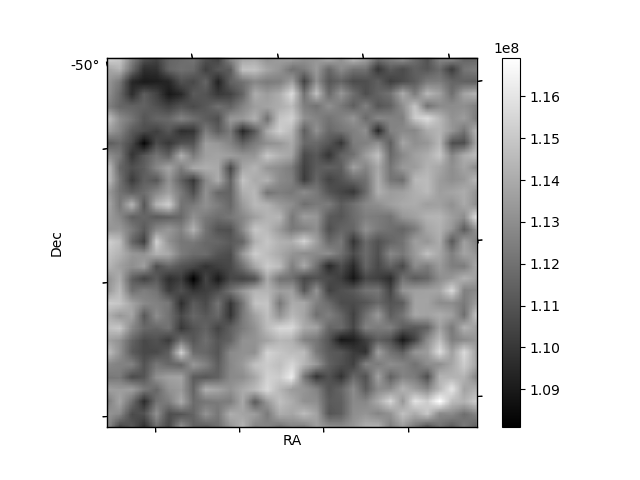
Histogram calculated using DETX and DETY for each event in the final _common_clean file
| Quadrant A | 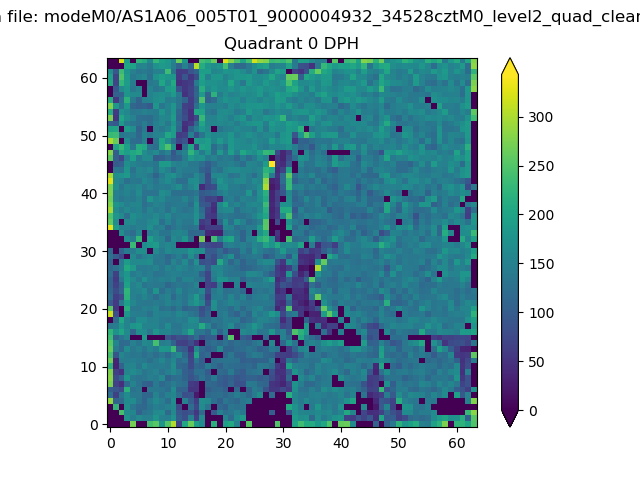 |
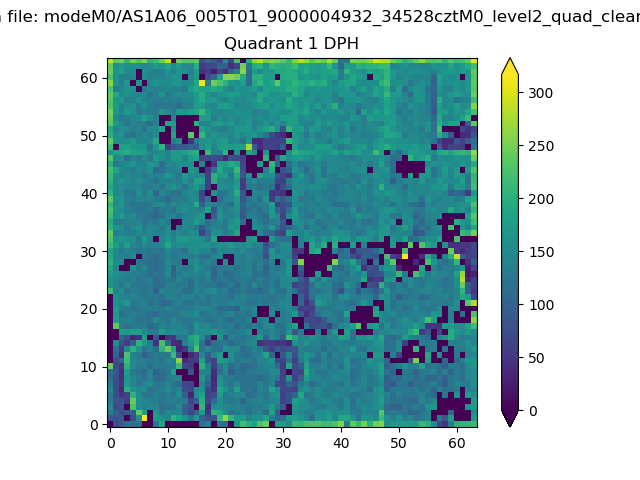 |
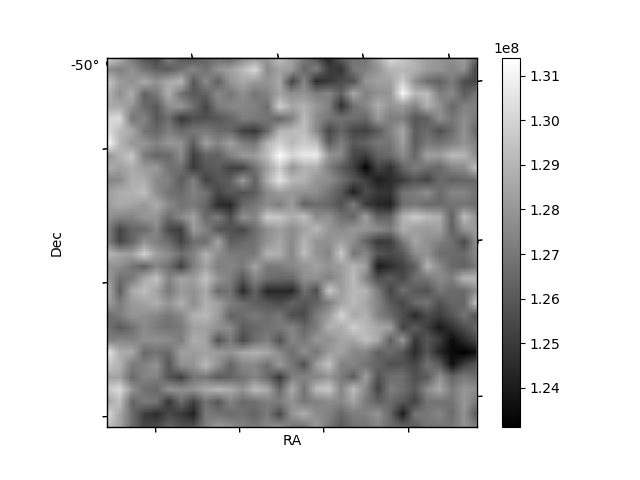
Quadrant B |
|---|---|---|---|
| Quadrant D | 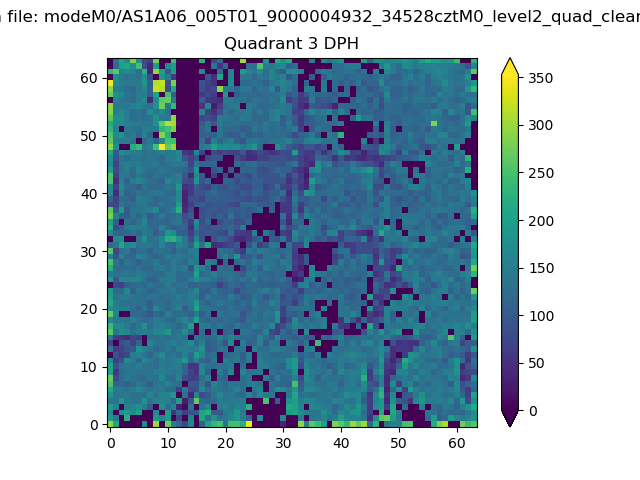 |
 |
Quadrant C |
| Plot type | Count rate plots | Images |
|---|---|---|
| Comparison with Poisson distribution Blue bars denote a histogram of data divided into 1 sec bins. Red curve is a Poisson curve with rate = median count rate of data. |
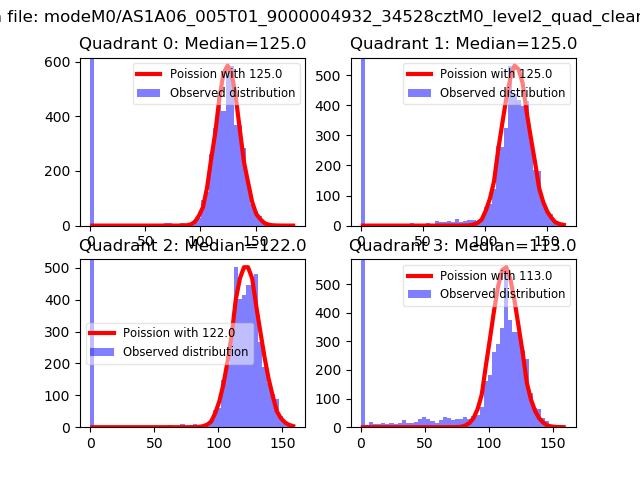 |
 |
| Quadrant-wise count rates Data is divided into 100 sec bins |
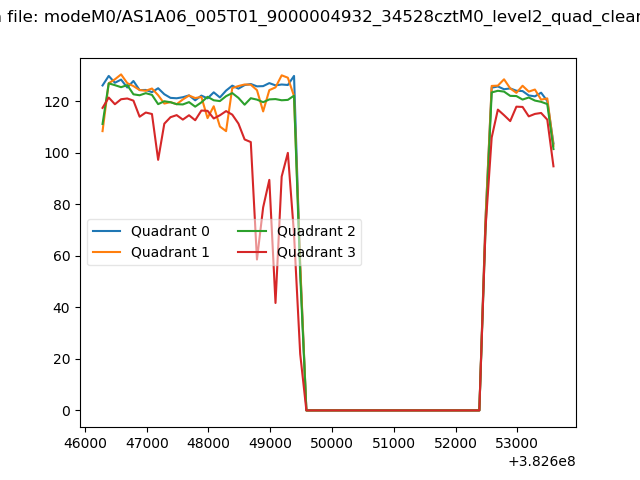 |
|
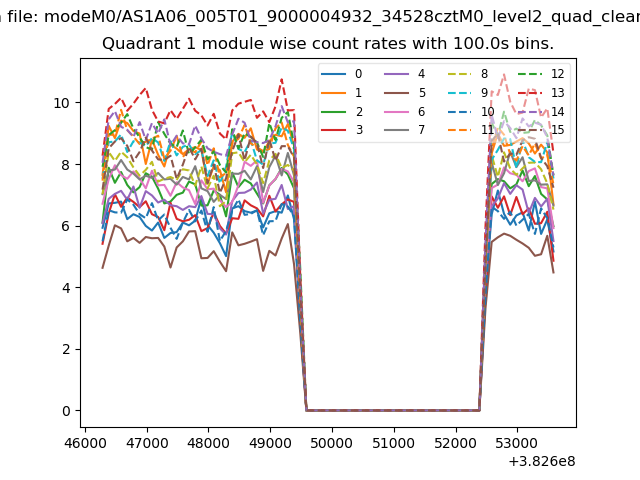
| Module-wise count rates for Quadrant A Data is divided into 100 sec bins |
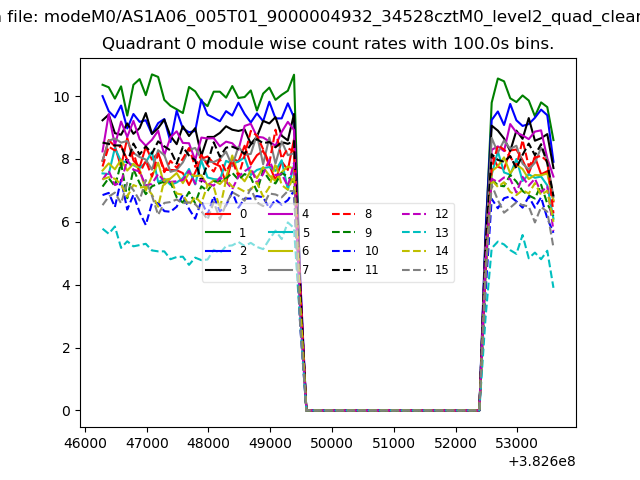 |
 |
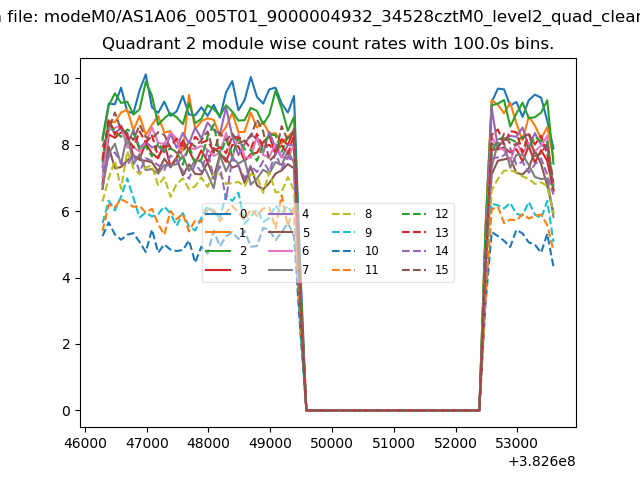
| Module-wise count rates for Quadrant B Data is divided into 100 sec bins |
 |
 |
| Module-wise count rates for Quadrant C Data is divided into 100 sec bins |
 |
 |
| Module-wise count rates for Quadrant D Data is divided into 100 sec bins |
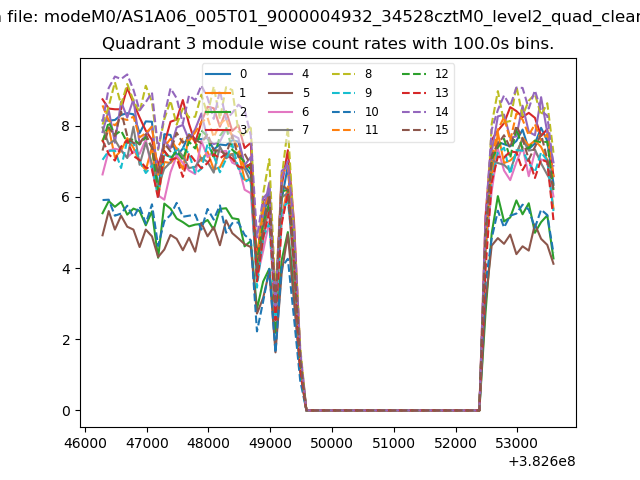 |
 |
| Parameter | Plot |
|---|---|
| CZT HV Monitor | 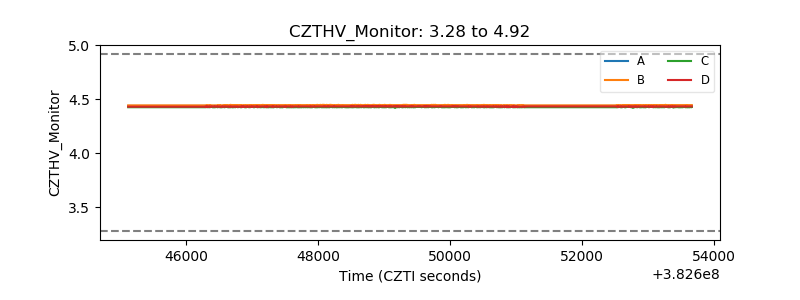 |
| D_VDD | 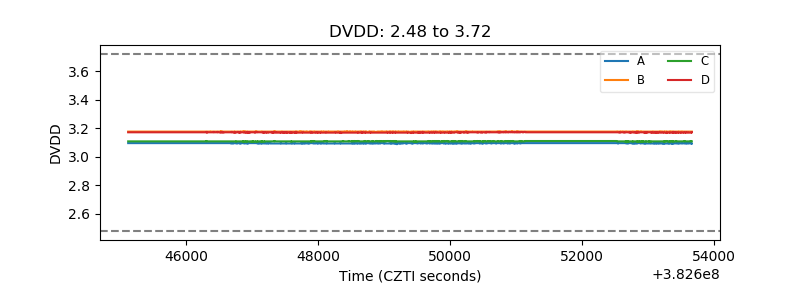 |
| Temperature 1 | 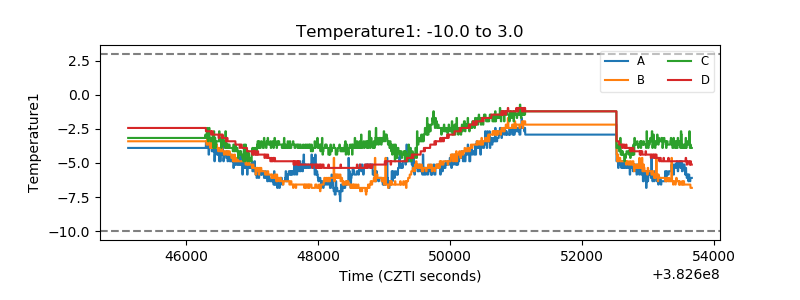 |
| Veto HV Monitor | 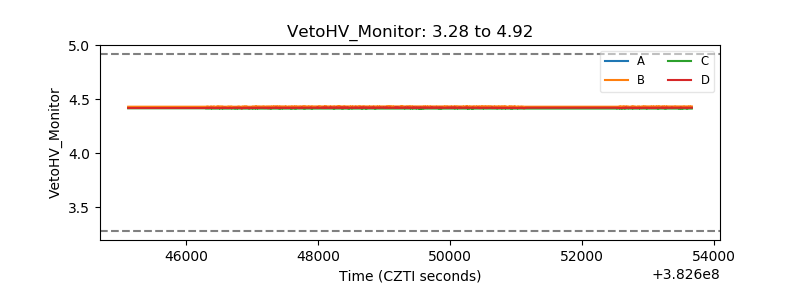 |
| Veto LLD | 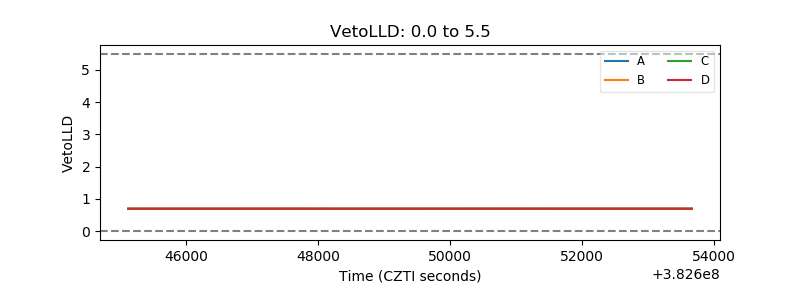 |
| Alpha Counter | 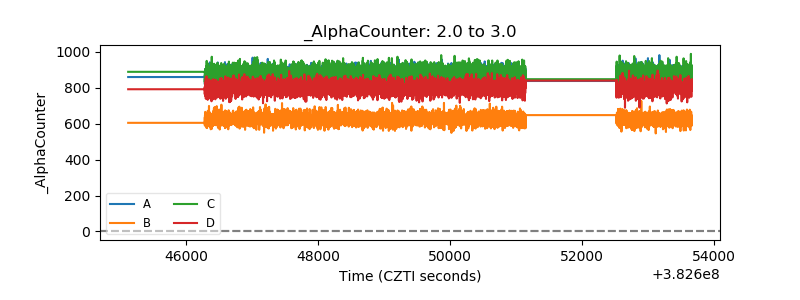 |
| _CPM_Rate | 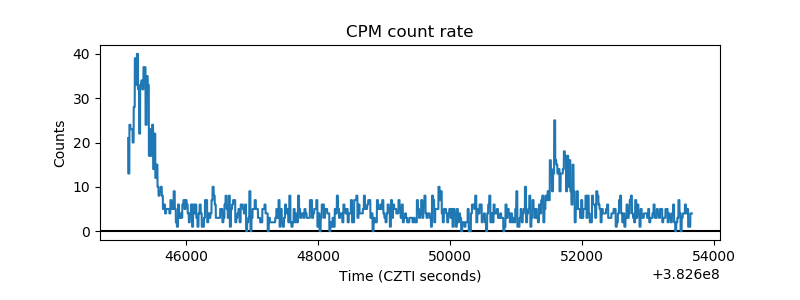 |
| CZT Counter | 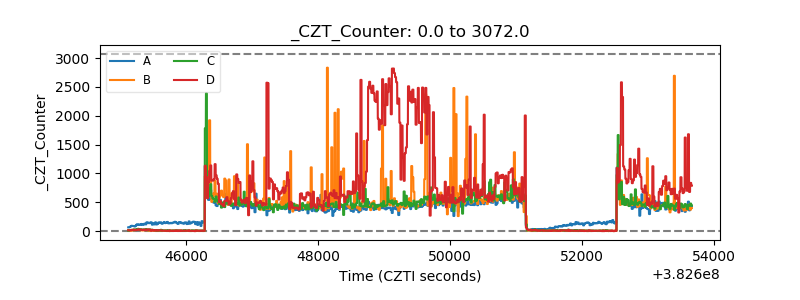 |
| +2.5 Volts monitor | 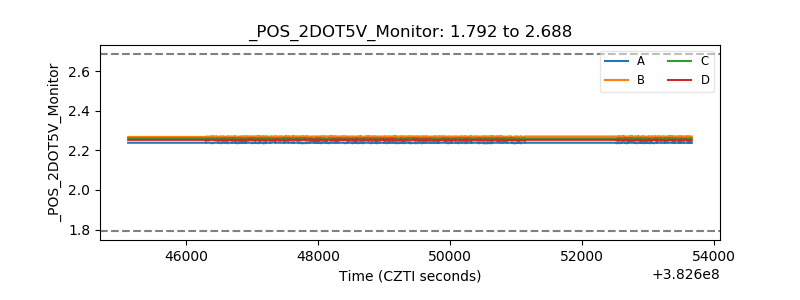 |
| +5 Volts monitor | 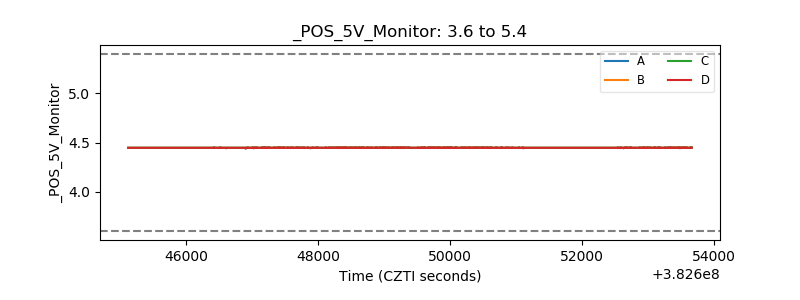 |
| _ROLL_ROT | 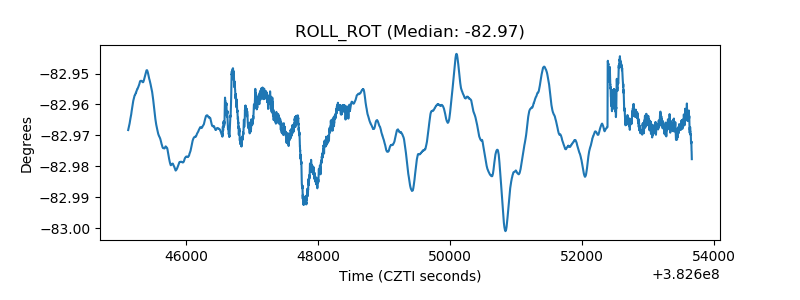 |
| _Roll_DEC | 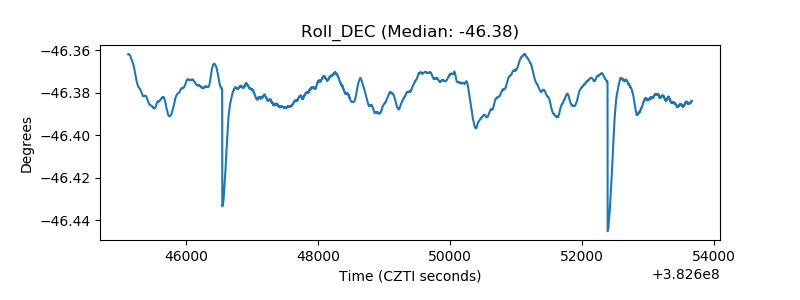 |
| _Roll_RA | 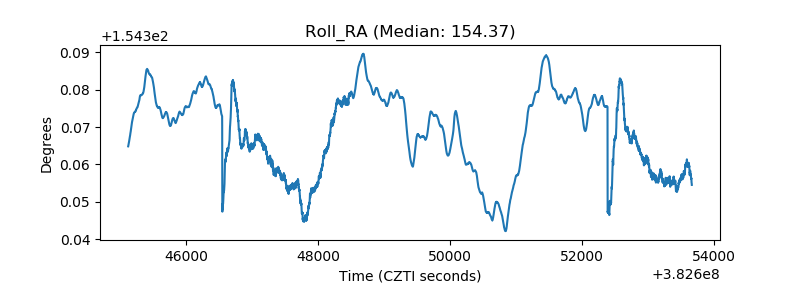 |
| Veto Counter | 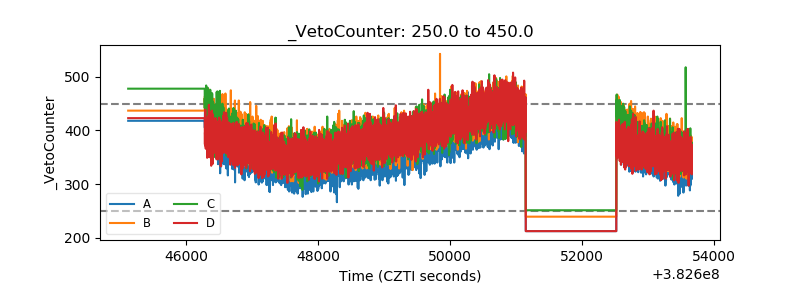 |