| Param | Original file | Final file |
|---|---|---|
| Filename | modeM0/AS1A06_005T01_9000004932_34527cztM0_level2.evt | modeM0/AS1A06_005T01_9000004932_34527cztM0_level2_quad_clean.evt |
| Size (bytes) | 555,387,840 | 89,334,720 |
| Size | 529.7 MB | 85.2 MB |
| Events in quadrant A | 2,716,266 | 607,666 |
| Events in quadrant B | 4,558,398 | 584,052 |
| Events in quadrant C | 2,957,203 | 594,508 |
| Events in quadrant D | 6,193,943 | 512,252 |
| Mode M9 | |||
|---|---|---|---|
| Quadrant | BADHDUFLAG | Total packets | Discarded packets |
| A | 0 | 37 | 0 |
| B | 0 | 37 | 0 |
| C | 0 | 37 | 0 |
| D | 0 | 37 | 0 |
| Mode SS | |||
|---|---|---|---|
| Quadrant | BADHDUFLAG | Total packets | Discarded packets |
| A | 0 | 120 | 0 |
| B | 0 | 120 | 0 |
| C | 0 | 120 | 0 |
| D | 0 | 120 | 0 |
| Mode M0 | |||
|---|---|---|---|
| Quadrant | BADHDUFLAG | Total packets | Discarded packets |
| A | 0 | 12011 | 3 |
| B | 0 | 17353 | 2 |
| C | 0 | 12362 | 2 |
| D | 0 | 22242 | 2 |
| Quadrant | Total seconds | Saturated seconds | Saturation percentage |
|---|---|---|---|
| A | 5815 | 25 | 0.429923% |
| B | 5815 | 680 | 11.693895% |
| C | 5815 | 38 | 0.653482% |
| D | 5815 | 921 | 15.838349% |
Noise dominated data is calculated using 1-second bins in cleaned event files. If a bin has >2000 counts, and if more than 50% of those come from <1% of pixels, then it is considered to be noise-dominated and hence unusable.
| Quadrant | # 1 sec bins | Bins with >0 counts | Bins with >2000 counts | High rate bins dominated by noise | Noise dominated (total time) | Noise dominated (detector-on time) | Marked lightcurve |
|---|---|---|---|---|---|---|---|
| A | 9491 | 5817 | 10 | 10 | 0.11% | 0.17% | 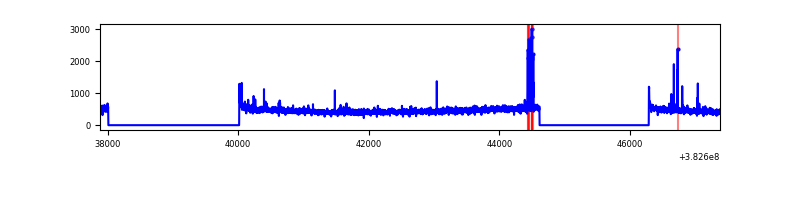 |
| B | 9491 | 5817 | 456 | 456 | 4.80% | 7.84% | 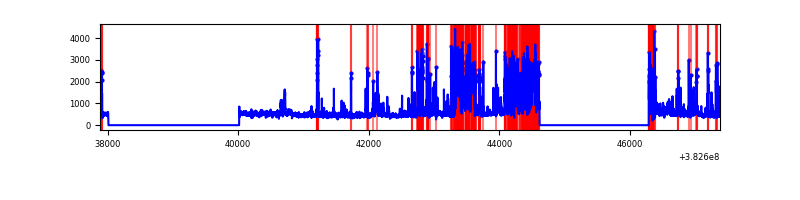 |
| C | 9491 | 5817 | 21 | 21 | 0.22% | 0.36% | 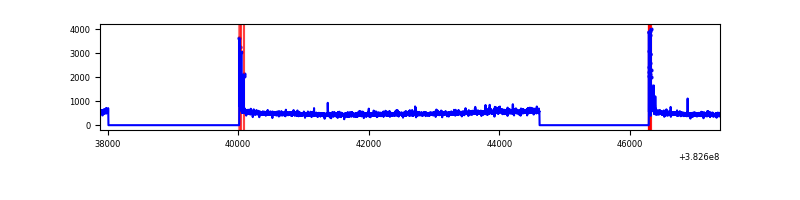 |
| D | 9491 | 5817 | 796 | 796 | 8.39% | 13.68% | 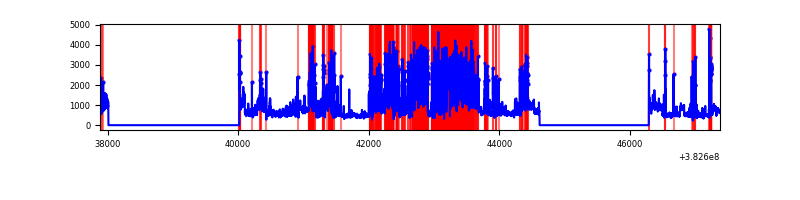 |
Top three noisy pixels from each quadrant. If the there are fewer than three noisy pixels in the level2.evt file, extra rows are filled as -1
| Pixel properties | Quadrant properties | ||||||
|---|---|---|---|---|---|---|---|
| Quadrant | DetID | PixID | Counts | Sigma | Mean | Median | Sigma |
| A | 9 | 143 | 79440 | 585.22 | 668 | 655 | 134.6 |
| A | 10 | 83 | 40621 | 296.87 | 668 | 655 | 134.6 |
| A | 13 | 6 | 11136 | 77.85 | 668 | 655 | 134.6 |
| B | 5 | 172 | 1397239 | 11532.02 | 632 | 614 | 121.1 |
| B | 4 | 171 | 389331 | 3209.66 | 632 | 614 | 121.1 |
| B | 0 | 190 | 75802 | 620.83 | 632 | 614 | 121.1 |
| C | 15 | 214 | 261725 | 1730.56 | 648 | 651 | 150.9 |
| C | 0 | 10 | 121547 | 801.37 | 648 | 651 | 150.9 |
| C | 14 | 67 | 44350 | 289.66 | 648 | 651 | 150.9 |
| D | 10 | 118 | 1579739 | 10783.22 | 601 | 585 | 146.4 |
| D | 7 | 223 | 908279 | 6198.17 | 601 | 585 | 146.4 |
| D | 8 | 195 | 801189 | 5466.91 | 601 | 585 | 146.4 |
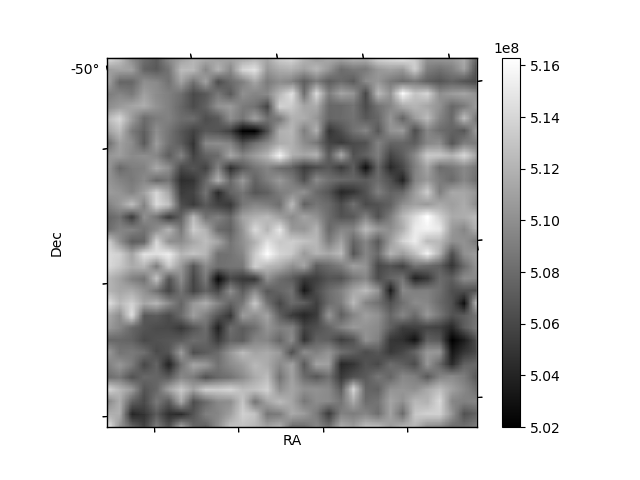
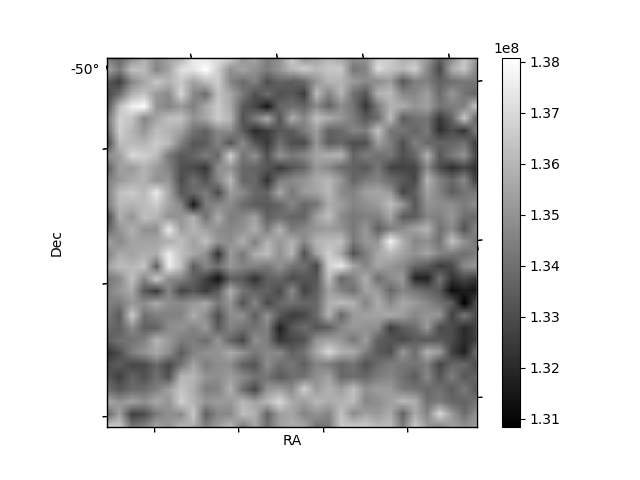
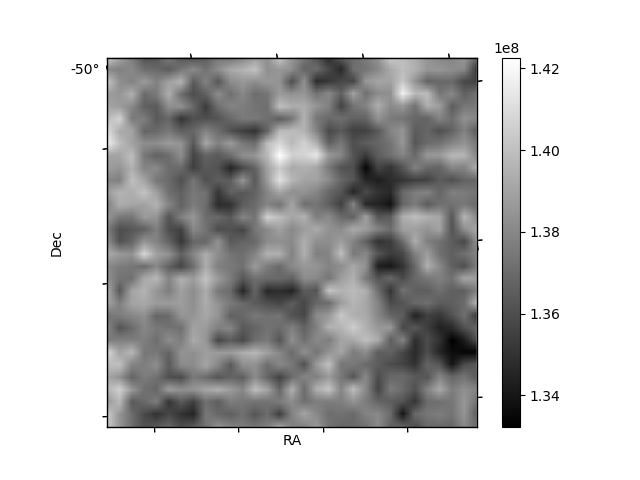
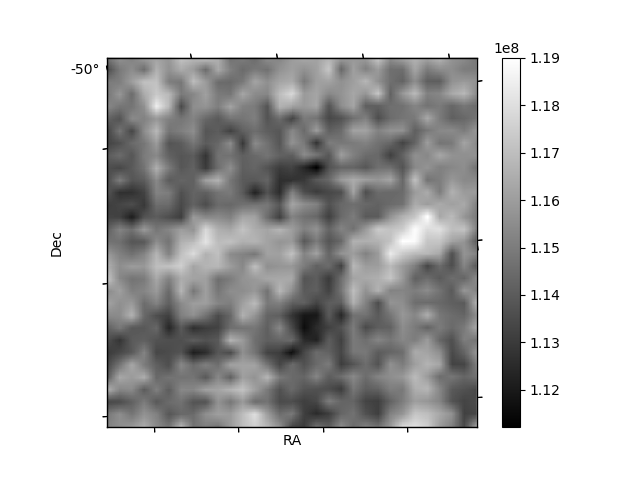
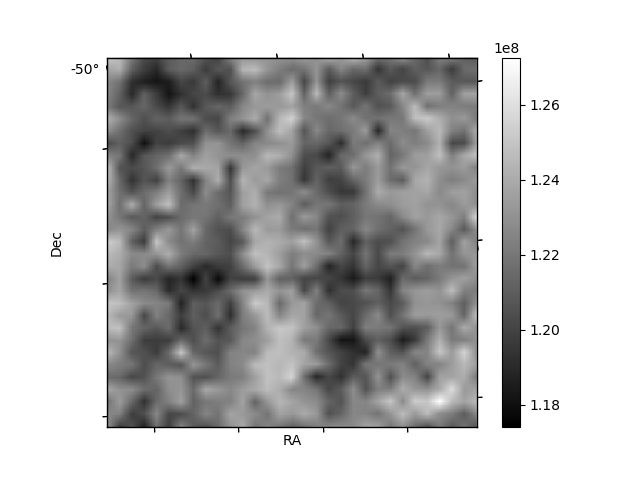
Histogram calculated using DETX and DETY for each event in the final _common_clean file
| Quadrant A | 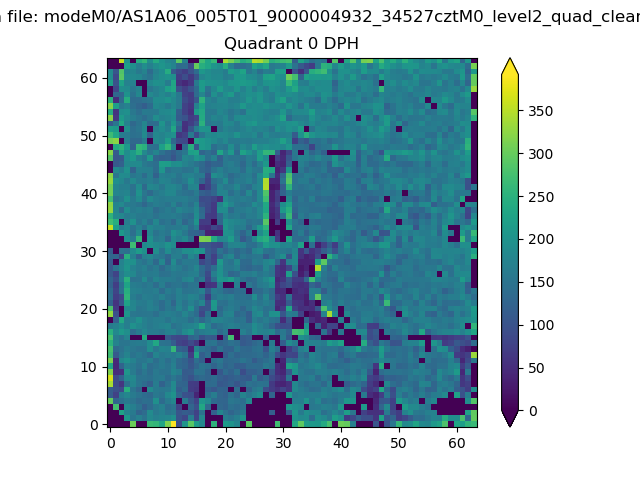 |
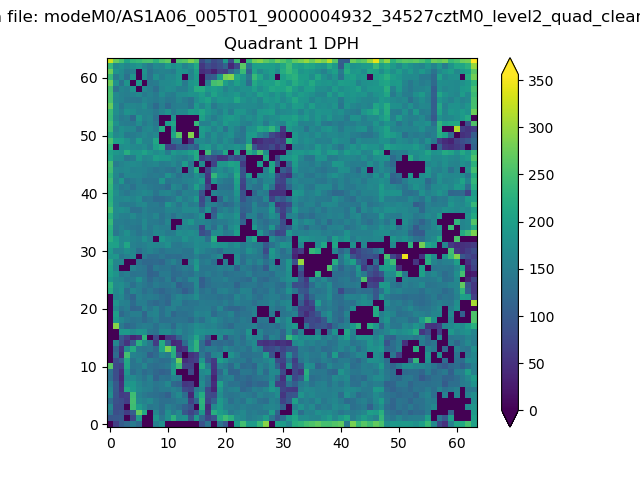 |
Quadrant B |
|---|---|---|---|
| Quadrant D | 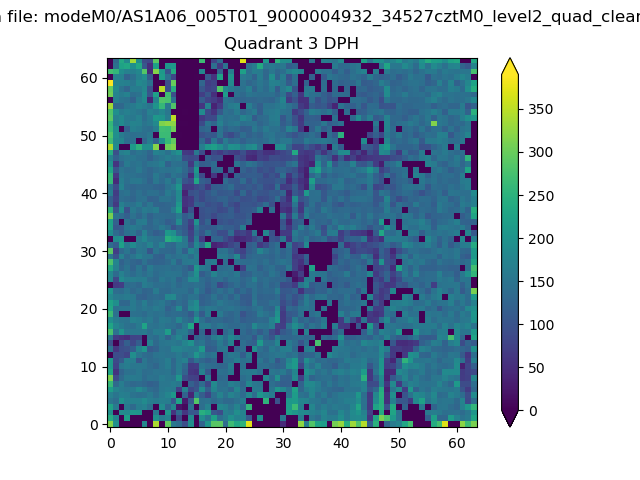 |
 |
Quadrant C |
| Plot type | Count rate plots | Images |
|---|---|---|
| Comparison with Poisson distribution Blue bars denote a histogram of data divided into 1 sec bins. Red curve is a Poisson curve with rate = median count rate of data. |
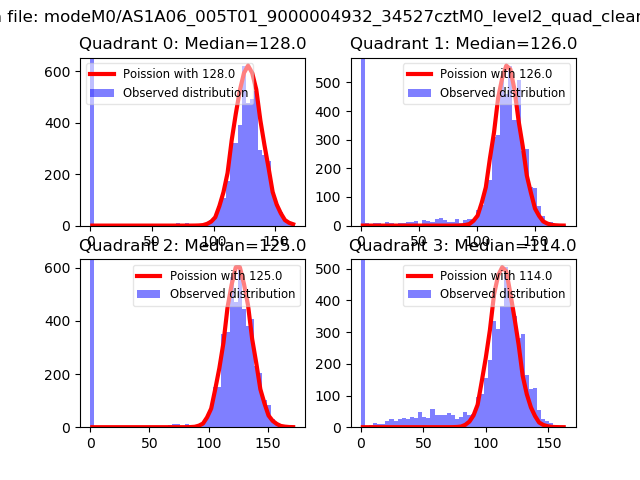 |
 |
| Quadrant-wise count rates Data is divided into 100 sec bins |
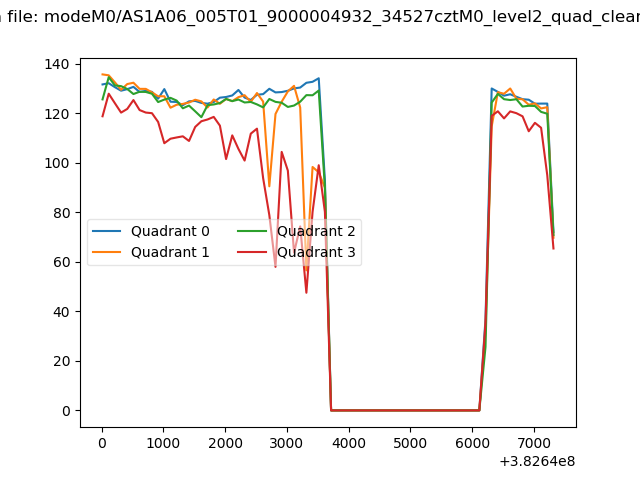 |
|
| Module-wise count rates for Quadrant A Data is divided into 100 sec bins |
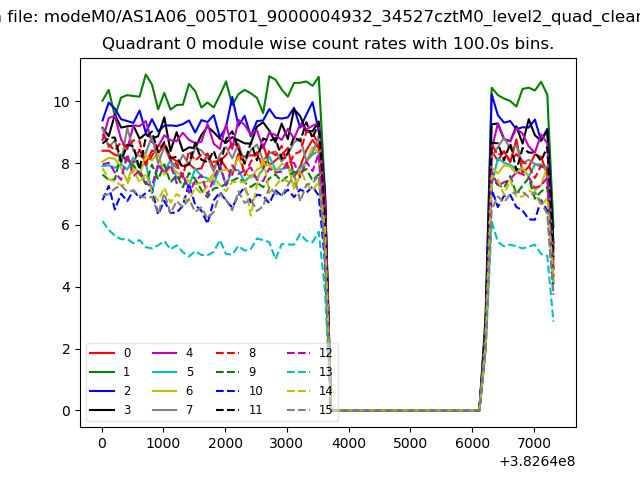 |
 |
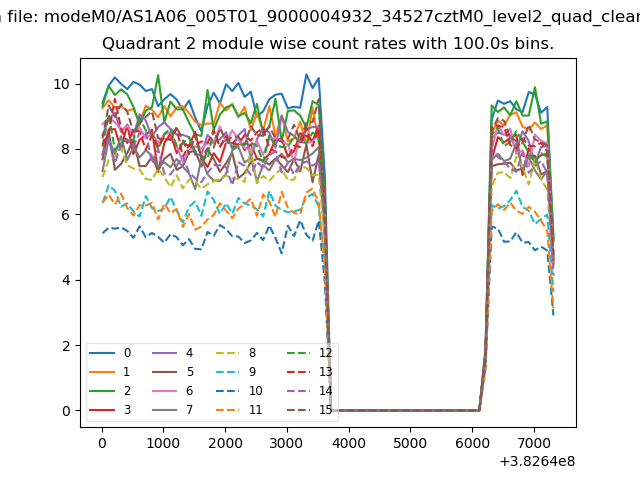
| Module-wise count rates for Quadrant B Data is divided into 100 sec bins |
 |
 |
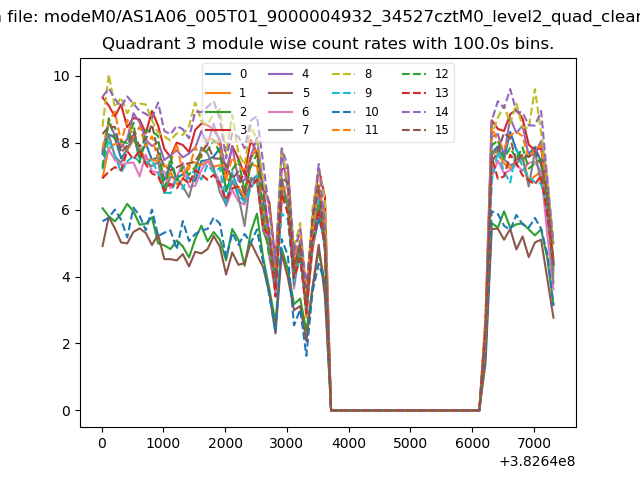
| Module-wise count rates for Quadrant C Data is divided into 100 sec bins |
 |
 |
| Module-wise count rates for Quadrant D Data is divided into 100 sec bins |
 |
 |
| Parameter | Plot |
|---|---|
| CZT HV Monitor | 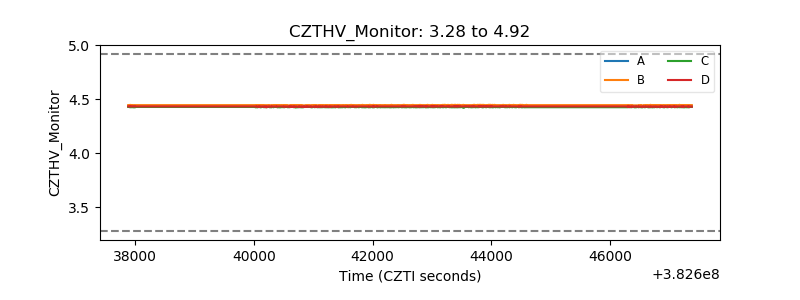 |
| D_VDD | 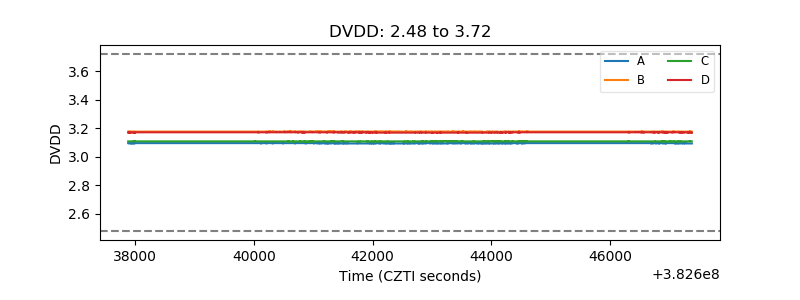 |
| Temperature 1 | 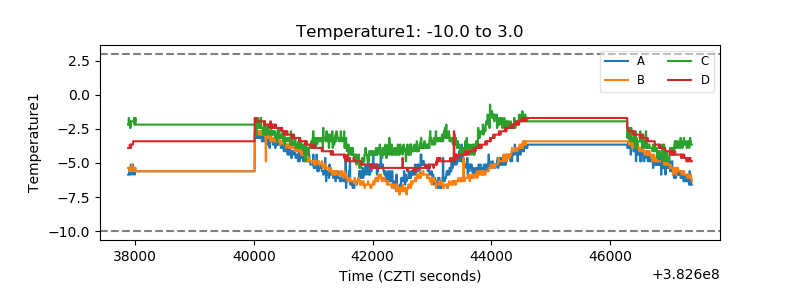 |
| Veto HV Monitor | 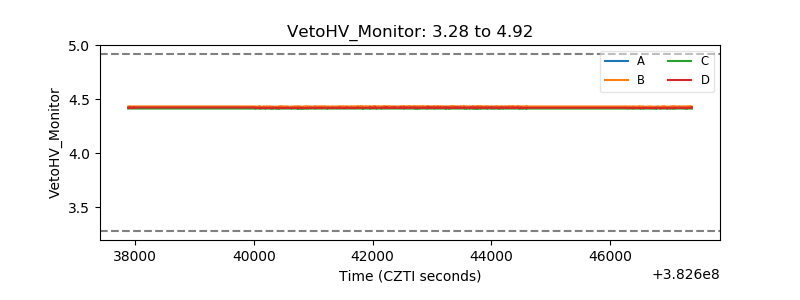 |
| Veto LLD | 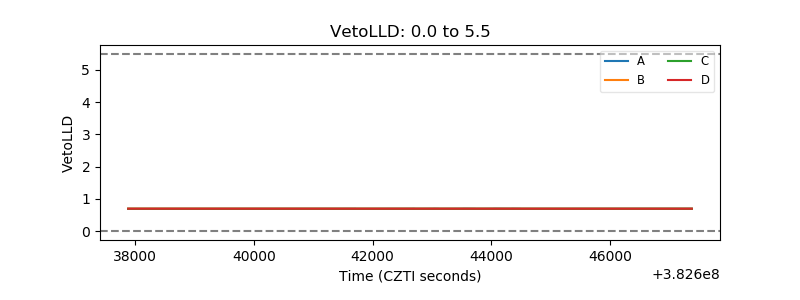 |
| Alpha Counter | 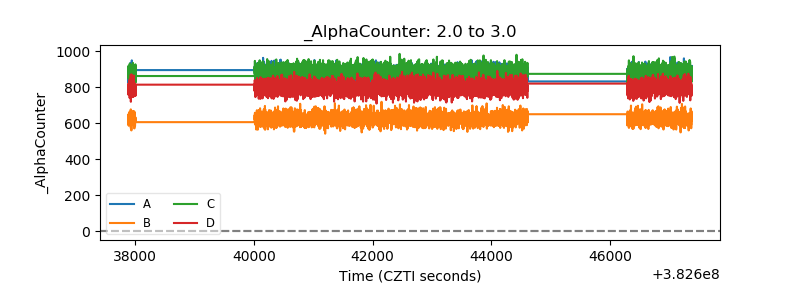 |
| _CPM_Rate | 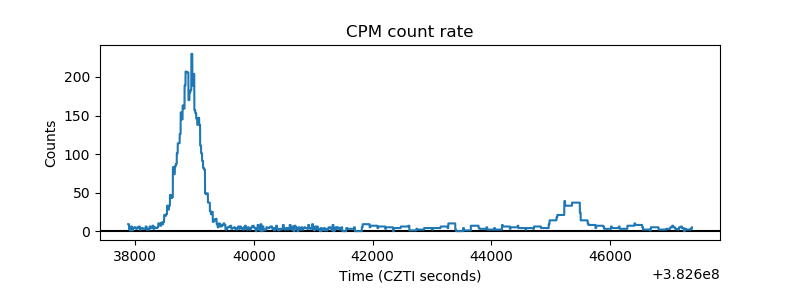 |
| CZT Counter | 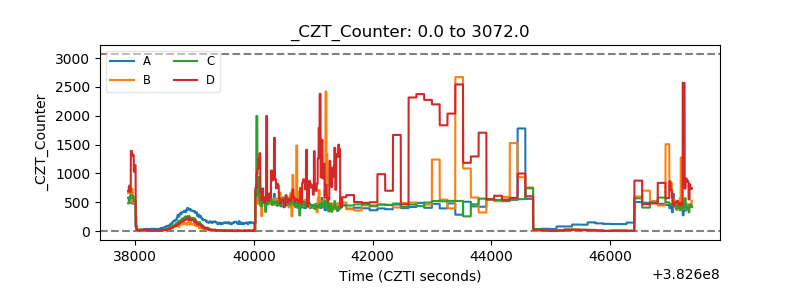 |
| +2.5 Volts monitor | 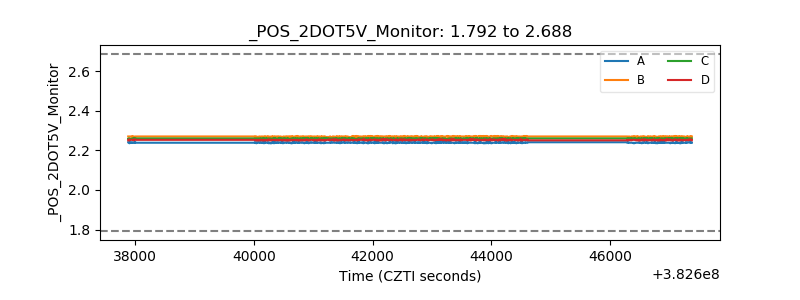 |
| +5 Volts monitor | 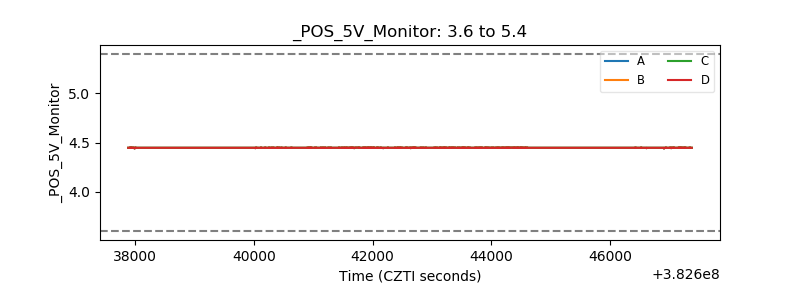 |
| _ROLL_ROT | 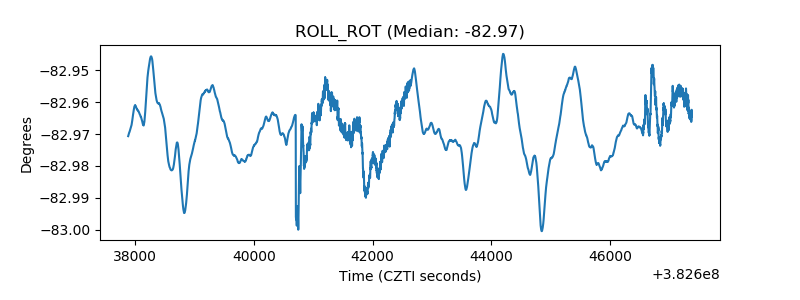 |
| _Roll_DEC | 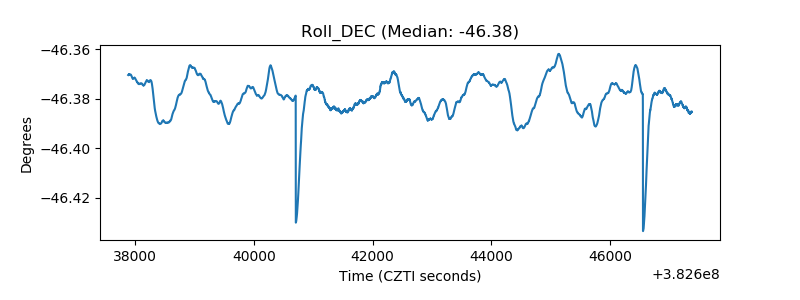 |
| _Roll_RA | 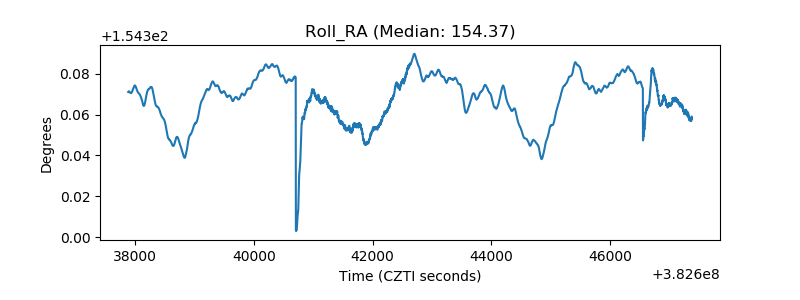 |
| Veto Counter | 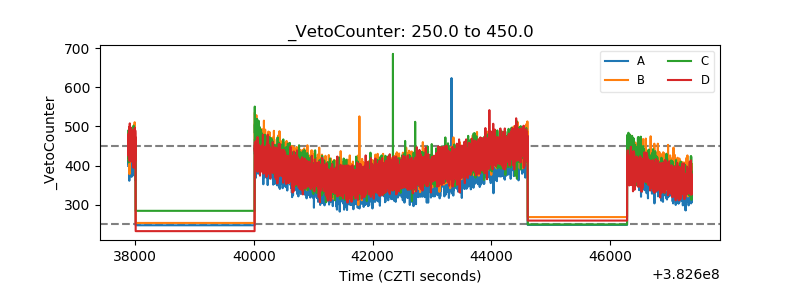 |