| Param | Original file | Final file |
|---|---|---|
| Filename | modeM0/AS1A06_005T01_9000004932cztM0_level2_bc.evt | modeM0/AS1A06_005T01_9000004932cztM0_level2_quad_clean.evt |
| Size (bytes) | 2,768,866,560 | 710,582,400 |
| Size | 2.6 GB | 677.7 MB |
| Events in quadrant A | 11,752,278 | 4,651,765 |
| Events in quadrant B | 20,026,065 | 4,505,933 |
| Events in quadrant C | 14,732,299 | 4,569,298 |
| Events in quadrant D | 33,655,911 | 4,073,166 |
| Mode M9 | |||
|---|---|---|---|
| Quadrant | BADHDUFLAG | Total packets | Discarded packets |
| A | 0 | 201 | 0 |
| B | 0 | 201 | 0 |
| C | 0 | 201 | 0 |
| D | 0 | 201 | 0 |
| Mode SS | |||
|---|---|---|---|
| Quadrant | BADHDUFLAG | Total packets | Discarded packets |
| A | 0 | 1104 | 0 |
| B | 0 | 1104 | 0 |
| C | 0 | 1104 | 0 |
| D | 0 | 1104 | 0 |
| Mode M0 | |||
|---|---|---|---|
| Quadrant | BADHDUFLAG | Total packets | Discarded packets |
| A | 0 | 111361 | 0 |
| B | 0 | 148216 | 0 |
| C | 0 | 116909 | 0 |
| D | 0 | 193240 | 0 |
| Quadrant | Total seconds | Saturated seconds | Saturation percentage |
|---|---|---|---|
| A | 54243 | 112 | 0.206478% |
| B | 54243 | 3819 | 7.040540% |
| C | 54243 | 159 | 0.293125% |
| D | 54243 | 5825 | 10.738713% |
Noise dominated data is calculated using 1-second bins in cleaned event files. If a bin has >2000 counts, and if more than 50% of those come from <1% of pixels, then it is considered to be noise-dominated and hence unusable.
| Quadrant | # 1 sec bins | Bins with >0 counts | Bins with >2000 counts | High rate bins dominated by noise | Noise dominated (total time) | Noise dominated (detector-on time) | Marked lightcurve |
|---|---|---|---|---|---|---|---|
| A | 72557 | 54251 | 7 | 7 | 0.01% | 0.01% | 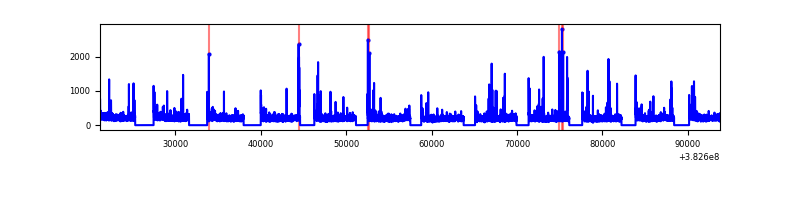 |
| B | 72556 | 54241 | 281 | 281 | 0.39% | 0.52% | 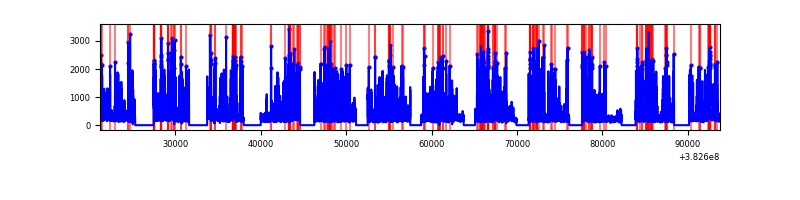 |
| C | 72557 | 54247 | 24 | 24 | 0.03% | 0.04% | 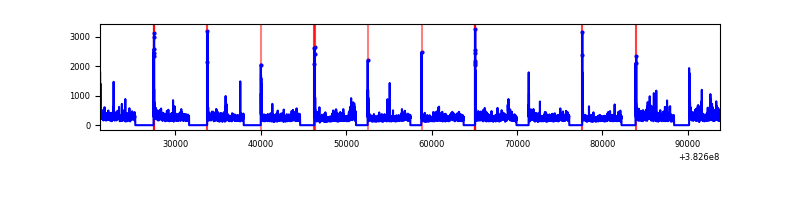 |
| D | 72556 | 54242 | 1046 | 1046 | 1.44% | 1.93% | 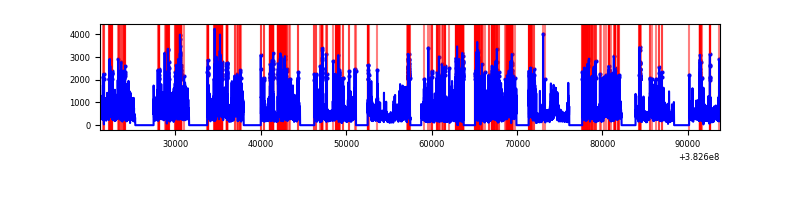 |
Top three noisy pixels from each quadrant. If the there are fewer than three noisy pixels in the level2.evt file, extra rows are filled as -1
| Pixel properties | Quadrant properties | ||||||
|---|---|---|---|---|---|---|---|
| Quadrant | DetID | PixID | Counts | Sigma | Mean | Median | Sigma |
| A | 9 | 143 | 300128 | 472.63 | 2855 | 2813 | 629.1 |
| A | 10 | 83 | 252998 | 397.71 | 2855 | 2813 | 629.1 |
| A | 13 | 6 | 110143 | 170.62 | 2855 | 2813 | 629.1 |
| B | 5 | 172 | 7097556 | 13010.84 | 2780 | 2730 | 545.3 |
| B | 0 | 190 | 401689 | 731.63 | 2780 | 2730 | 545.3 |
| B | 4 | 171 | 345298 | 628.22 | 2780 | 2730 | 545.3 |
| C | 15 | 214 | 2295143 | 3587.88 | 2791 | 2770 | 638.9 |
| C | 14 | 67 | 1061703 | 1657.38 | 2791 | 2770 | 638.9 |
| C | 0 | 10 | 392628 | 610.18 | 2791 | 2770 | 638.9 |
| D | 8 | 195 | 7739725 | 12051.75 | 2670 | 2588 | 642.0 |
| D | 7 | 80 | 5588531 | 8700.94 | 2670 | 2588 | 642.0 |
| D | 10 | 118 | 2432246 | 3784.56 | 2670 | 2588 | 642.0 |
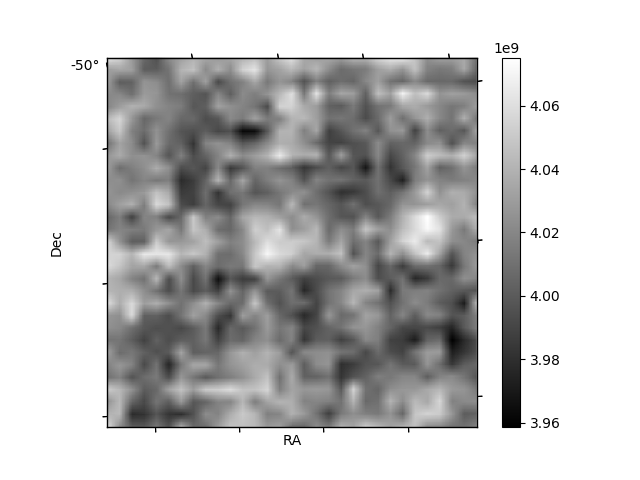
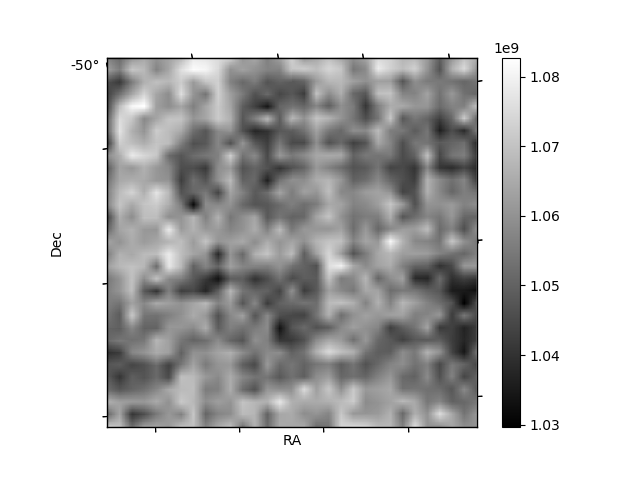
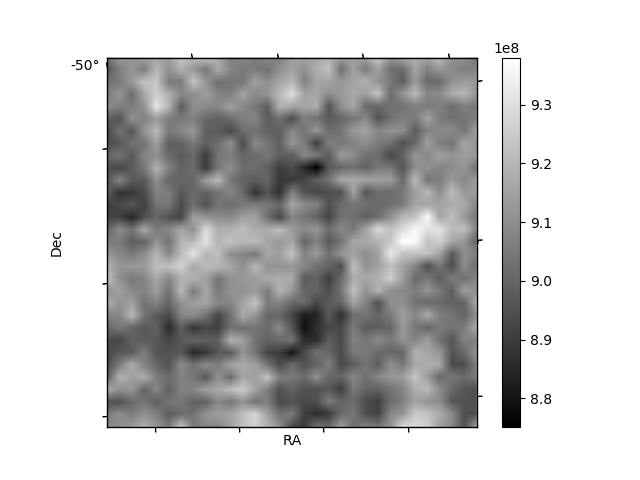
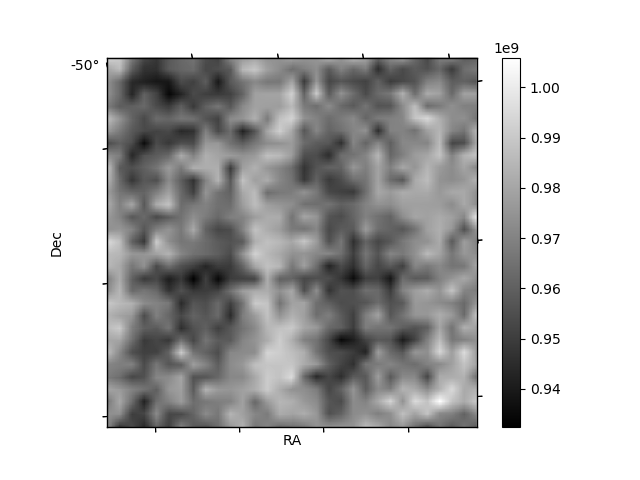
Histogram calculated using DETX and DETY for each event in the final _common_clean file
| Quadrant A | 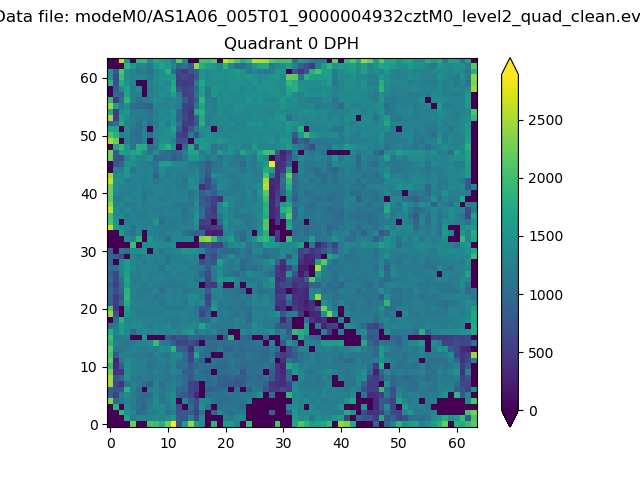 |
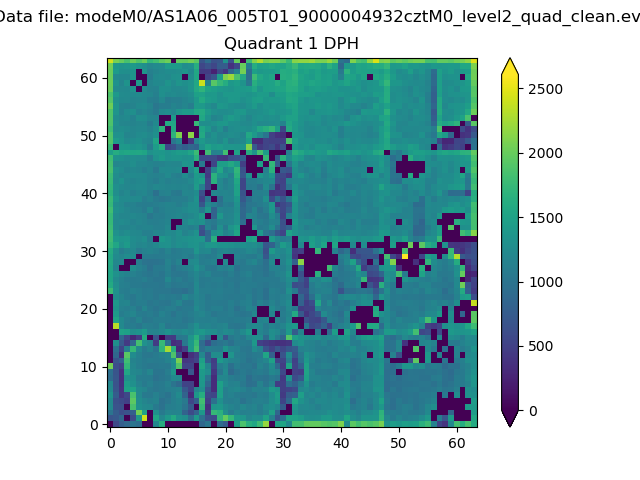 |
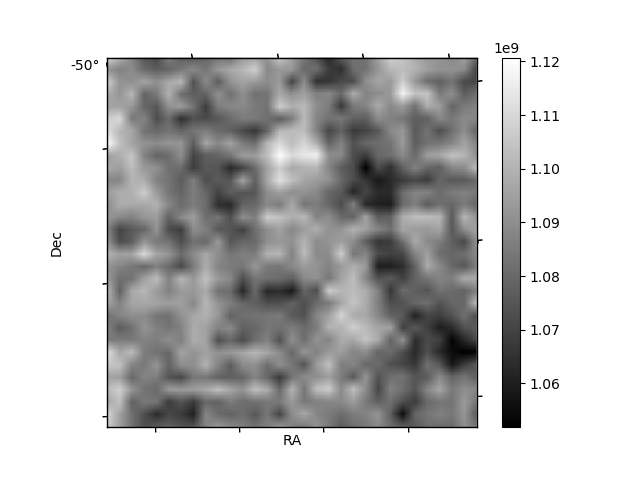
Quadrant B |
|---|---|---|---|
| Quadrant D | 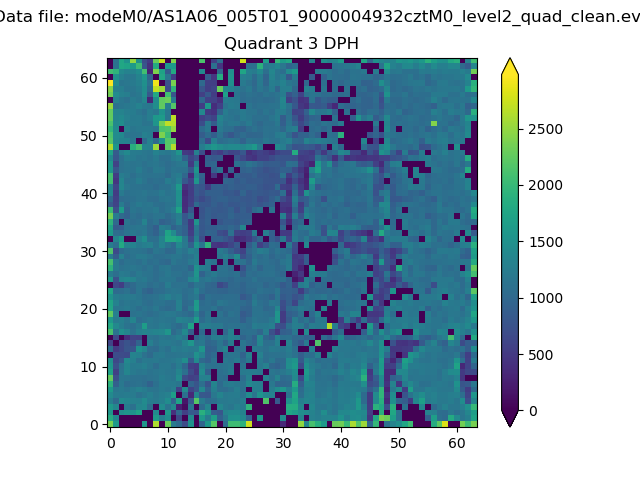 |
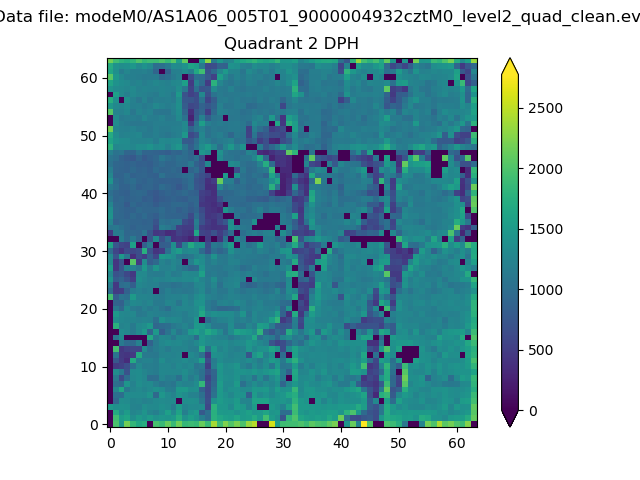 |
Quadrant C |
| Plot type | Count rate plots | Images |
|---|---|---|
| Comparison with Poisson distribution Blue bars denote a histogram of data divided into 1 sec bins. Red curve is a Poisson curve with rate = median count rate of data. |
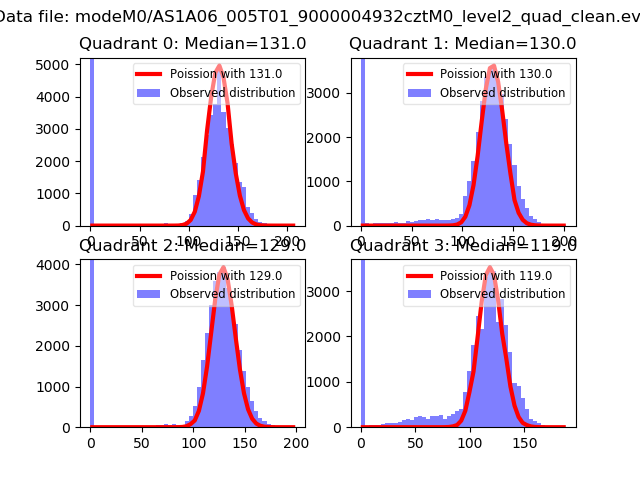 |
 |
| Quadrant-wise count rates Data is divided into 100 sec bins |
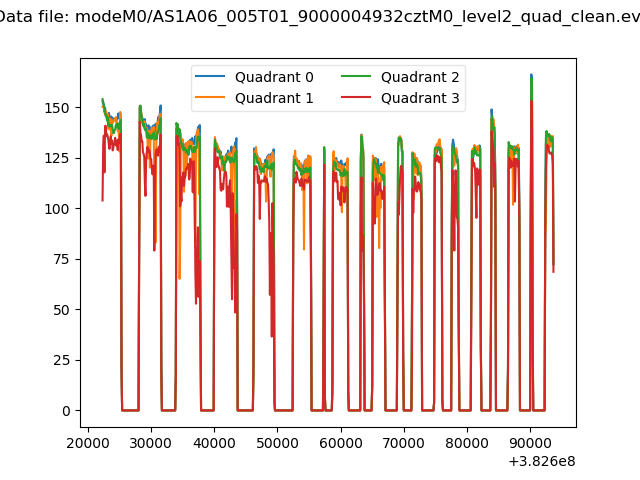 |
|
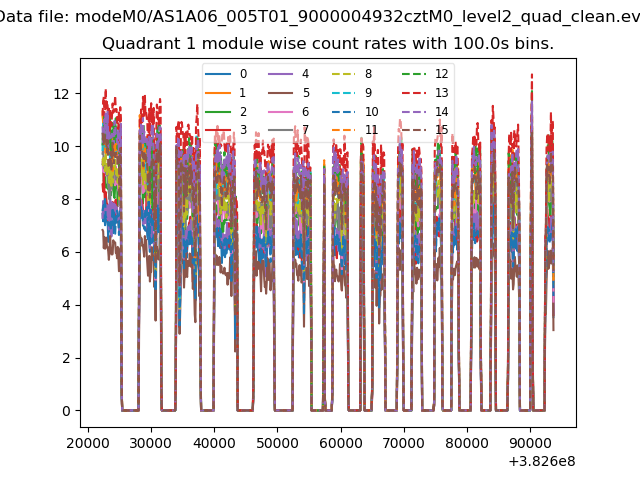
| Module-wise count rates for Quadrant A Data is divided into 100 sec bins |
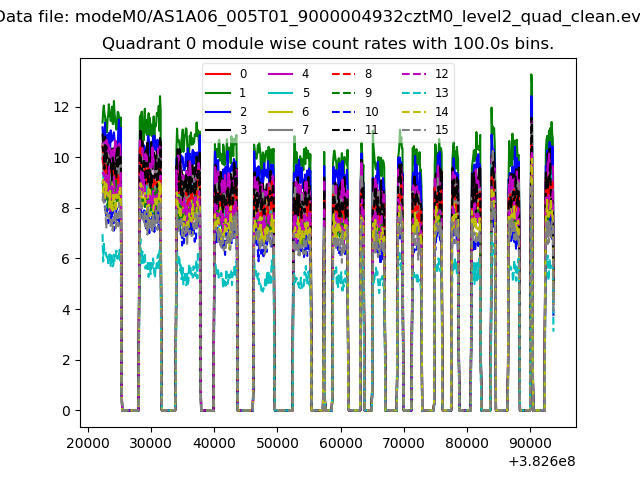 |
 |
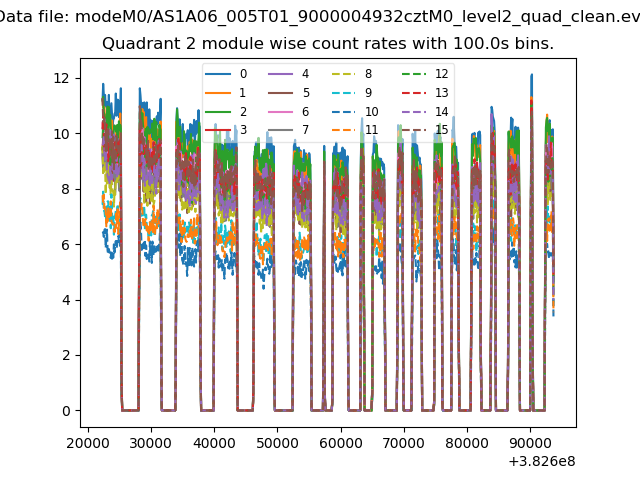
| Module-wise count rates for Quadrant B Data is divided into 100 sec bins |
 |
 |
| Module-wise count rates for Quadrant C Data is divided into 100 sec bins |
 |
 |
| Module-wise count rates for Quadrant D Data is divided into 100 sec bins |
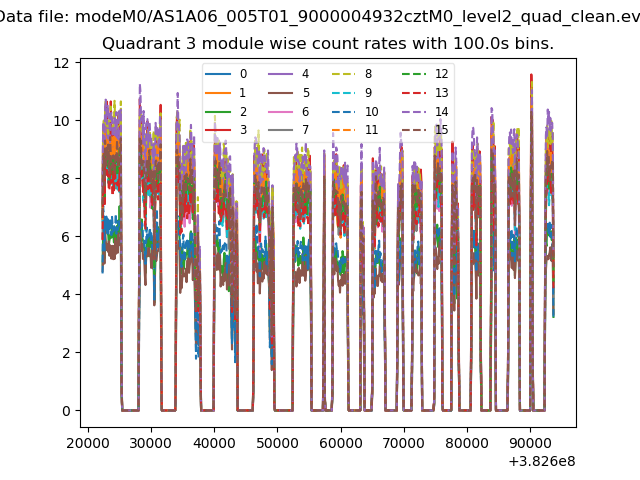 |
 |
| Parameter | Plot |
|---|---|
| CZT HV Monitor | 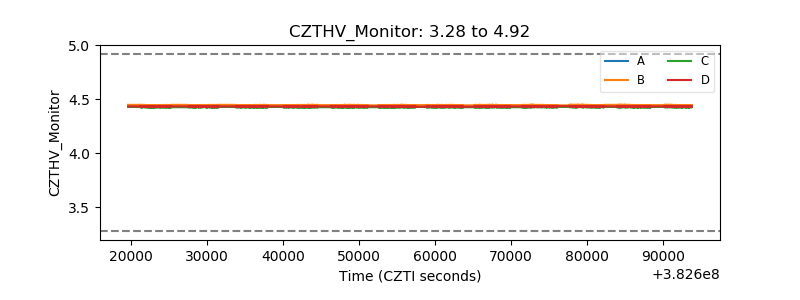 |
| D_VDD | 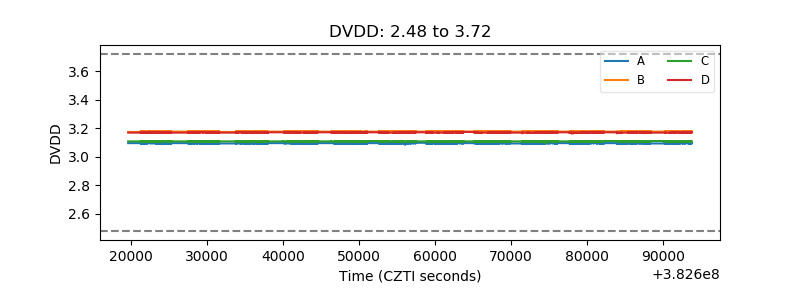 |
| Temperature 1 | 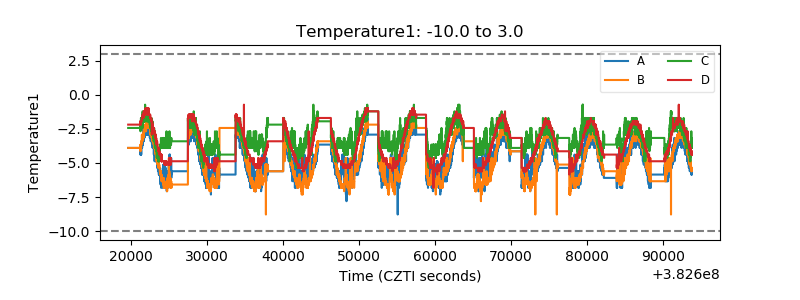 |
| Veto HV Monitor | 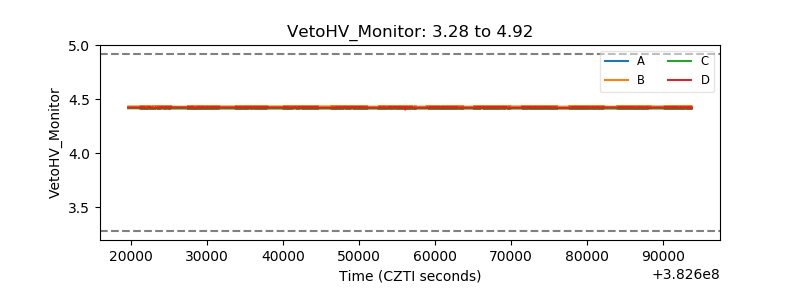 |
| Veto LLD | 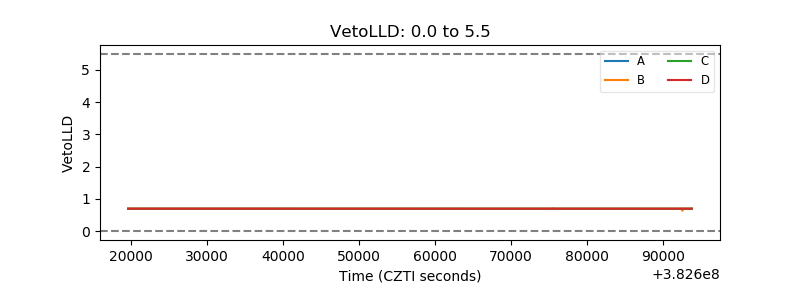 |
| Alpha Counter | 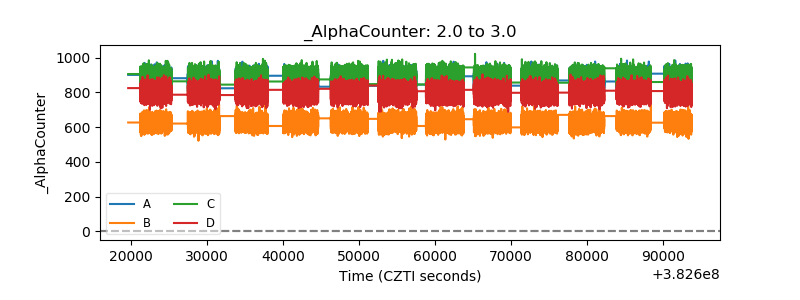 |
| _CPM_Rate | 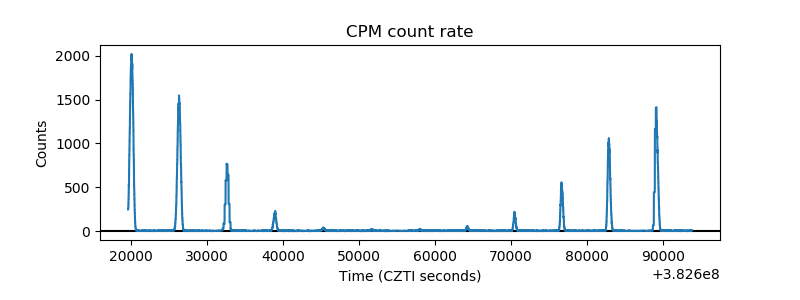 |
| CZT Counter | 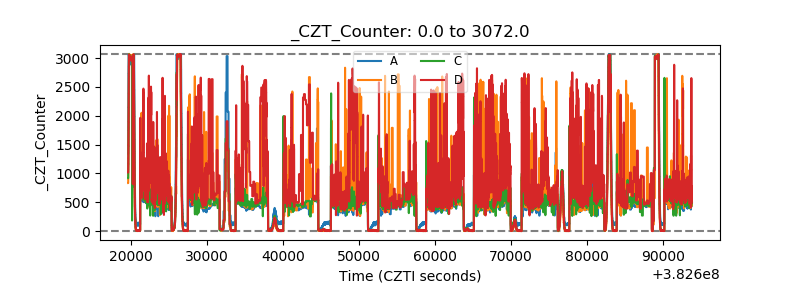 |
| +2.5 Volts monitor | 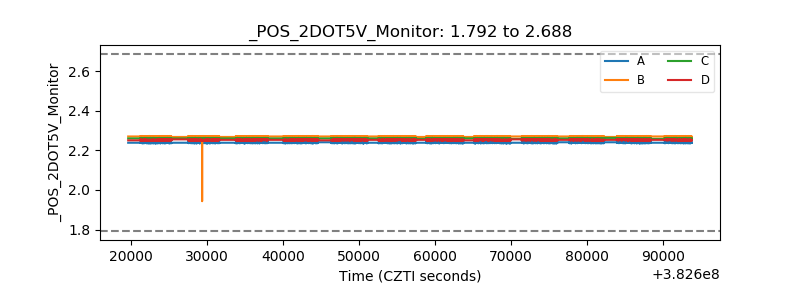 |
| +5 Volts monitor | 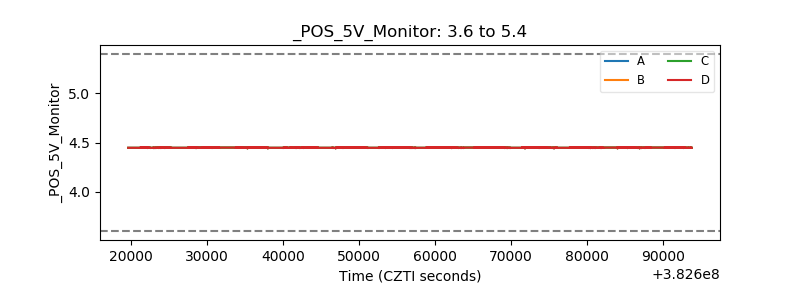 |
| _ROLL_ROT | 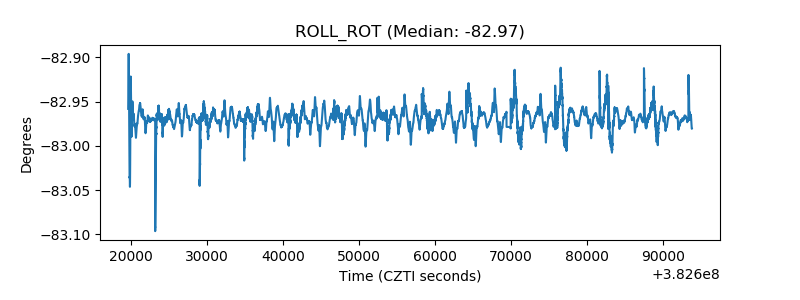 |
| _Roll_DEC | 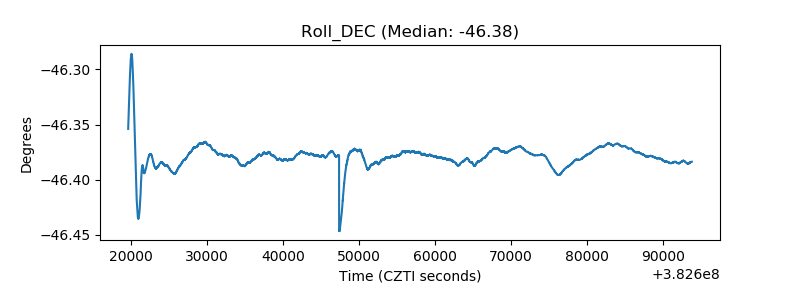 |
| _Roll_RA | 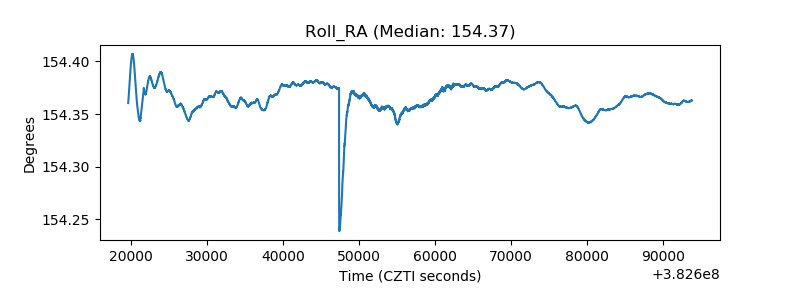 |
| Veto Counter | 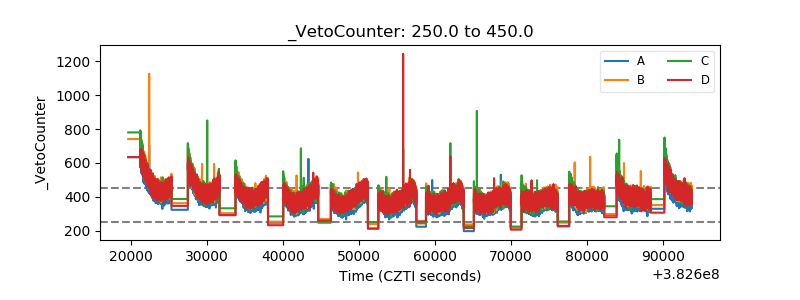 |