| Param | Original file | Final file |
|---|---|---|
| Filename | modeM0/AS1A05_103T05_9000004930_34522cztM0_level2.evt | modeM0/AS1A05_103T05_9000004930_34522cztM0_level2_quad_clean.evt |
| Size (bytes) | 2,977,712,640 | 350,778,240 |
| Size | 2.8 GB | 334.5 MB |
| Events in quadrant A | 13,679,485 | 2,284,524 |
| Events in quadrant B | 20,560,940 | 2,251,756 |
| Events in quadrant C | 15,697,185 | 2,273,241 |
| Events in quadrant D | 38,328,063 | 1,853,811 |
| Mode M9 | |||
|---|---|---|---|
| Quadrant | BADHDUFLAG | Total packets | Discarded packets |
| A | 0 | 106 | 0 |
| B | 0 | 106 | 0 |
| C | 0 | 106 | 0 |
| D | 0 | 107 | 0 |
| Mode M0 | |||
|---|---|---|---|
| Quadrant | BADHDUFLAG | Total packets | Discarded packets |
| A | 0 | 58776 | 8 |
| B | 0 | 79651 | 7 |
| C | 0 | 63193 | 7 |
| D | 0 | 133767 | 7 |
| Mode SS | |||
|---|---|---|---|
| Quadrant | BADHDUFLAG | Total packets | Discarded packets |
| A | 0 | 580 | 0 |
| B | 0 | 580 | 0 |
| C | 0 | 580 | 0 |
| D | 0 | 580 | 0 |
| Quadrant | Total seconds | Saturated seconds | Saturation percentage |
|---|---|---|---|
| A | 28507 | 72 | 0.252570% |
| B | 28507 | 1774 | 6.223033% |
| C | 28507 | 135 | 0.473568% |
| D | 28507 | 7568 | 26.547865% |
Noise dominated data is calculated using 1-second bins in cleaned event files. If a bin has >2000 counts, and if more than 50% of those come from <1% of pixels, then it is considered to be noise-dominated and hence unusable.
| Quadrant | # 1 sec bins | Bins with >0 counts | Bins with >2000 counts | High rate bins dominated by noise | Noise dominated (total time) | Noise dominated (detector-on time) | Marked lightcurve |
|---|---|---|---|---|---|---|---|
| A | 38454 | 28513 | 28 | 28 | 0.07% | 0.10% | 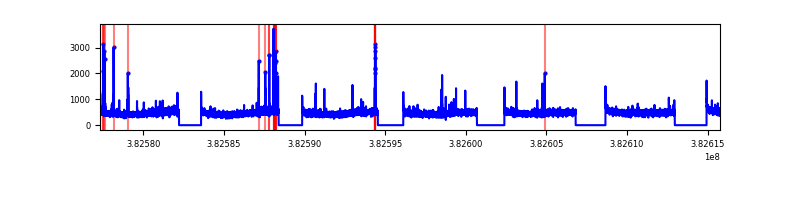 |
| B | 38454 | 28513 | 1192 | 1192 | 3.10% | 4.18% | 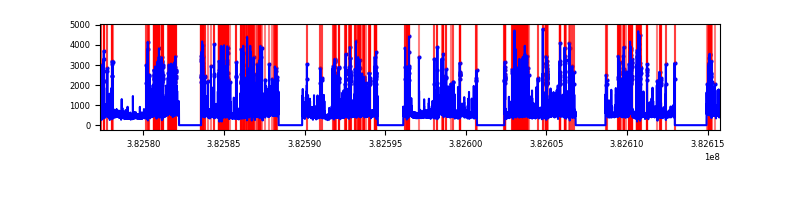 |
| C | 38454 | 28513 | 100 | 100 | 0.26% | 0.35% | 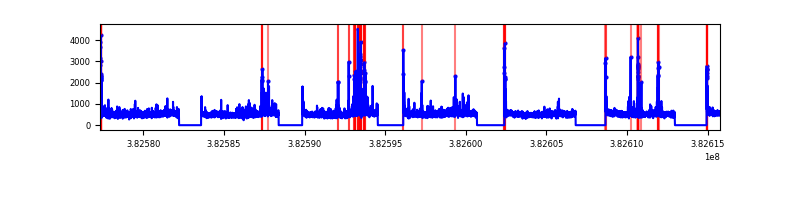 |
| D | 38454 | 28513 | 6814 | 6814 | 17.72% | 23.90% | 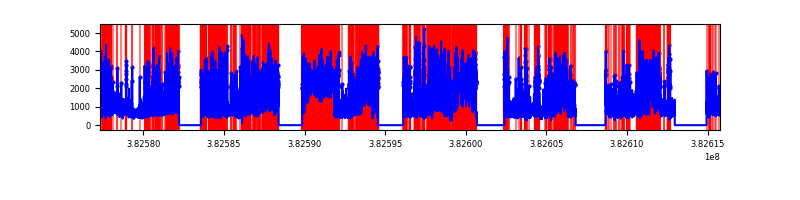 |
Top three noisy pixels from each quadrant. If the there are fewer than three noisy pixels in the level2.evt file, extra rows are filled as -1
| Pixel properties | Quadrant properties | ||||||
|---|---|---|---|---|---|---|---|
| Quadrant | DetID | PixID | Counts | Sigma | Mean | Median | Sigma |
| A | 9 | 143 | 193324 | 282.58 | 3405 | 3334 | 672.3 |
| A | 10 | 83 | 157907 | 229.9 | 3405 | 3334 | 672.3 |
| A | 13 | 6 | 95363 | 136.88 | 3405 | 3334 | 672.3 |
| B | 5 | 172 | 4271951 | 6935.04 | 3293 | 3207 | 615.5 |
| B | 0 | 229 | 1331537 | 2158.02 | 3293 | 3207 | 615.5 |
| B | 0 | 189 | 499868 | 806.88 | 3293 | 3207 | 615.5 |
| C | 15 | 214 | 1233114 | 1619.91 | 3323 | 3354 | 759.2 |
| C | 15 | 159 | 618187 | 809.89 | 3323 | 3354 | 759.2 |
| C | 14 | 67 | 492104 | 643.81 | 3323 | 3354 | 759.2 |
| D | 7 | 38 | 5625489 | 7532.9 | 2873 | 2820 | 746.4 |
| D | 13 | 174 | 4795573 | 6421.03 | 2873 | 2820 | 746.4 |
| D | 7 | 80 | 4177268 | 5592.66 | 2873 | 2820 | 746.4 |
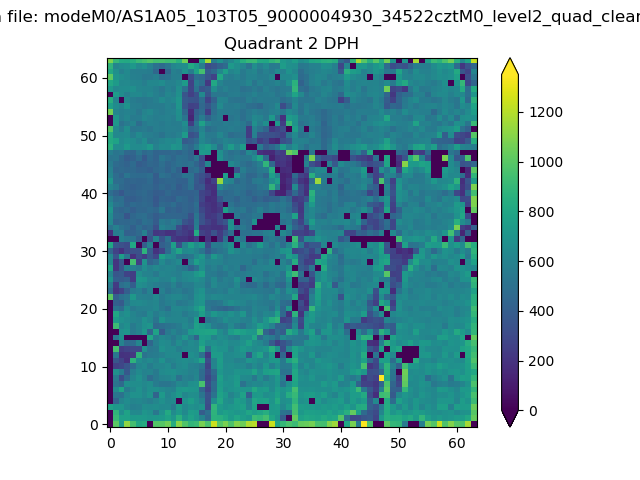
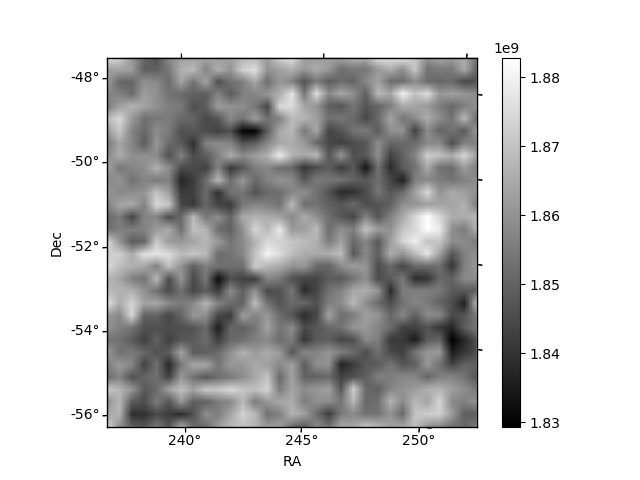
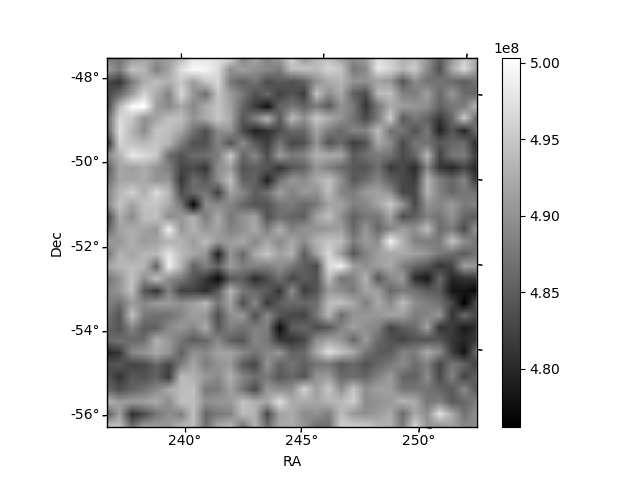
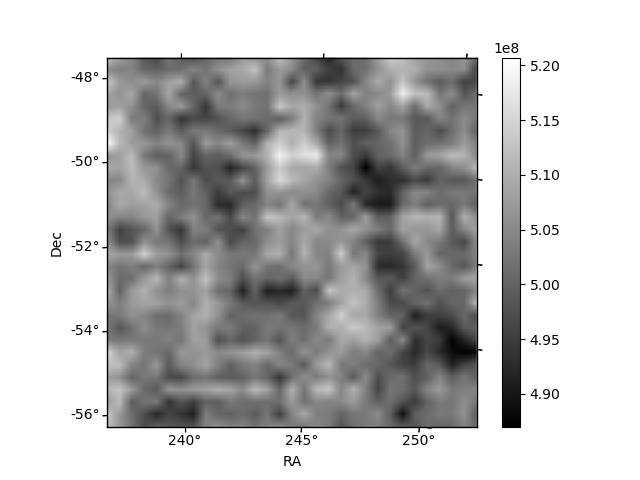
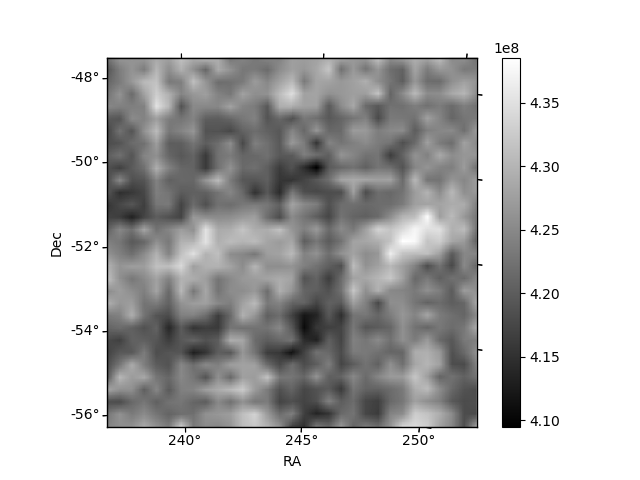
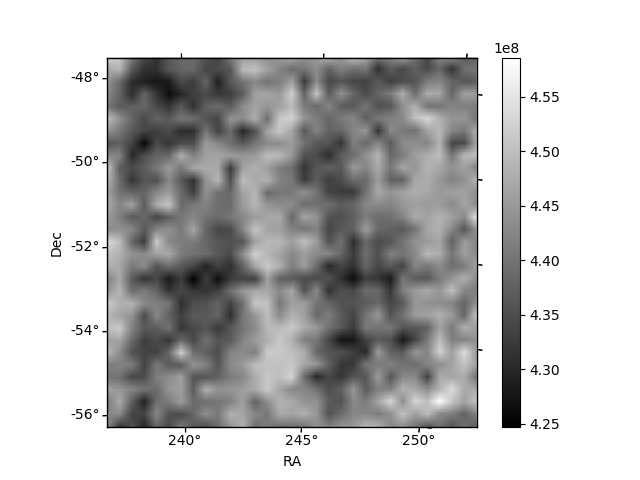
Histogram calculated using DETX and DETY for each event in the final _common_clean file
| Quadrant A | 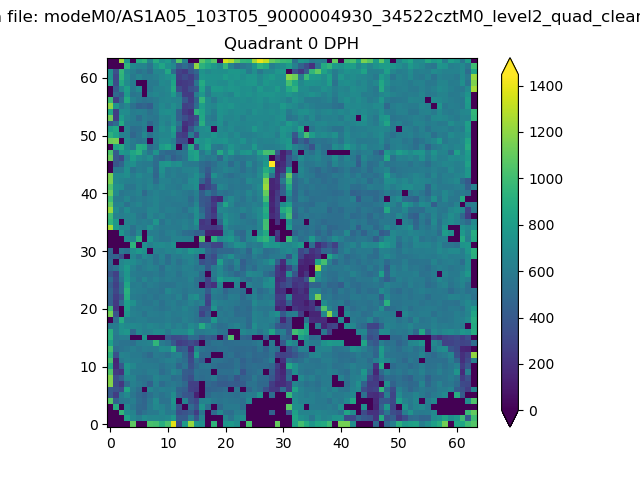 |
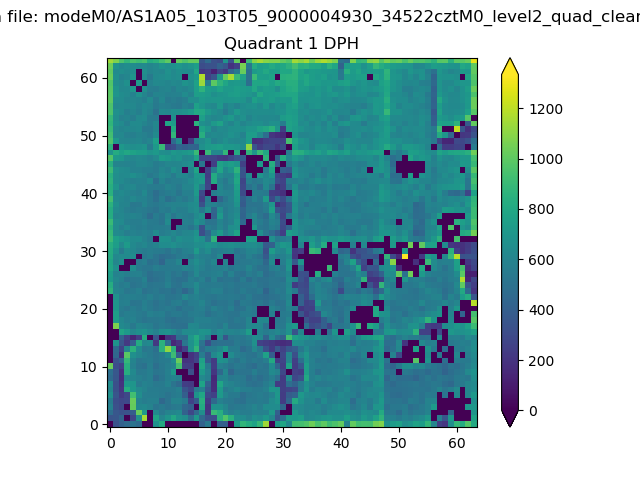 |
Quadrant B |
|---|---|---|---|
| Quadrant D | 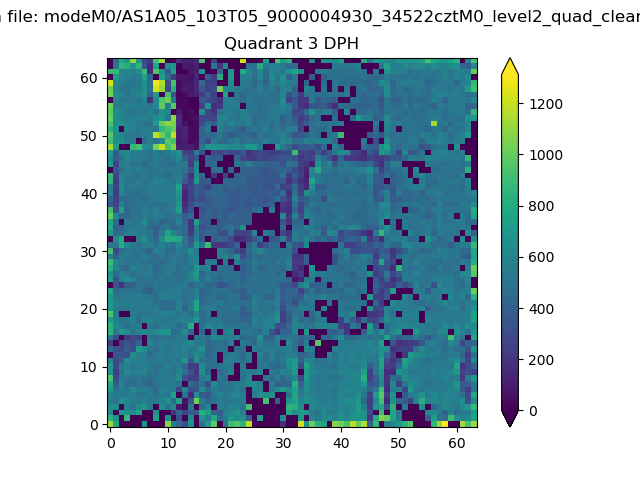 |
 |
Quadrant C |
| Plot type | Count rate plots | Images |
|---|---|---|
| Comparison with Poisson distribution Blue bars denote a histogram of data divided into 1 sec bins. Red curve is a Poisson curve with rate = median count rate of data. |
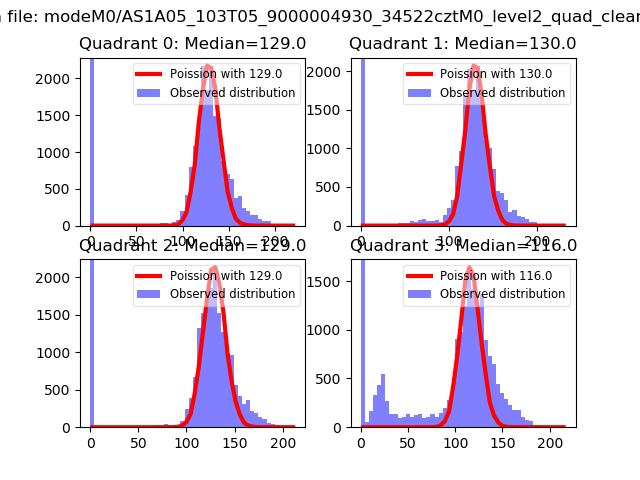 |
 |
| Quadrant-wise count rates Data is divided into 100 sec bins |
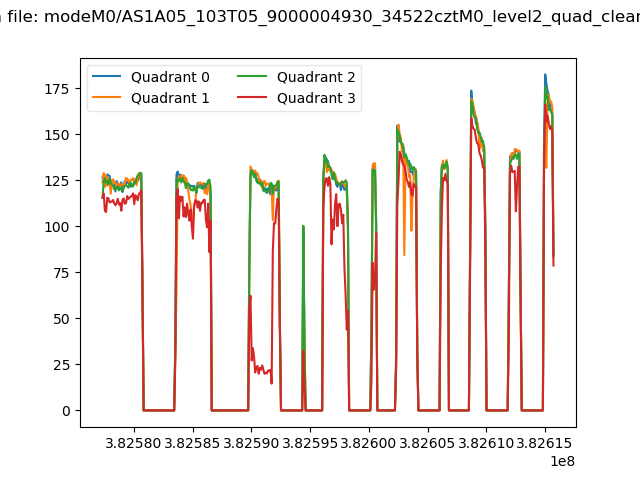 |
|
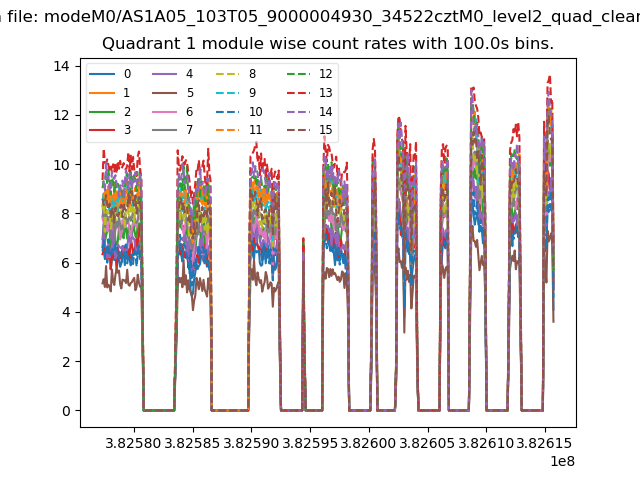
| Module-wise count rates for Quadrant A Data is divided into 100 sec bins |
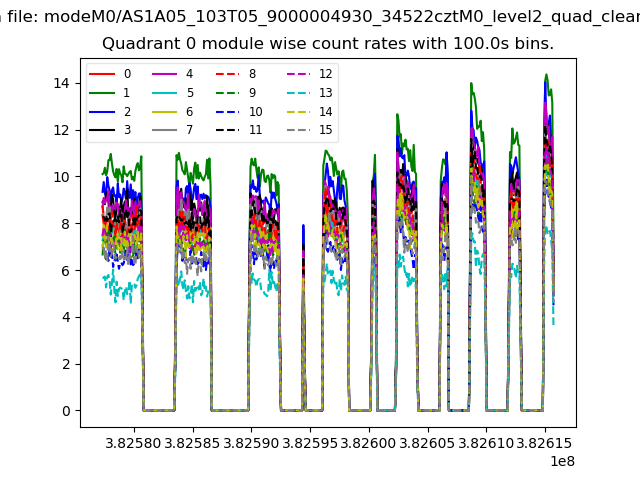 |
 |
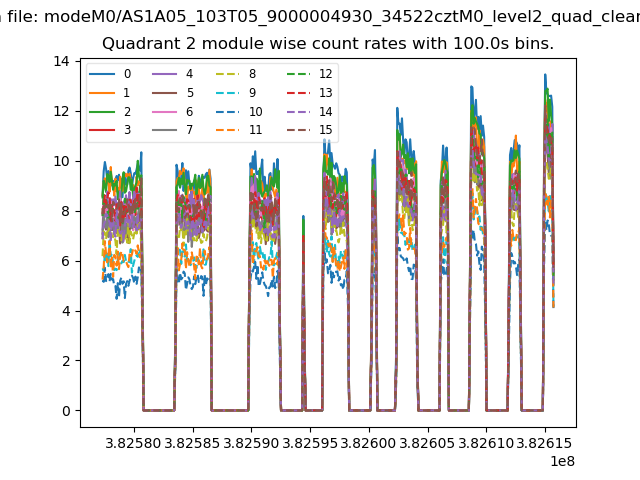
| Module-wise count rates for Quadrant B Data is divided into 100 sec bins |
 |
 |
| Module-wise count rates for Quadrant C Data is divided into 100 sec bins |
 |
 |
| Module-wise count rates for Quadrant D Data is divided into 100 sec bins |
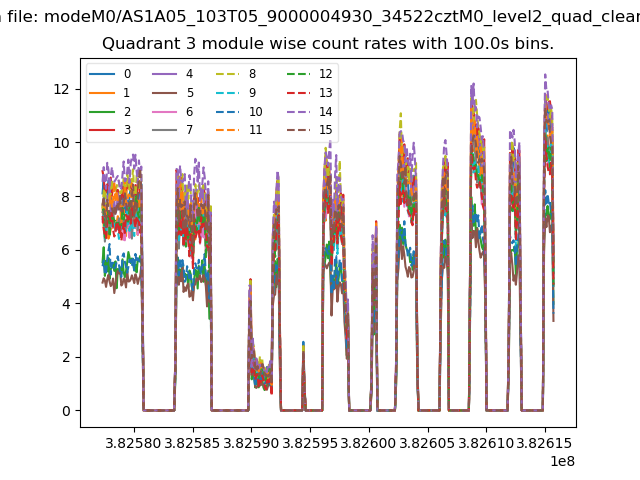 |
 |
| Parameter | Plot |
|---|---|
| CZT HV Monitor | 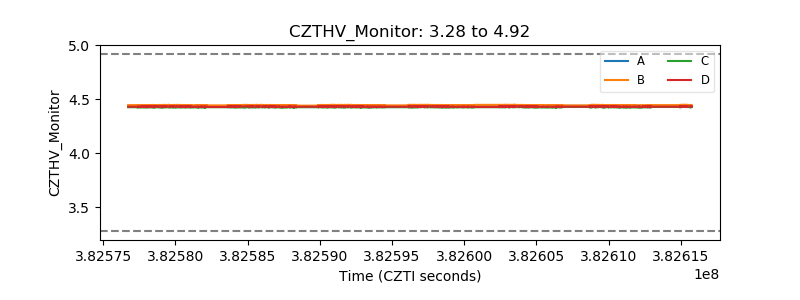 |
| D_VDD | 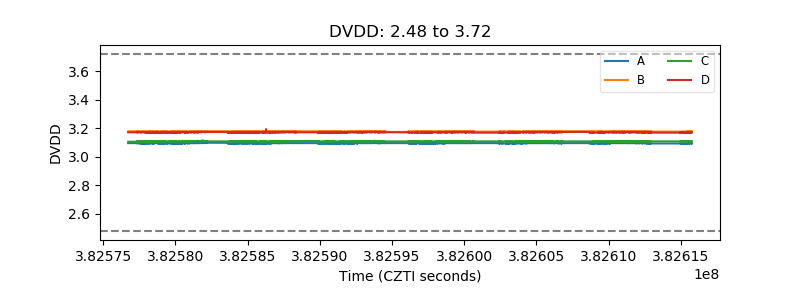 |
| Temperature 1 | 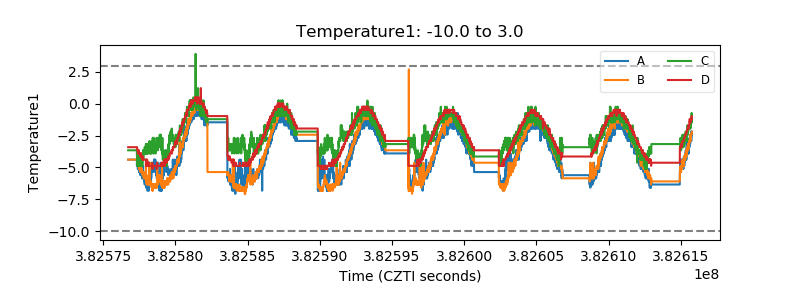 |
| Veto HV Monitor | 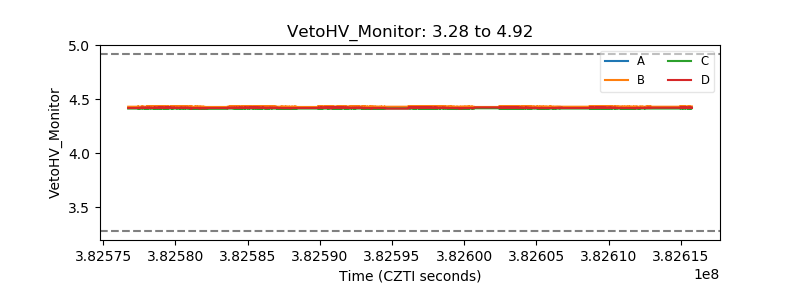 |
| Veto LLD | 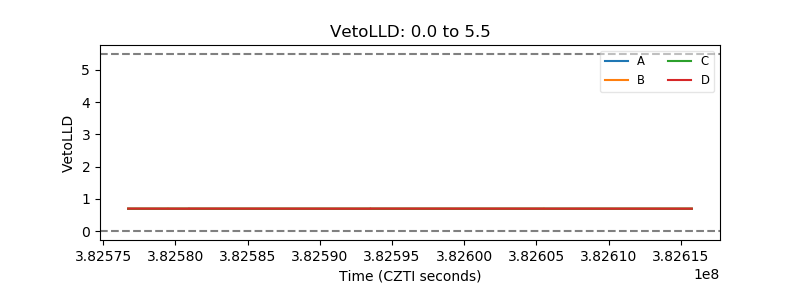 |
| Alpha Counter | 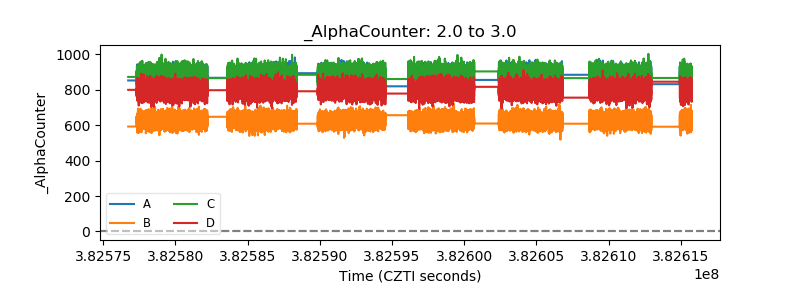 |
| _CPM_Rate | 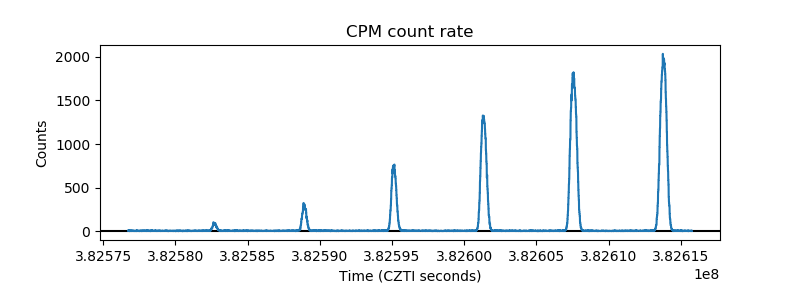 |
| CZT Counter | 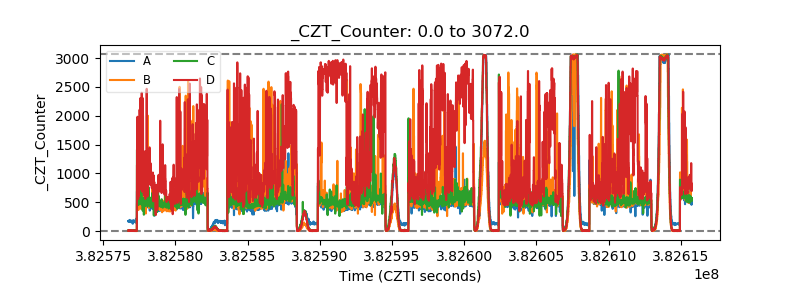 |
| +2.5 Volts monitor | 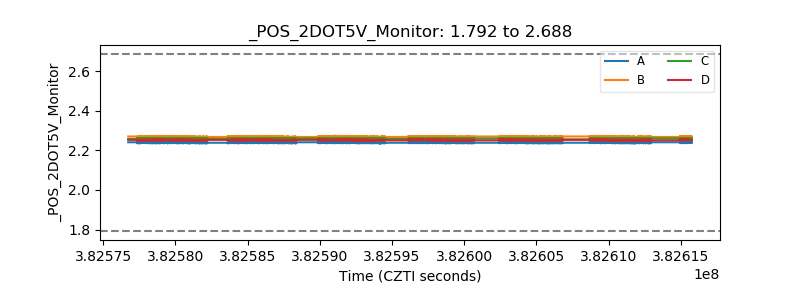 |
| +5 Volts monitor | 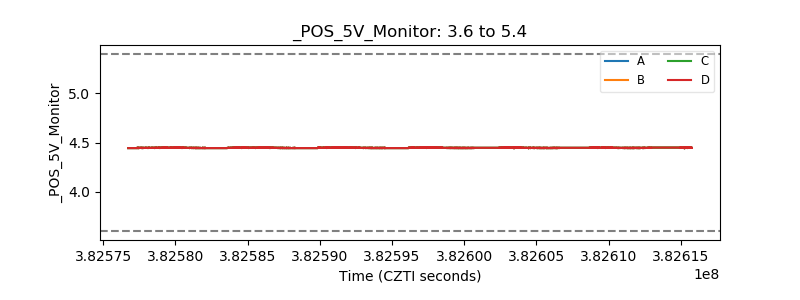 |
| _ROLL_ROT | 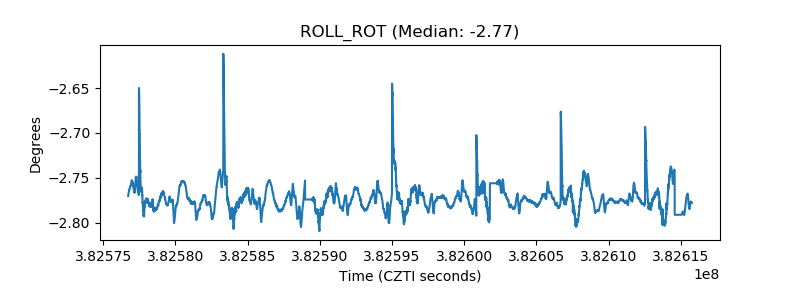 |
| _Roll_DEC | 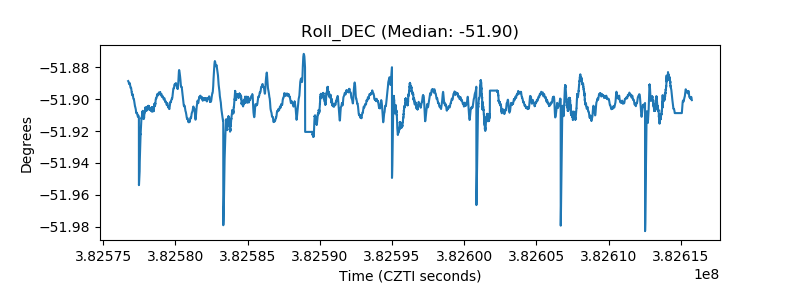 |
| _Roll_RA |  |
| Veto Counter | 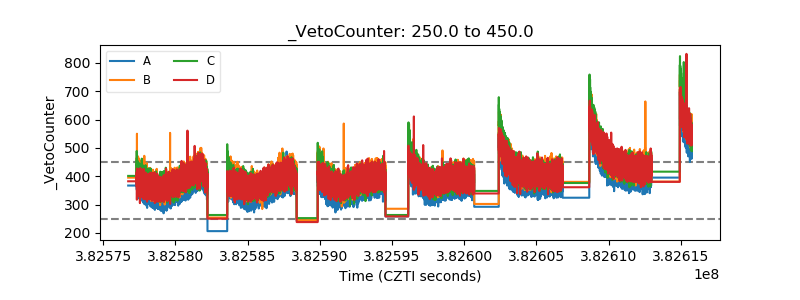 |