| Param | Original file | Final file |
|---|---|---|
| Filename | modeM0/AS1A05_103T05_9000004930_34521cztM0_level2.evt | modeM0/AS1A05_103T05_9000004930_34521cztM0_level2_quad_clean.evt |
| Size (bytes) | 481,861,440 | 74,632,320 |
| Size | 459.5 MB | 71.2 MB |
| Events in quadrant A | 2,488,534 | 485,318 |
| Events in quadrant B | 3,984,172 | 473,297 |
| Events in quadrant C | 2,806,367 | 479,054 |
| Events in quadrant D | 4,953,873 | 450,175 |
| Mode M9 | |||
|---|---|---|---|
| Quadrant | BADHDUFLAG | Total packets | Discarded packets |
| A | 0 | 22 | 0 |
| B | 0 | 21 | 0 |
| C | 0 | 21 | 0 |
| D | 0 | 21 | 0 |
| Mode M0 | |||
|---|---|---|---|
| Quadrant | BADHDUFLAG | Total packets | Discarded packets |
| A | 0 | 10899 | 1 |
| B | 0 | 15463 | 1 |
| C | 0 | 11517 | 1 |
| D | 0 | 18517 | 1 |
| Mode SS | |||
|---|---|---|---|
| Quadrant | BADHDUFLAG | Total packets | Discarded packets |
| A | 0 | 108 | 0 |
| B | 0 | 108 | 0 |
| C | 0 | 108 | 0 |
| D | 0 | 108 | 0 |
| Quadrant | Total seconds | Saturated seconds | Saturation percentage |
|---|---|---|---|
| A | 5320 | 9 | 0.169173% |
| B | 5320 | 476 | 8.947368% |
| C | 5320 | 13 | 0.244361% |
| D | 5320 | 358 | 6.729323% |
Noise dominated data is calculated using 1-second bins in cleaned event files. If a bin has >2000 counts, and if more than 50% of those come from <1% of pixels, then it is considered to be noise-dominated and hence unusable.
| Quadrant | # 1 sec bins | Bins with >0 counts | Bins with >2000 counts | High rate bins dominated by noise | Noise dominated (total time) | Noise dominated (detector-on time) | Marked lightcurve |
|---|---|---|---|---|---|---|---|
| A | 6663 | 5321 | 2 | 2 | 0.03% | 0.04% | 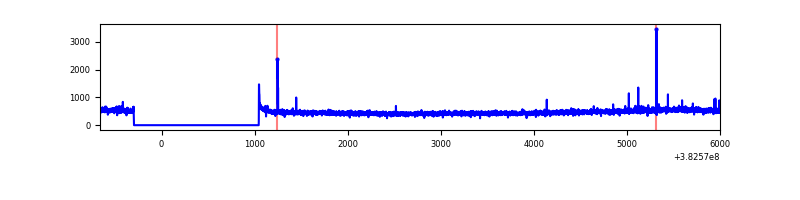 |
| B | 6663 | 5321 | 285 | 285 | 4.28% | 5.36% | 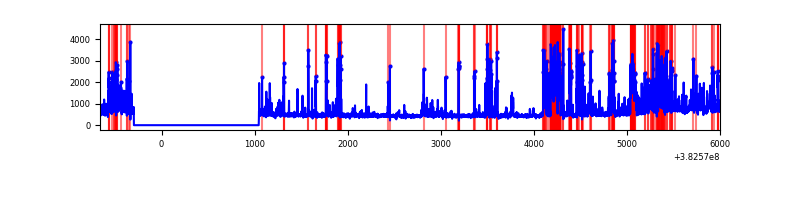 |
| C | 6663 | 5321 | 9 | 9 | 0.14% | 0.17% | 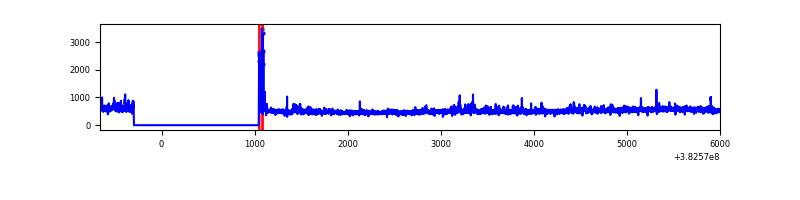 |
| D | 6663 | 5321 | 292 | 292 | 4.38% | 5.49% | 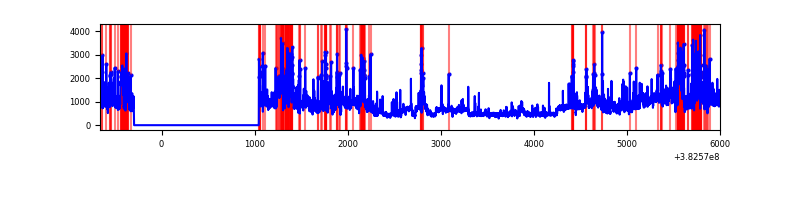 |
Top three noisy pixels from each quadrant. If the there are fewer than three noisy pixels in the level2.evt file, extra rows are filled as -1
| Pixel properties | Quadrant properties | ||||||
|---|---|---|---|---|---|---|---|
| Quadrant | DetID | PixID | Counts | Sigma | Mean | Median | Sigma |
| A | 10 | 83 | 25299 | 195.72 | 625 | 613 | 126.1 |
| A | 9 | 143 | 19207 | 147.42 | 625 | 613 | 126.1 |
| A | 13 | 6 | 10747 | 80.35 | 625 | 613 | 126.1 |
| B | 5 | 172 | 1115970 | 9591.31 | 601 | 586 | 116.3 |
| B | 0 | 190 | 148141 | 1268.84 | 601 | 586 | 116.3 |
| B | 0 | 229 | 106502 | 910.78 | 601 | 586 | 116.3 |
| C | 15 | 214 | 221132 | 1558.09 | 610 | 615 | 141.5 |
| C | 14 | 67 | 143215 | 1007.56 | 610 | 615 | 141.5 |
| C | 0 | 10 | 44110 | 307.32 | 610 | 615 | 141.5 |
| D | 8 | 195 | 752974 | 4698.86 | 596 | 581 | 160.1 |
| D | 12 | 17 | 351539 | 2191.81 | 596 | 581 | 160.1 |
| D | 10 | 203 | 341187 | 2127.16 | 596 | 581 | 160.1 |
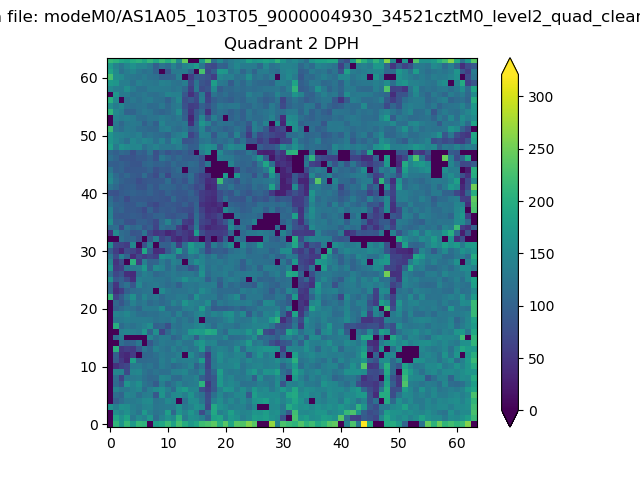
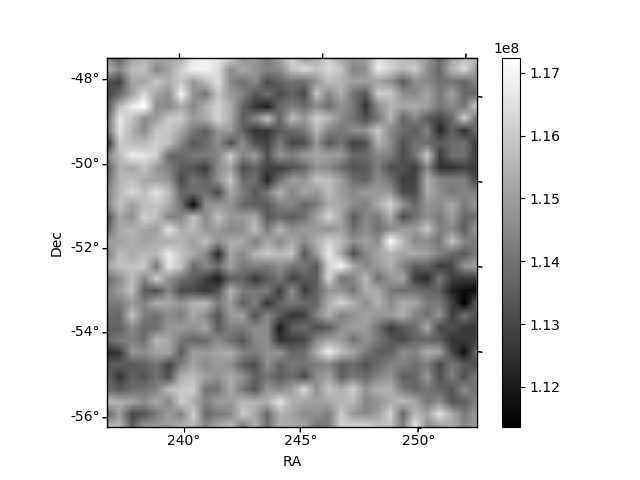
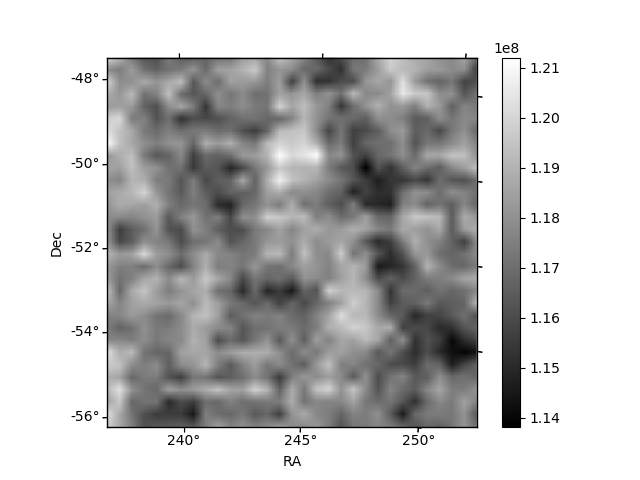
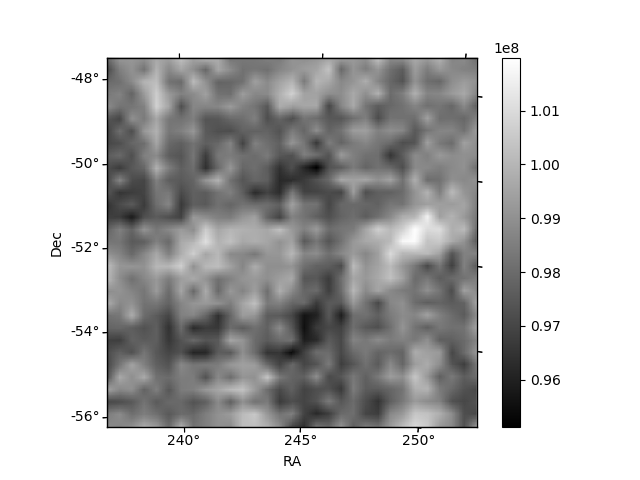
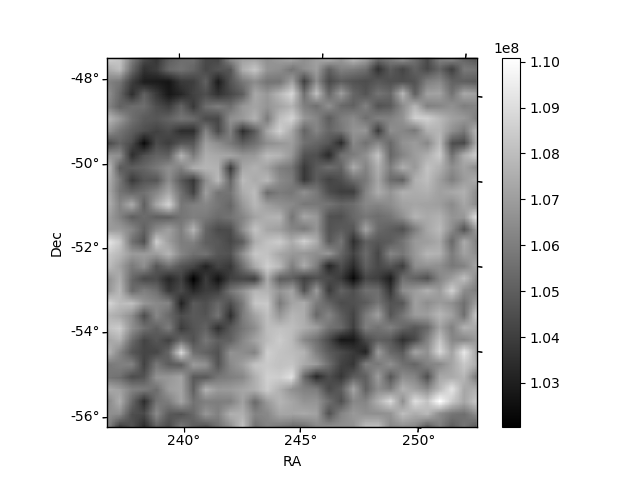
Histogram calculated using DETX and DETY for each event in the final _common_clean file
| Quadrant A | 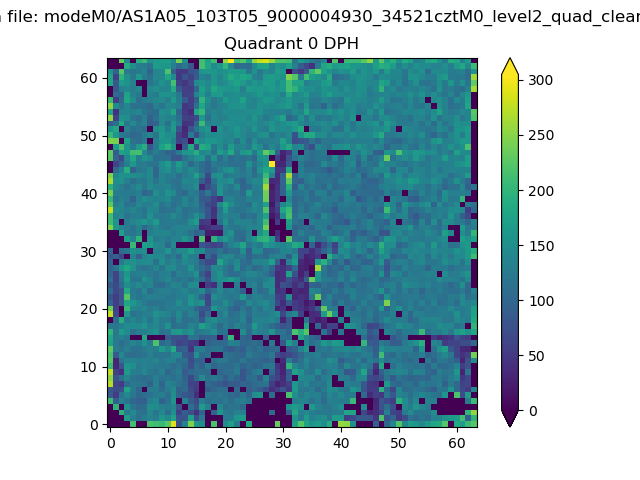 |
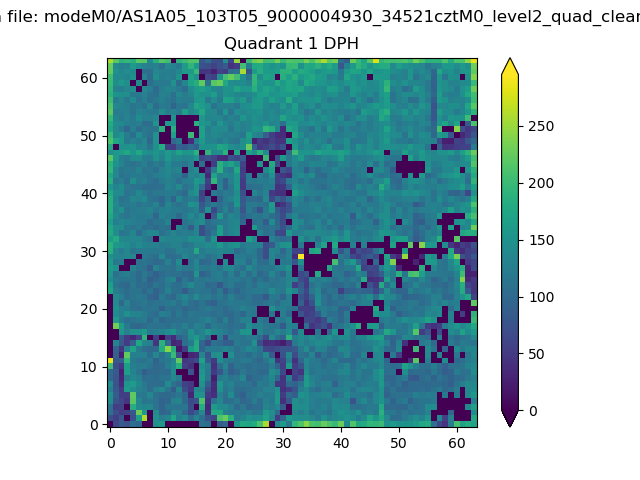 |
Quadrant B |
|---|---|---|---|
| Quadrant D | 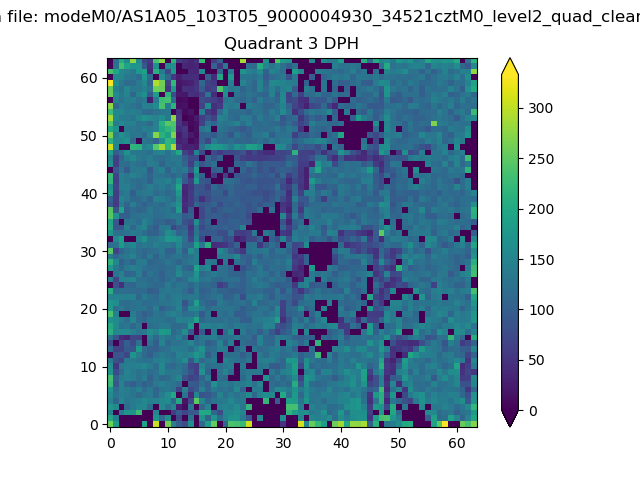 |
 |
Quadrant C |
| Plot type | Count rate plots | Images |
|---|---|---|
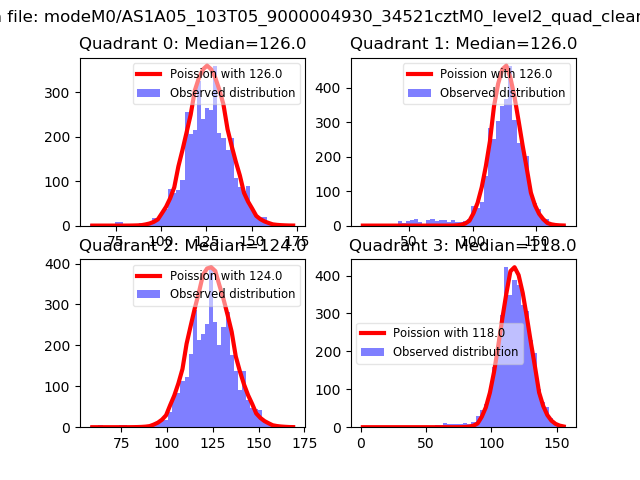
| Comparison with Poisson distribution Blue bars denote a histogram of data divided into 1 sec bins. Red curve is a Poisson curve with rate = median count rate of data. |
 |
 |
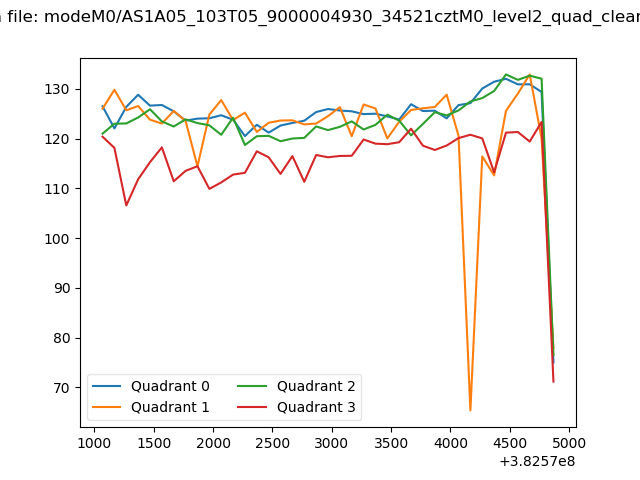
| Quadrant-wise count rates Data is divided into 100 sec bins |
 |
|
| Module-wise count rates for Quadrant A Data is divided into 100 sec bins |
 |
 |
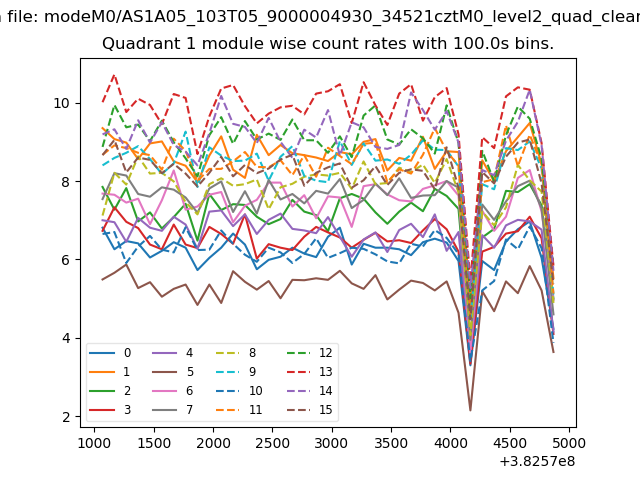
| Module-wise count rates for Quadrant B Data is divided into 100 sec bins |
 |
 |
| Module-wise count rates for Quadrant C Data is divided into 100 sec bins |
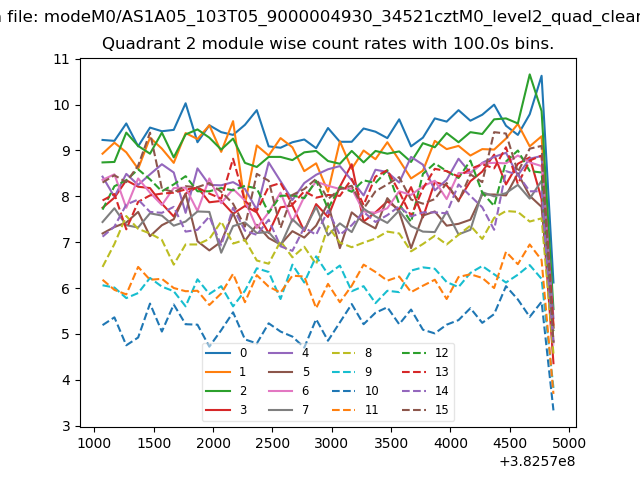 |
 |
| Module-wise count rates for Quadrant D Data is divided into 100 sec bins |
 |
 |
| Parameter | Plot |
|---|---|
| CZT HV Monitor | 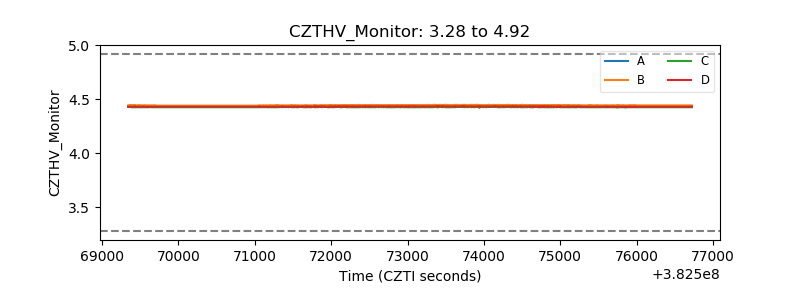 |
| D_VDD | 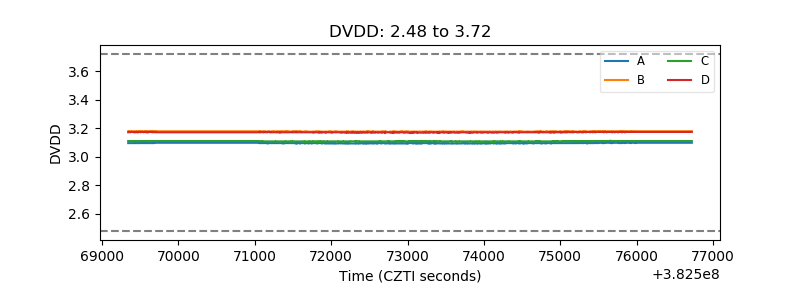 |
| Temperature 1 | 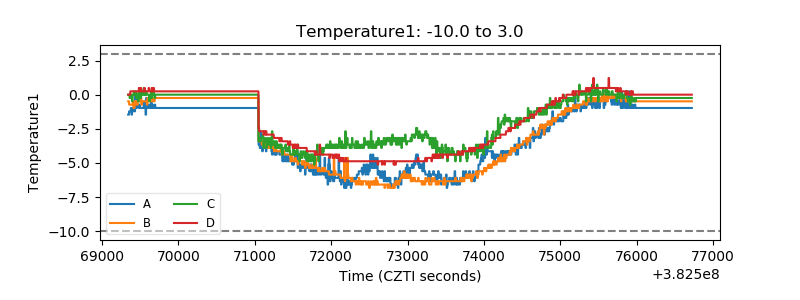 |
| Veto HV Monitor | 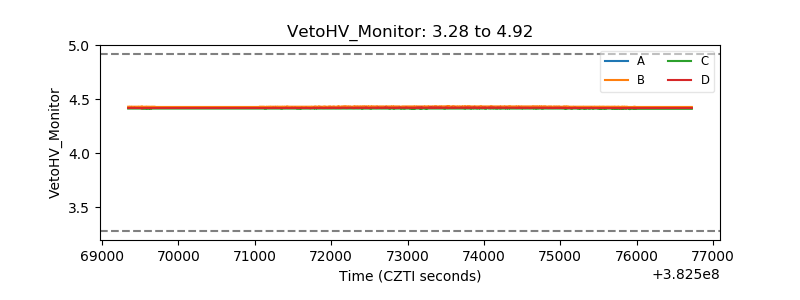 |
| Veto LLD | 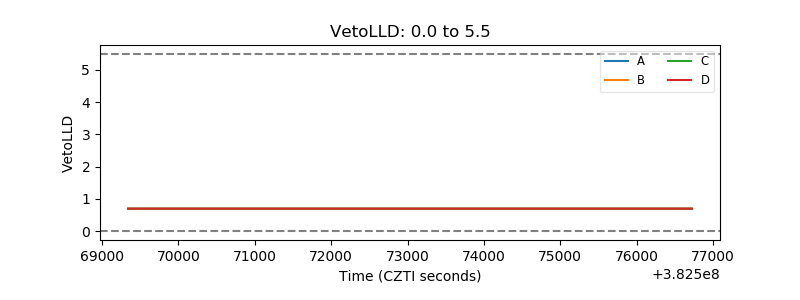 |
| Alpha Counter | 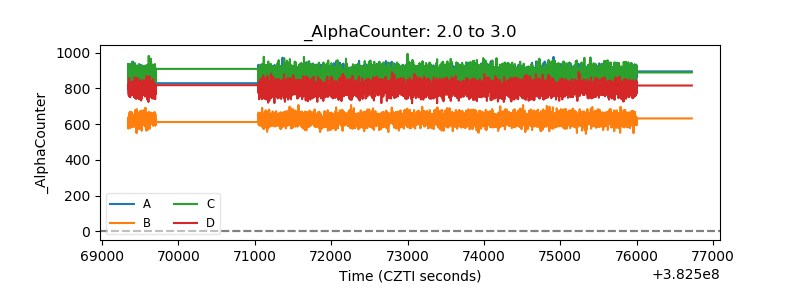 |
| _CPM_Rate | 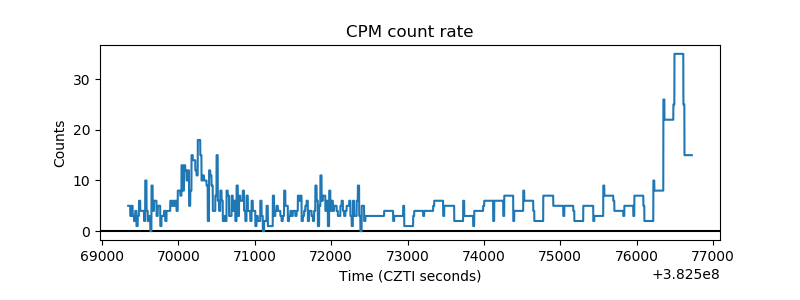 |
| CZT Counter | 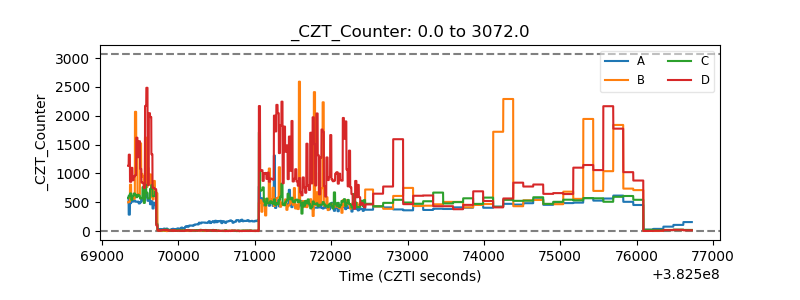 |
| +2.5 Volts monitor |  |
| +5 Volts monitor | 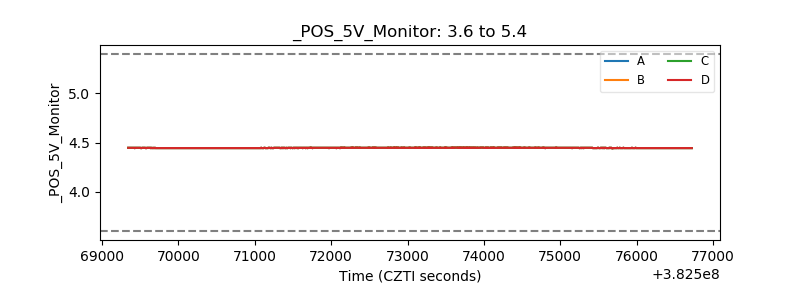 |
| _ROLL_ROT |  |
| _Roll_DEC | 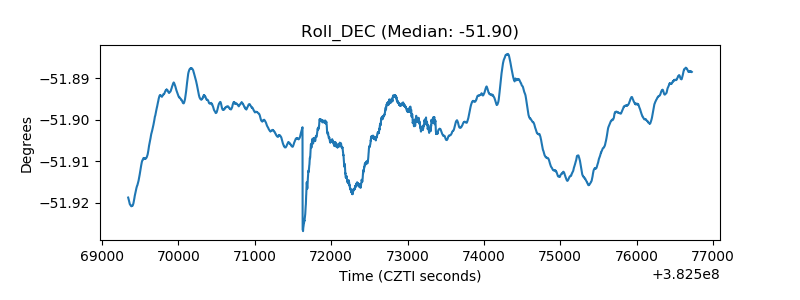 |
| _Roll_RA | 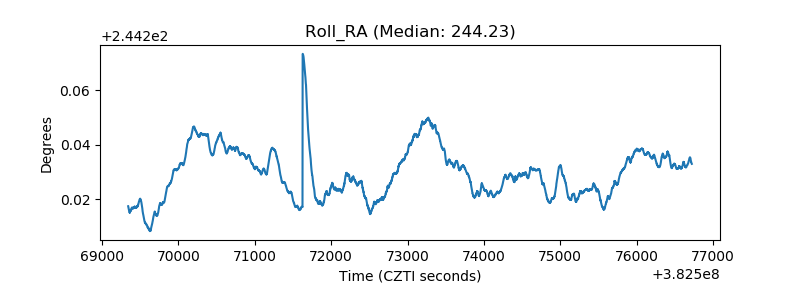 |
| Veto Counter | 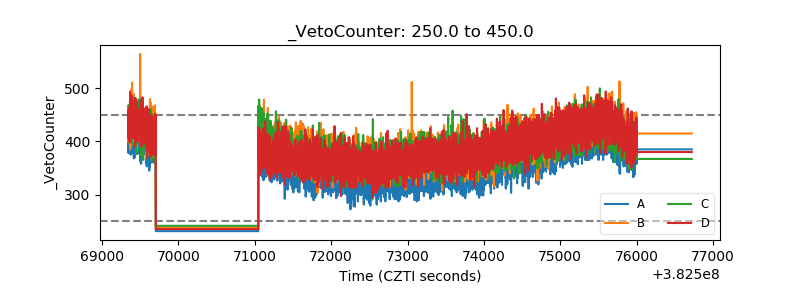 |