| Param | Original file | Final file |
|---|---|---|
| Filename | modeM0/AS1A05_103T05_9000004930_34512cztM0_level2.evt | modeM0/AS1A05_103T05_9000004930_34512cztM0_level2_quad_clean.evt |
| Size (bytes) | 173,471,040 | 24,488,640 |
| Size | 165.4 MB | 23.4 MB |
| Events in quadrant A | 1,015,939 | 151,940 |
| Events in quadrant B | 1,105,257 | 152,791 |
| Events in quadrant C | 1,185,380 | 149,589 |
| Events in quadrant D | 1,810,654 | 143,098 |
| Mode M9 | |||
|---|---|---|---|
| Quadrant | BADHDUFLAG | Total packets | Discarded packets |
| A | 0 | 18 | 0 |
| B | 0 | 18 | 0 |
| C | 0 | 18 | 0 |
| D | 0 | 18 | 0 |
| Mode M0 | |||
|---|---|---|---|
| Quadrant | BADHDUFLAG | Total packets | Discarded packets |
| A | 0 | 4207 | 2 |
| B | 0 | 4510 | 1 |
| C | 0 | 4710 | 1 |
| D | 0 | 6715 | 1 |
| Mode SS | |||
|---|---|---|---|
| Quadrant | BADHDUFLAG | Total packets | Discarded packets |
| A | 0 | 42 | 0 |
| B | 0 | 42 | 0 |
| C | 0 | 42 | 0 |
| D | 0 | 42 | 0 |
| Quadrant | Total seconds | Saturated seconds | Saturation percentage |
|---|---|---|---|
| A | 1972 | 17 | 0.862069% |
| B | 1972 | 13 | 0.659229% |
| C | 1972 | 30 | 1.521298% |
| D | 1972 | 281 | 14.249493% |
Noise dominated data is calculated using 1-second bins in cleaned event files. If a bin has >2000 counts, and if more than 50% of those come from <1% of pixels, then it is considered to be noise-dominated and hence unusable.
| Quadrant | # 1 sec bins | Bins with >0 counts | Bins with >2000 counts | High rate bins dominated by noise | Noise dominated (total time) | Noise dominated (detector-on time) | Marked lightcurve |
|---|---|---|---|---|---|---|---|
| A | 3825 | 1973 | 13 | 13 | 0.34% | 0.66% | 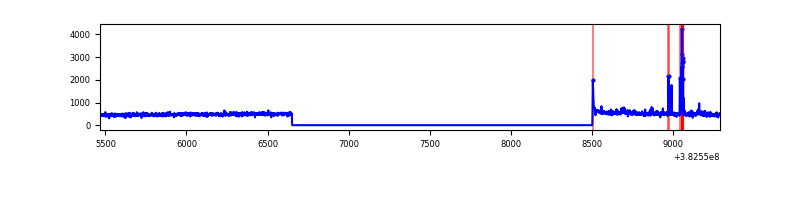 |
| B | 3825 | 1973 | 5 | 5 | 0.13% | 0.25% | 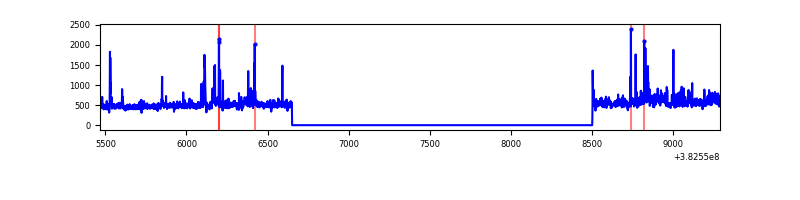 |
| C | 3825 | 1973 | 21 | 21 | 0.55% | 1.06% | 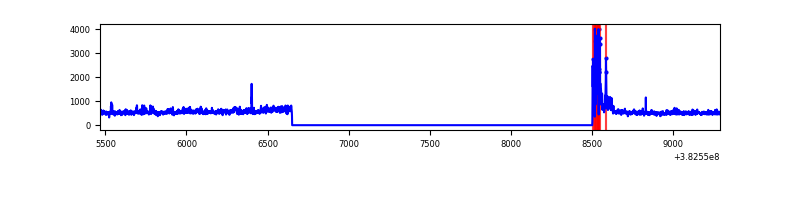 |
| D | 3825 | 1973 | 246 | 246 | 6.43% | 12.47% | 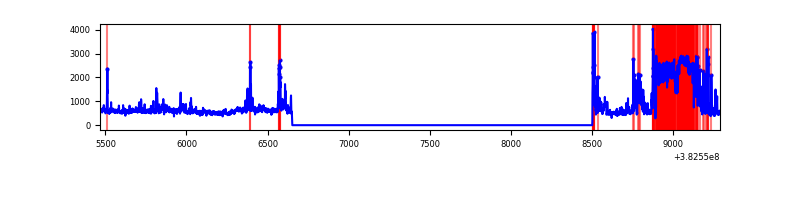 |
Top three noisy pixels from each quadrant. If the there are fewer than three noisy pixels in the level2.evt file, extra rows are filled as -1
| Pixel properties | Quadrant properties | ||||||
|---|---|---|---|---|---|---|---|
| Quadrant | DetID | PixID | Counts | Sigma | Mean | Median | Sigma |
| A | 3 | 15 | 32916 | 658.0 | 238 | 233 | 49.7 |
| A | 15 | 17 | 22722 | 452.77 | 238 | 233 | 49.7 |
| A | 10 | 83 | 19509 | 388.08 | 238 | 233 | 49.7 |
| B | 5 | 172 | 62701 | 1330.61 | 236 | 230 | 46.9 |
| B | 5 | 63 | 37681 | 797.69 | 236 | 230 | 46.9 |
| B | 0 | 190 | 35492 | 751.07 | 236 | 230 | 46.9 |
| C | 0 | 10 | 103317 | 1875.97 | 233 | 234 | 54.9 |
| C | 15 | 214 | 85402 | 1549.94 | 233 | 234 | 54.9 |
| C | 14 | 67 | 77082 | 1398.53 | 233 | 234 | 54.9 |
| D | 13 | 249 | 576095 | 10086.32 | 208 | 204 | 57.1 |
| D | 8 | 195 | 138245 | 2417.69 | 208 | 204 | 57.1 |
| D | 12 | 17 | 111894 | 1956.17 | 208 | 204 | 57.1 |
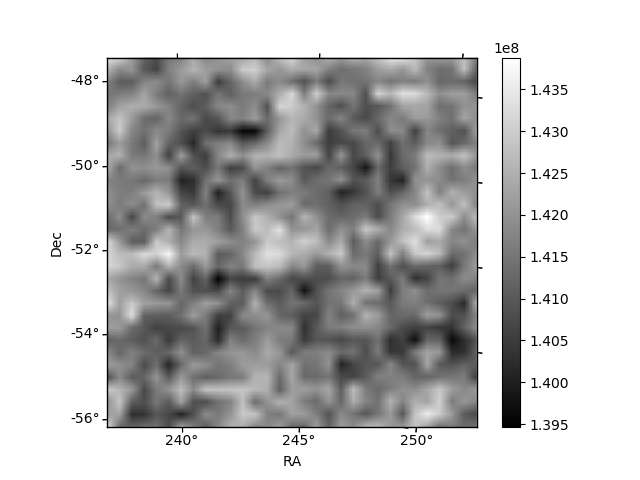
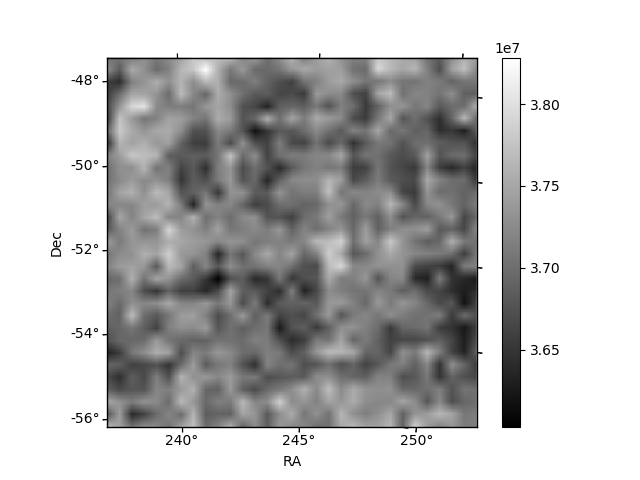
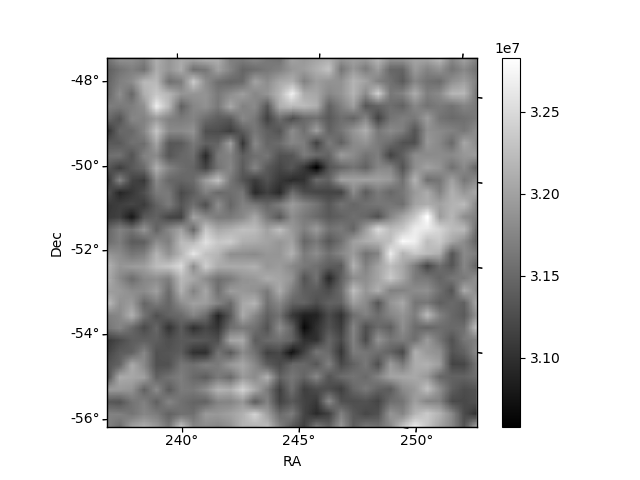
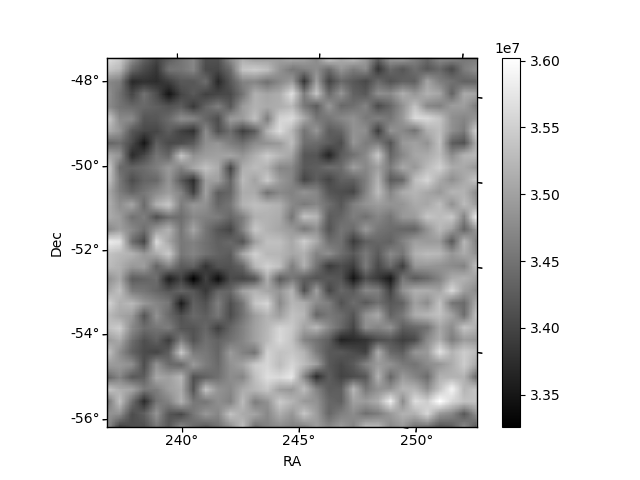
Histogram calculated using DETX and DETY for each event in the final _common_clean file
| Quadrant A | 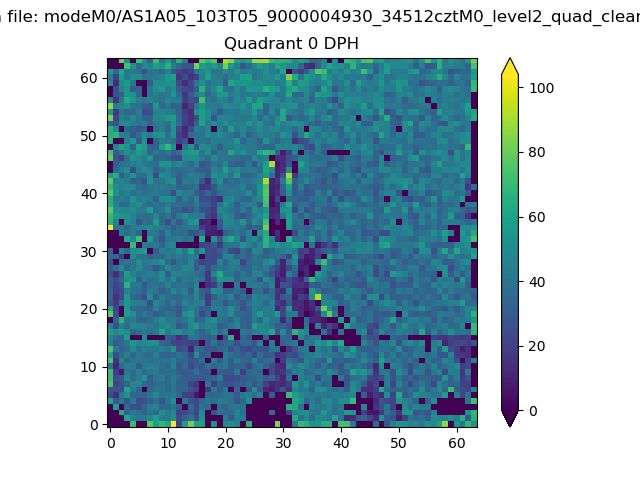 |
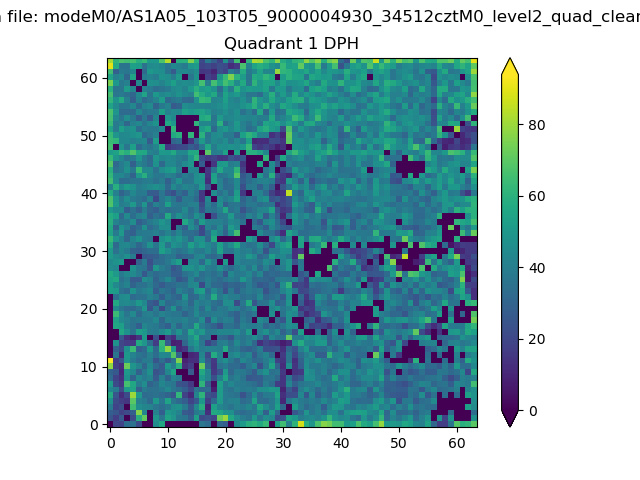 |
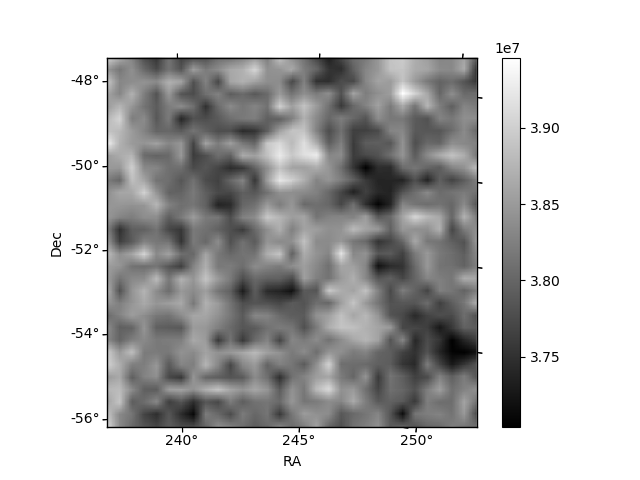
Quadrant B |
|---|---|---|---|
| Quadrant D | 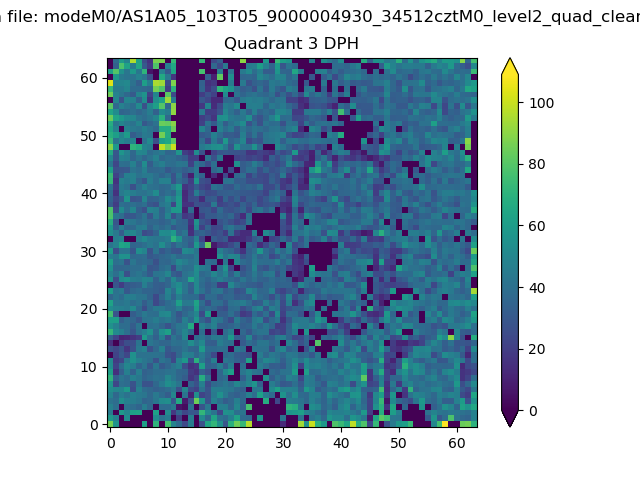 |
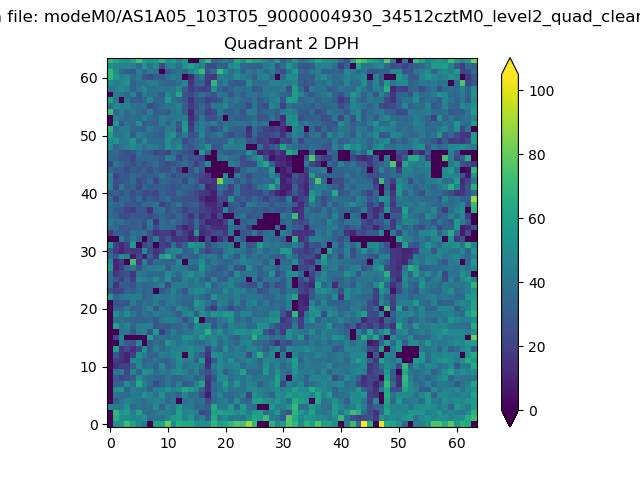 |
Quadrant C |
| Plot type | Count rate plots | Images |
|---|---|---|
| Comparison with Poisson distribution Blue bars denote a histogram of data divided into 1 sec bins. Red curve is a Poisson curve with rate = median count rate of data. |
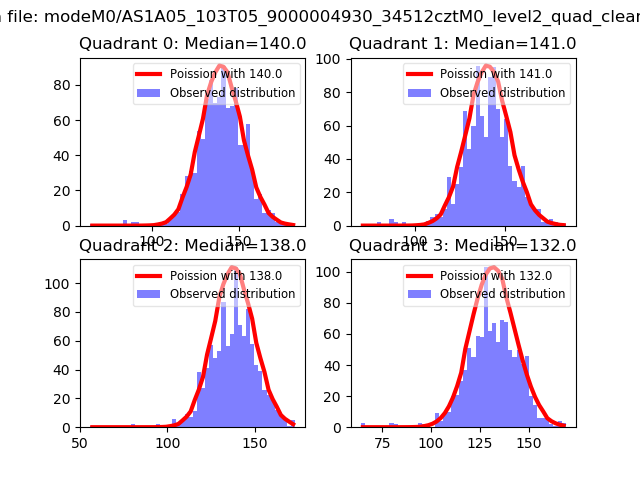 |
 |
| Quadrant-wise count rates Data is divided into 100 sec bins |
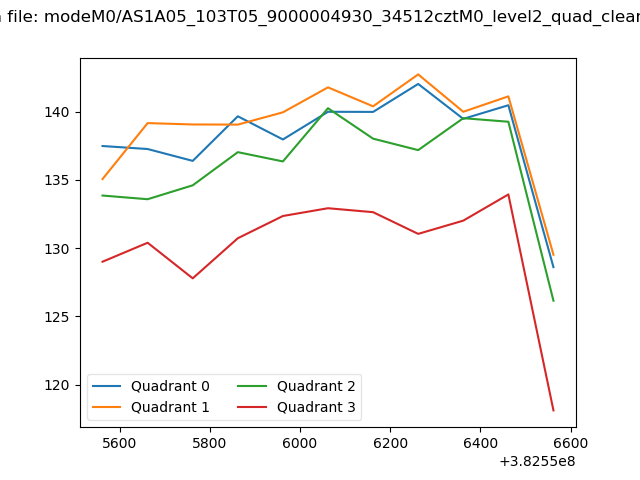 |
|
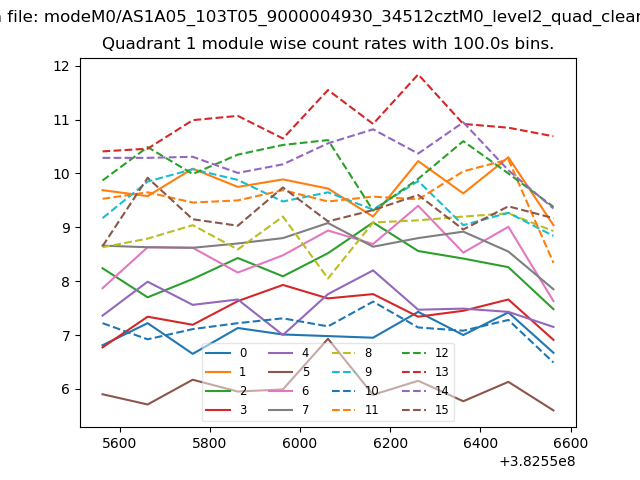
| Module-wise count rates for Quadrant A Data is divided into 100 sec bins |
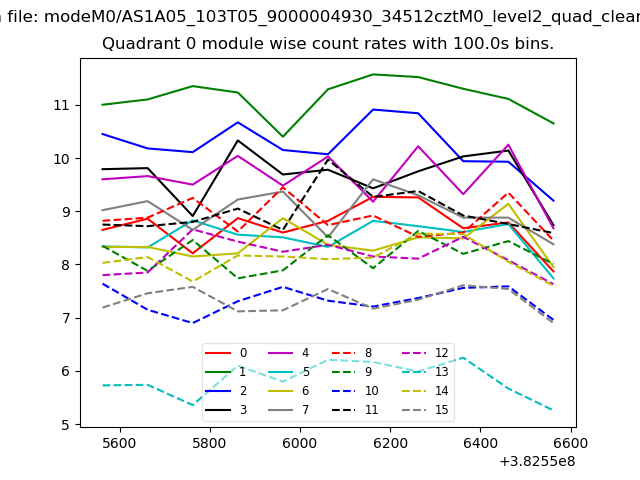 |
 |
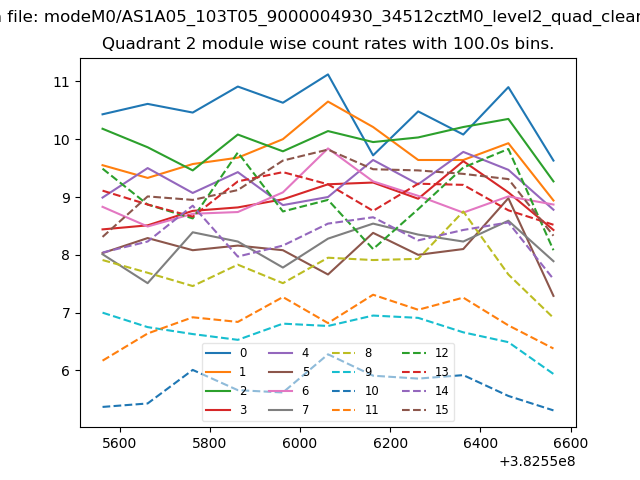
| Module-wise count rates for Quadrant B Data is divided into 100 sec bins |
 |
 |
| Module-wise count rates for Quadrant C Data is divided into 100 sec bins |
 |
 |
| Module-wise count rates for Quadrant D Data is divided into 100 sec bins |
 |
 |
| Parameter | Plot |
|---|---|
| CZT HV Monitor | 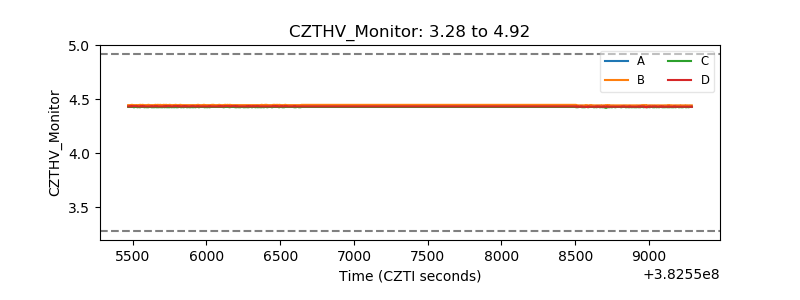 |
| D_VDD | 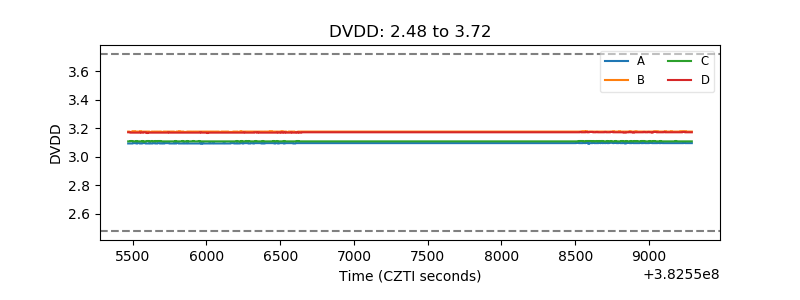 |
| Temperature 1 | 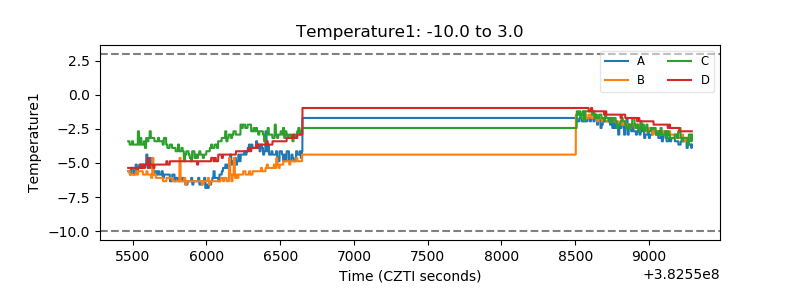 |
| Veto HV Monitor |  |
| Veto LLD | 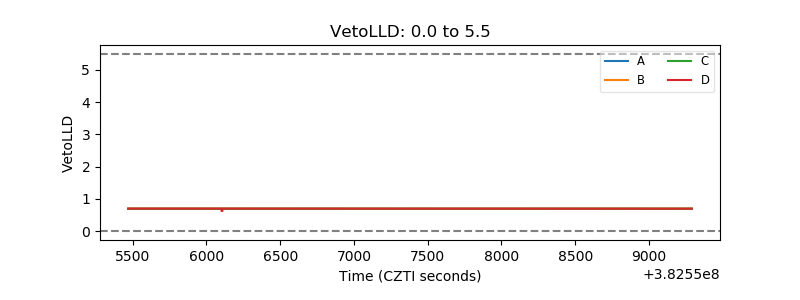 |
| Alpha Counter | 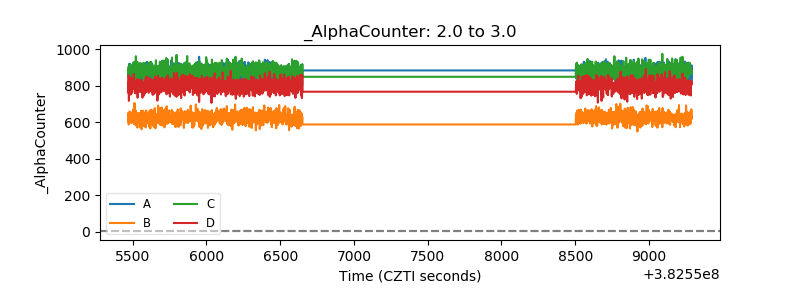 |
| _CPM_Rate | 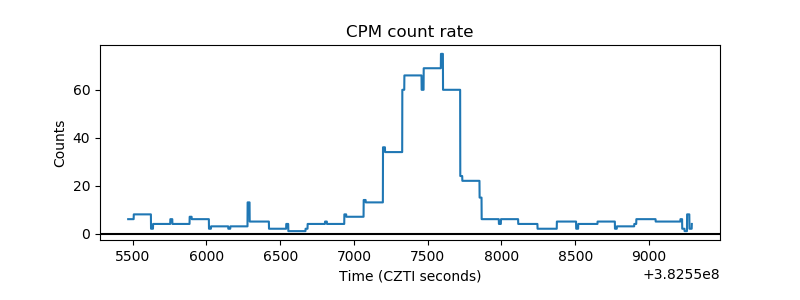 |
| CZT Counter | 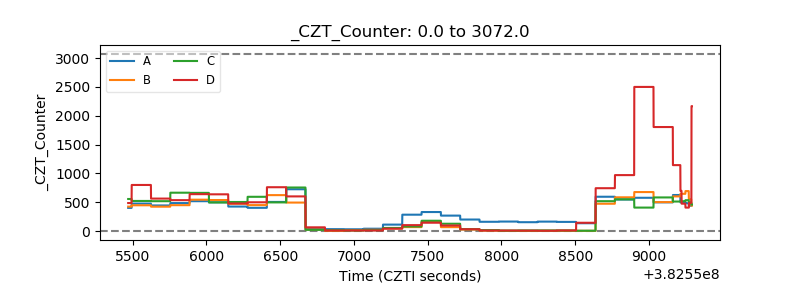 |
| +2.5 Volts monitor | 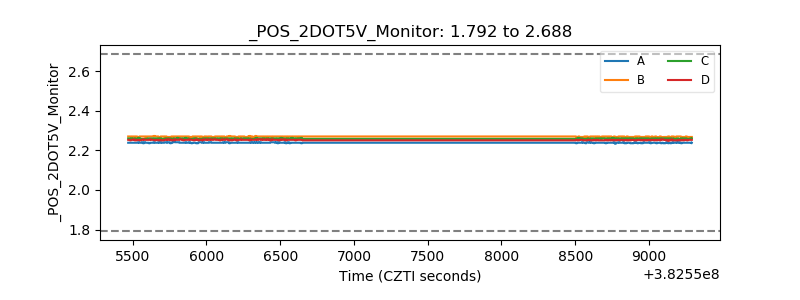 |
| +5 Volts monitor | 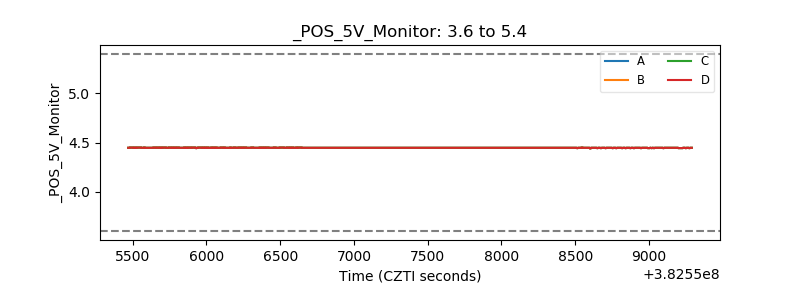 |
| _ROLL_ROT | 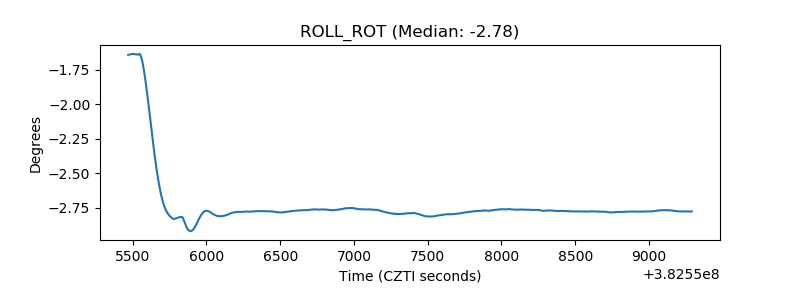 |
| _Roll_DEC | 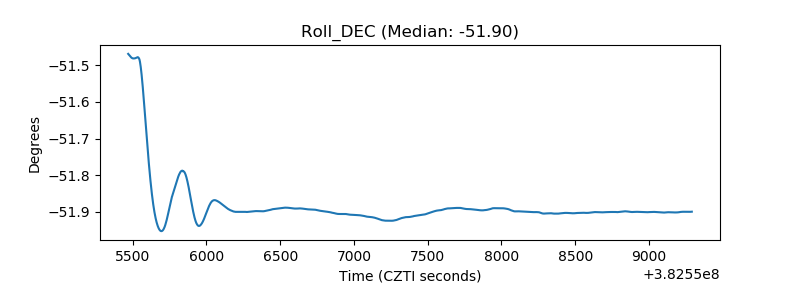 |
| _Roll_RA | 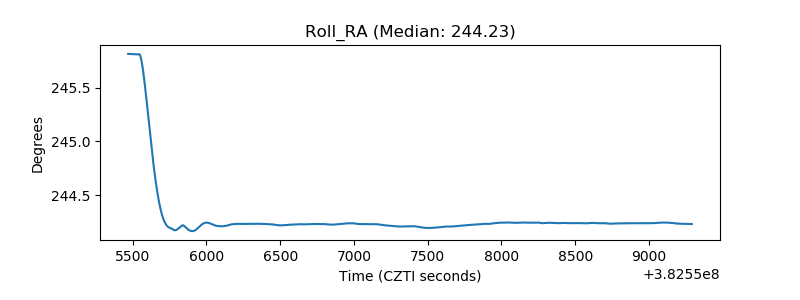 |
| Veto Counter | 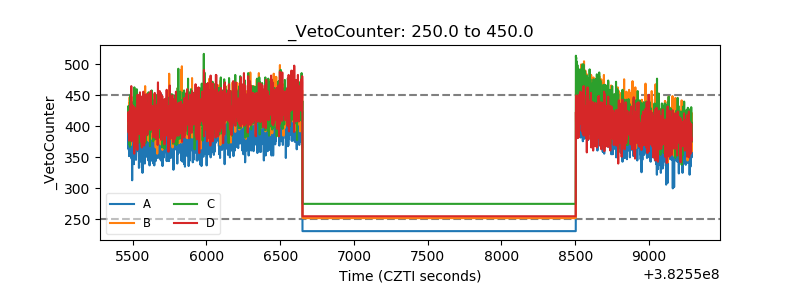 |