| Param | Original file | Final file |
|---|---|---|
| Filename | modeM0/AS1A05_103T05_9000004930cztM0_level2_bc.evt | modeM0/AS1A05_103T05_9000004930cztM0_level2_quad_clean.evt |
| Size (bytes) | 2,741,719,680 | 610,427,520 |
| Size | 2.6 GB | 582.1 MB |
| Events in quadrant A | 10,384,380 | 3,984,577 |
| Events in quadrant B | 17,554,442 | 3,911,607 |
| Events in quadrant C | 13,491,888 | 3,952,061 |
| Events in quadrant D | 38,379,526 | 3,386,364 |
| Mode M9 | |||
|---|---|---|---|
| Quadrant | BADHDUFLAG | Total packets | Discarded packets |
| A | 0 | 161 | 0 |
| B | 0 | 160 | 0 |
| C | 0 | 160 | 0 |
| D | 0 | 161 | 0 |
| Mode M0 | |||
|---|---|---|---|
| Quadrant | BADHDUFLAG | Total packets | Discarded packets |
| A | 0 | 97417 | 0 |
| B | 0 | 128811 | 0 |
| C | 0 | 104124 | 0 |
| D | 0 | 204203 | 0 |
| Mode SS | |||
|---|---|---|---|
| Quadrant | BADHDUFLAG | Total packets | Discarded packets |
| A | 0 | 964 | 0 |
| B | 0 | 964 | 0 |
| C | 0 | 964 | 0 |
| D | 0 | 964 | 0 |
| Quadrant | Total seconds | Saturated seconds | Saturation percentage |
|---|---|---|---|
| A | 47406 | 107 | 0.225710% |
| B | 47406 | 2736 | 5.771421% |
| C | 47406 | 230 | 0.485171% |
| D | 47406 | 9911 | 20.906636% |
Noise dominated data is calculated using 1-second bins in cleaned event files. If a bin has >2000 counts, and if more than 50% of those come from <1% of pixels, then it is considered to be noise-dominated and hence unusable.
| Quadrant | # 1 sec bins | Bins with >0 counts | Bins with >2000 counts | High rate bins dominated by noise | Noise dominated (total time) | Noise dominated (detector-on time) | Marked lightcurve |
|---|---|---|---|---|---|---|---|
| A | 63356 | 47416 | 16 | 16 | 0.03% | 0.03% | 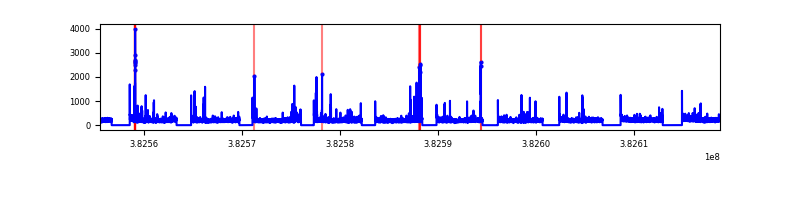 |
| B | 63356 | 47406 | 212 | 212 | 0.33% | 0.45% | 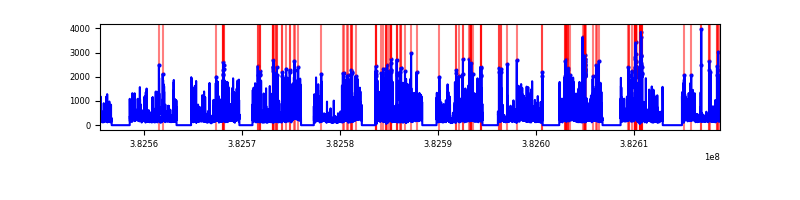 |
| C | 63356 | 47406 | 42 | 42 | 0.07% | 0.09% | 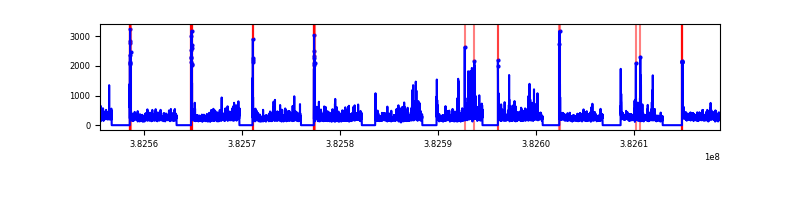 |
| D | 63356 | 47405 | 2816 | 2816 | 4.44% | 5.94% | 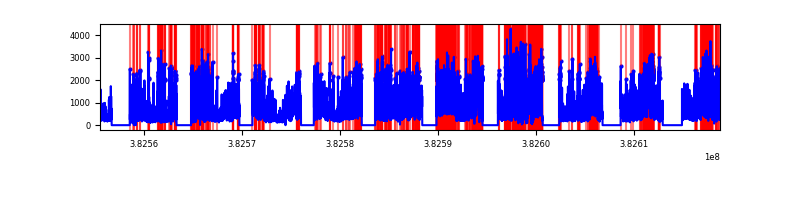 |
Top three noisy pixels from each quadrant. If the there are fewer than three noisy pixels in the level2.evt file, extra rows are filled as -1
| Pixel properties | Quadrant properties | ||||||
|---|---|---|---|---|---|---|---|
| Quadrant | DetID | PixID | Counts | Sigma | Mean | Median | Sigma |
| A | 10 | 83 | 225594 | 408.09 | 2493 | 2458 | 546.8 |
| A | 9 | 143 | 212584 | 384.29 | 2493 | 2458 | 546.8 |
| A | 13 | 6 | 130456 | 234.09 | 2493 | 2458 | 546.8 |
| B | 5 | 172 | 4310943 | 8960.19 | 2435 | 2382 | 480.9 |
| B | 0 | 229 | 1124539 | 2333.66 | 2435 | 2382 | 480.9 |
| B | 0 | 190 | 742610 | 1539.4 | 2435 | 2382 | 480.9 |
| C | 15 | 214 | 1936215 | 3439.97 | 2448 | 2433 | 562.2 |
| C | 14 | 67 | 889973 | 1578.83 | 2448 | 2433 | 562.2 |
| C | 15 | 159 | 477981 | 845.94 | 2448 | 2433 | 562.2 |
| D | 8 | 195 | 6065833 | 10807.84 | 2169 | 2119 | 561.0 |
| D | 7 | 38 | 5305985 | 9453.5 | 2169 | 2119 | 561.0 |
| D | 7 | 80 | 4419158 | 7872.84 | 2169 | 2119 | 561.0 |
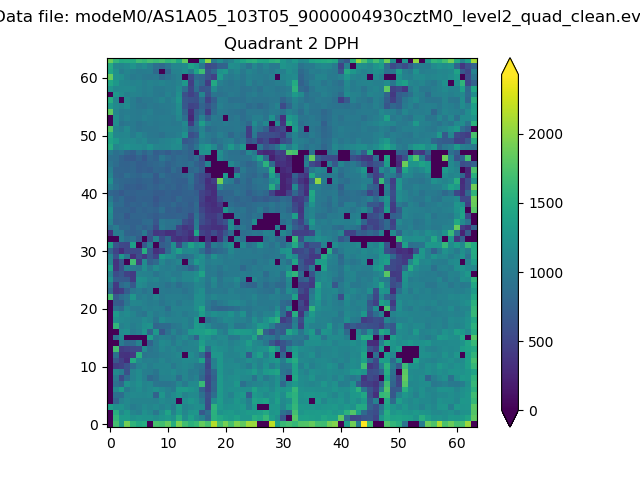
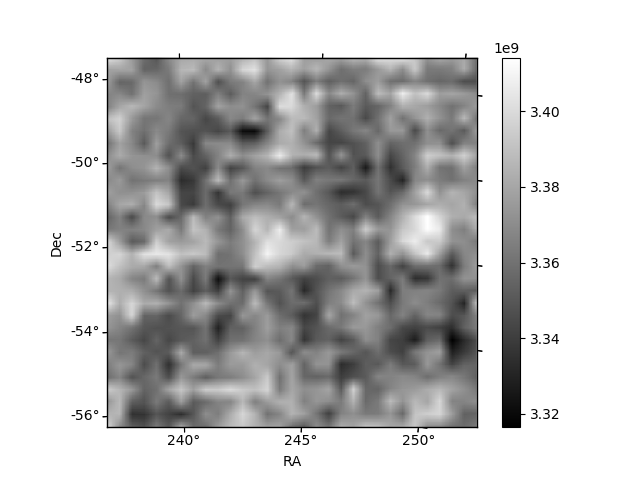
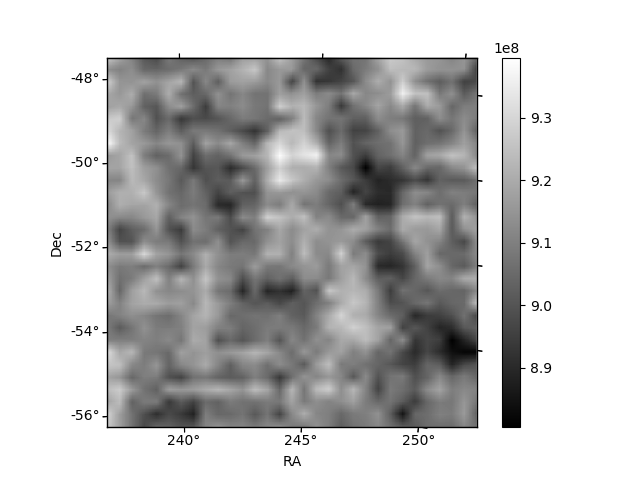
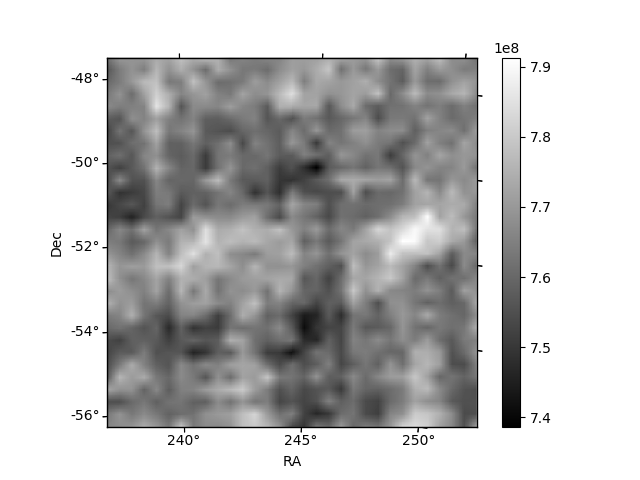
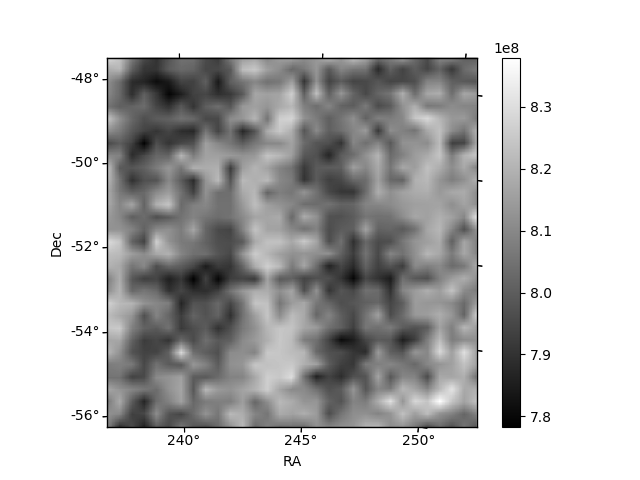
Histogram calculated using DETX and DETY for each event in the final _common_clean file
| Quadrant A | 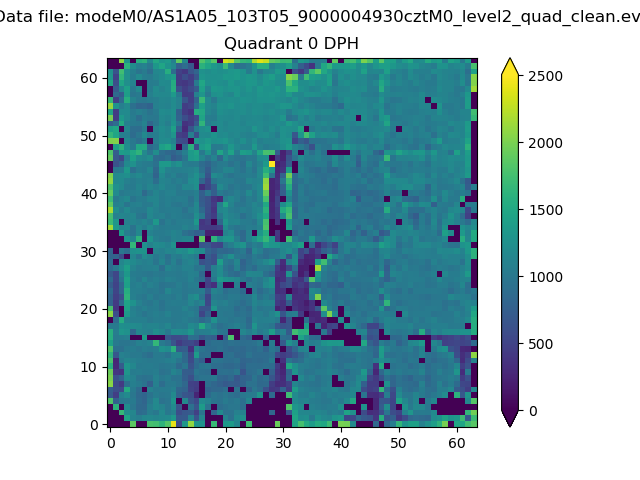 |
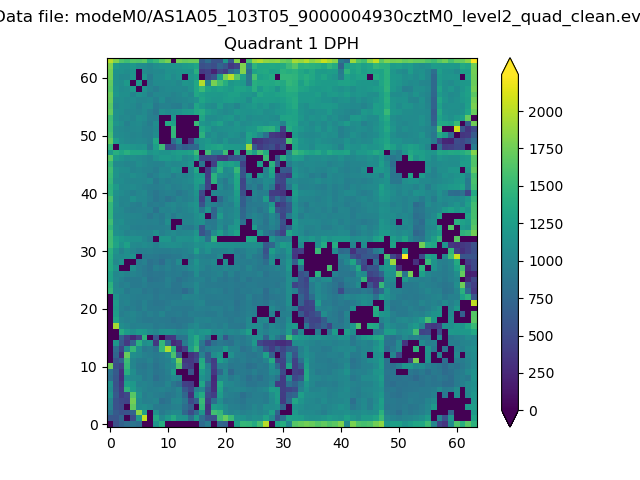 |
Quadrant B |
|---|---|---|---|
| Quadrant D | 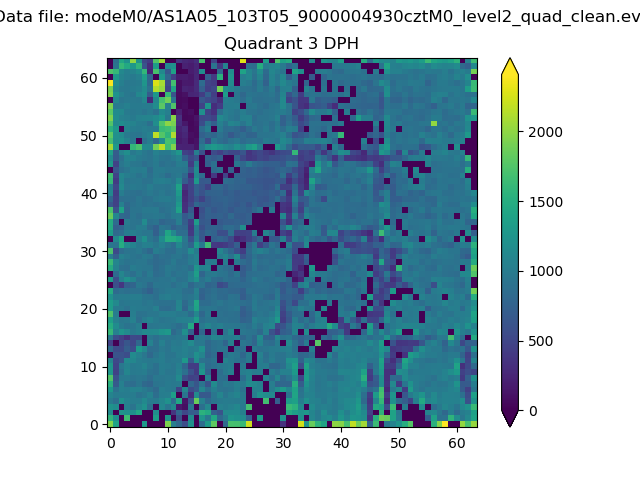 |
 |
Quadrant C |
| Plot type | Count rate plots | Images |
|---|---|---|
| Comparison with Poisson distribution Blue bars denote a histogram of data divided into 1 sec bins. Red curve is a Poisson curve with rate = median count rate of data. |
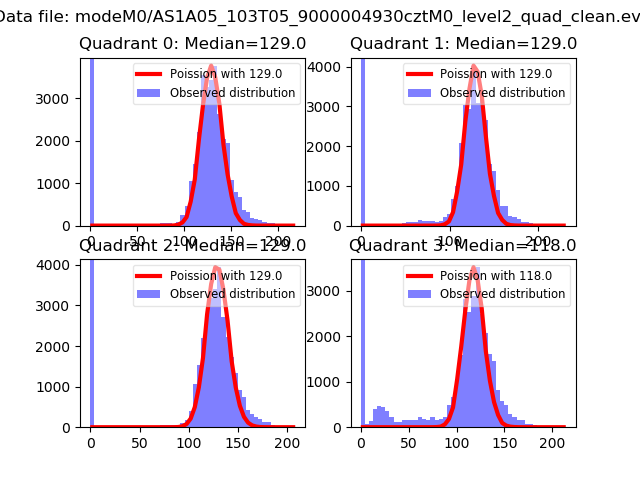 |
 |
| Quadrant-wise count rates Data is divided into 100 sec bins |
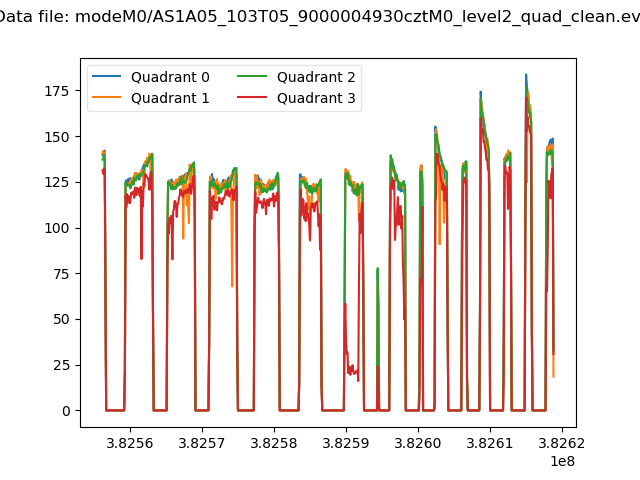 |
|
| Module-wise count rates for Quadrant A Data is divided into 100 sec bins |
 |
 |
| Module-wise count rates for Quadrant B Data is divided into 100 sec bins |
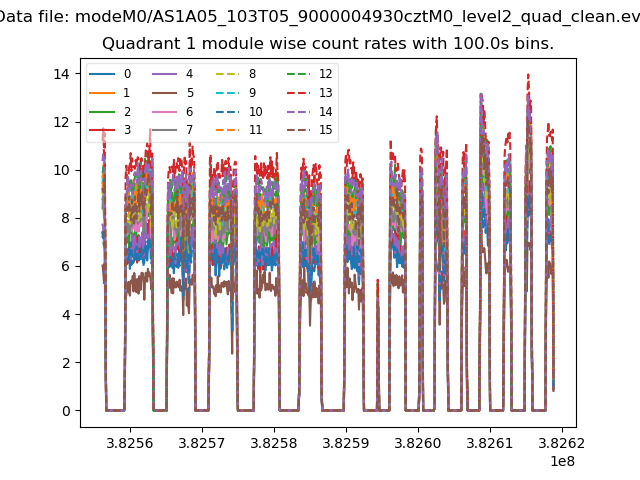 |
 |
| Module-wise count rates for Quadrant C Data is divided into 100 sec bins |
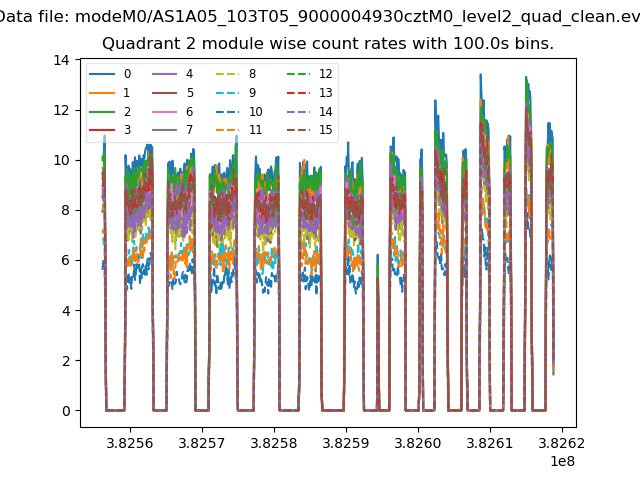 |
 |
| Module-wise count rates for Quadrant D Data is divided into 100 sec bins |
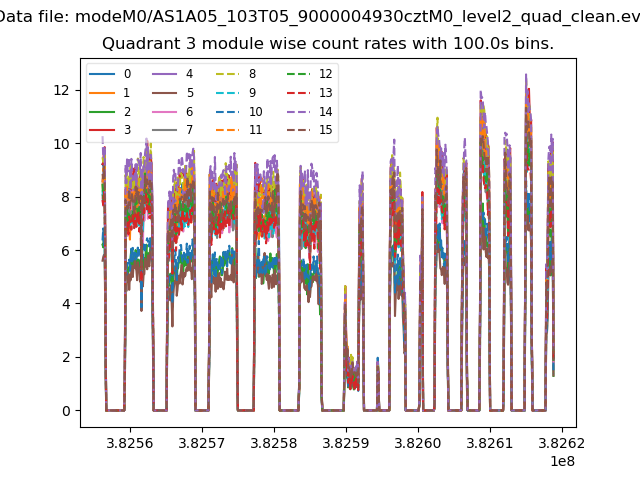 |
 |
| Parameter | Plot |
|---|---|
| CZT HV Monitor | 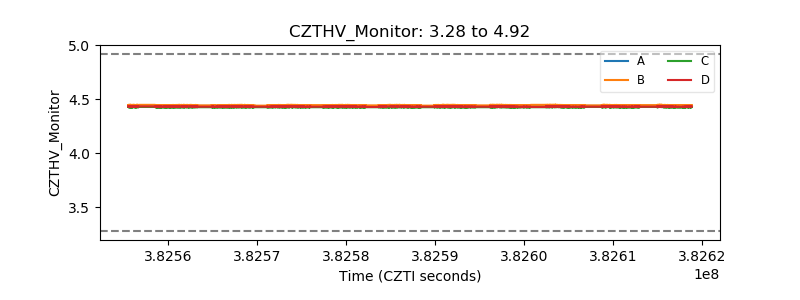 |
| D_VDD | 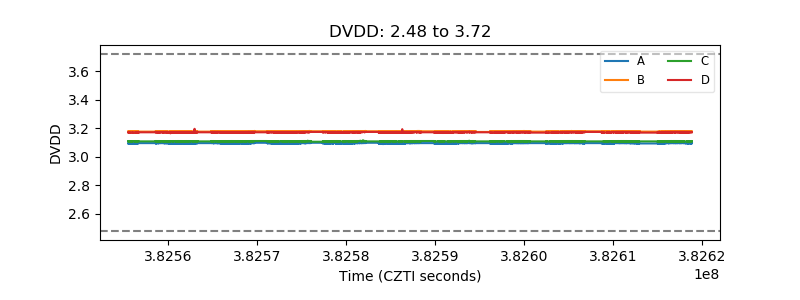 |
| Temperature 1 | 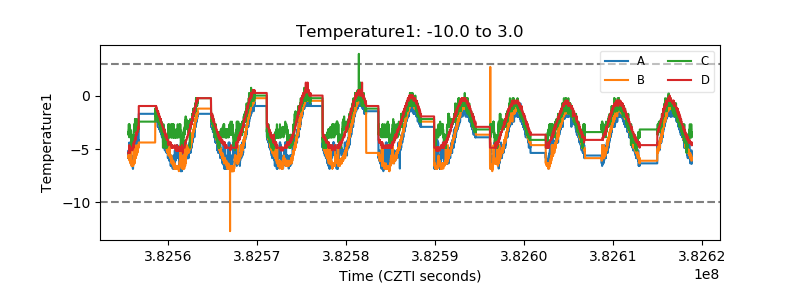 |
| Veto HV Monitor |  |
| Veto LLD | 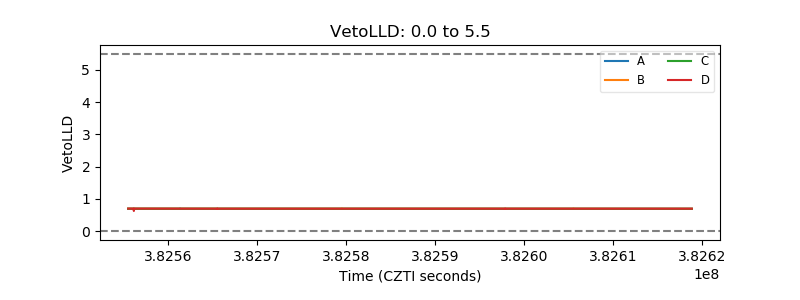 |
| Alpha Counter |  |
| _CPM_Rate | 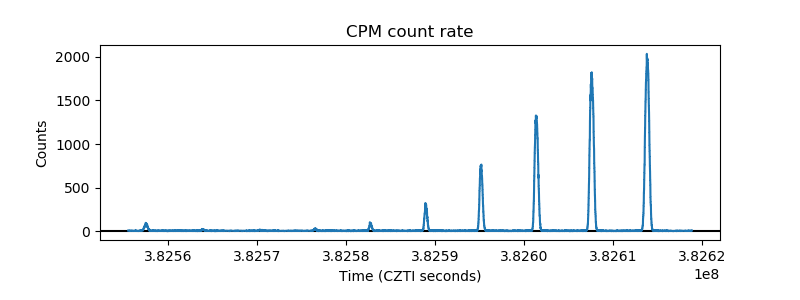 |
| CZT Counter | 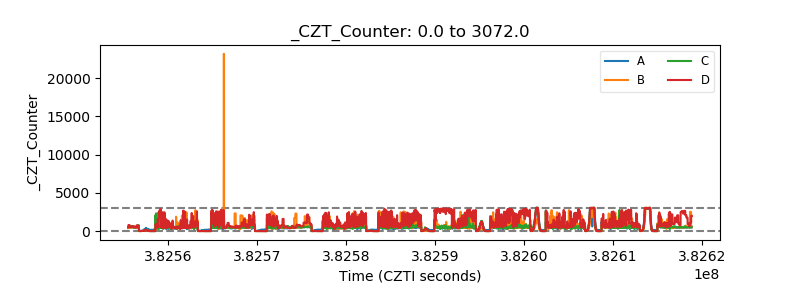 |
| +2.5 Volts monitor | 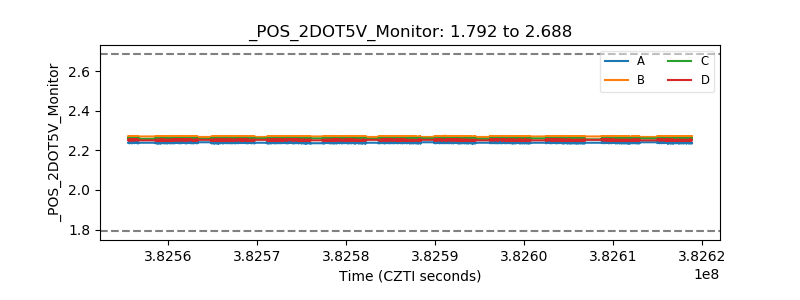 |
| +5 Volts monitor | 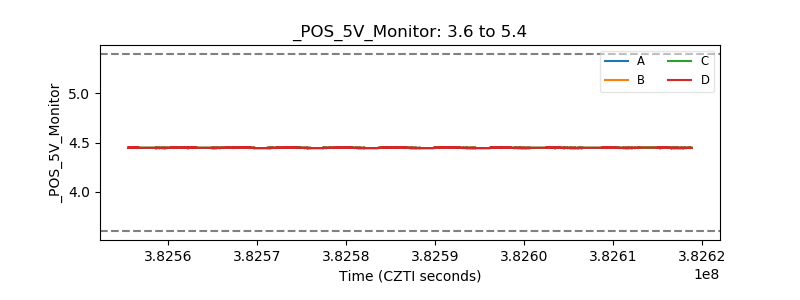 |
| _ROLL_ROT | 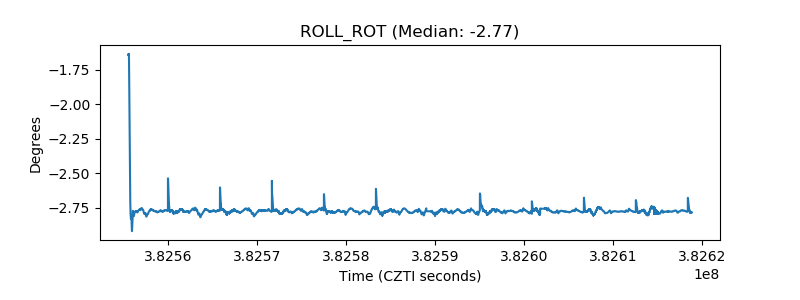 |
| _Roll_DEC | 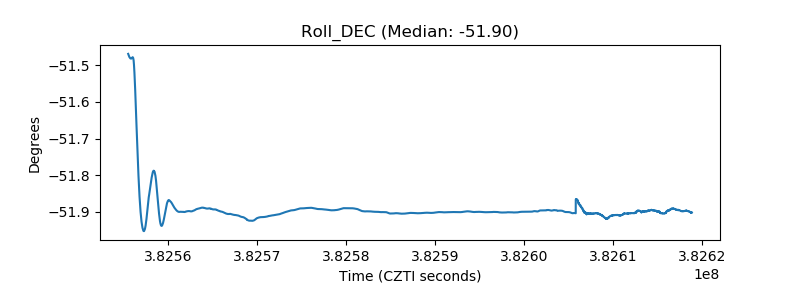 |
| _Roll_RA | 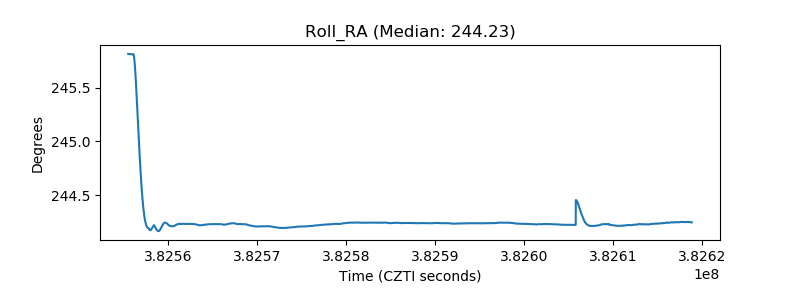 |
| Veto Counter | 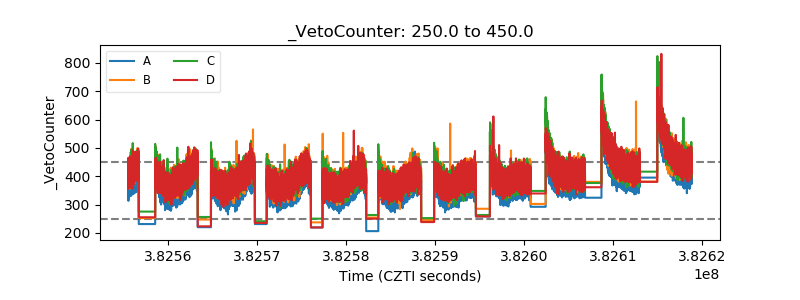 |