| Param | Original file | Final file |
|---|---|---|
| Filename | modeM0/AS1A05_156T01_9000004928_34510cztM0_level2.evt | modeM0/AS1A05_156T01_9000004928_34510cztM0_level2_quad_clean.evt |
| Size (bytes) | 423,086,400 | 59,158,080 |
| Size | 403.5 MB | 56.4 MB |
| Events in quadrant A | 2,727,003 | 362,616 |
| Events in quadrant B | 3,204,712 | 361,544 |
| Events in quadrant C | 2,900,807 | 361,835 |
| Events in quadrant D | 3,632,646 | 345,859 |
| Mode SS | |||
|---|---|---|---|
| Quadrant | BADHDUFLAG | Total packets | Discarded packets |
| A | 0 | 104 | 0 |
| B | 0 | 104 | 0 |
| C | 0 | 104 | 0 |
| D | 0 | 104 | 0 |
| Mode M0 | |||
|---|---|---|---|
| Quadrant | BADHDUFLAG | Total packets | Discarded packets |
| A | 0 | 11234 | 3 |
| B | 0 | 12724 | 2 |
| C | 0 | 11586 | 2 |
| D | 0 | 14248 | 2 |
| Mode M9 | |||
|---|---|---|---|
| Quadrant | BADHDUFLAG | Total packets | Discarded packets |
| A | 0 | 26 | 0 |
| B | 0 | 26 | 0 |
| C | 0 | 26 | 0 |
| D | 0 | 27 | 0 |
| Quadrant | Total seconds | Saturated seconds | Saturation percentage |
|---|---|---|---|
| A | 5128 | 21 | 0.409516% |
| B | 5128 | 143 | 2.788612% |
| C | 5128 | 26 | 0.507020% |
| D | 5128 | 107 | 2.086583% |
Noise dominated data is calculated using 1-second bins in cleaned event files. If a bin has >2000 counts, and if more than 50% of those come from <1% of pixels, then it is considered to be noise-dominated and hence unusable.
| Quadrant | # 1 sec bins | Bins with >0 counts | Bins with >2000 counts | High rate bins dominated by noise | Noise dominated (total time) | Noise dominated (detector-on time) | Marked lightcurve |
|---|---|---|---|---|---|---|---|
| A | 7280 | 5129 | 9 | 9 | 0.12% | 0.18% | 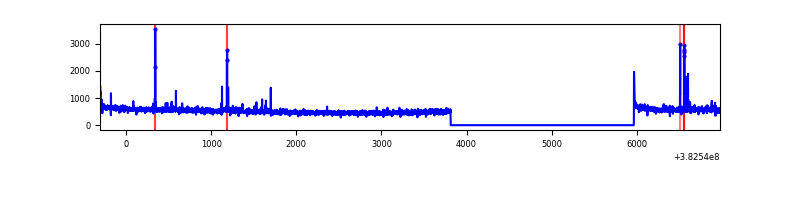 |
| B | 7280 | 5129 | 72 | 72 | 0.99% | 1.40% | 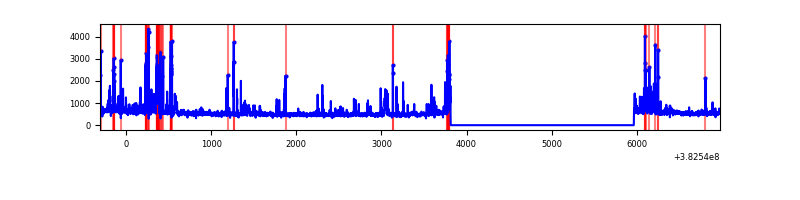 |
| C | 7280 | 5129 | 16 | 16 | 0.22% | 0.31% | 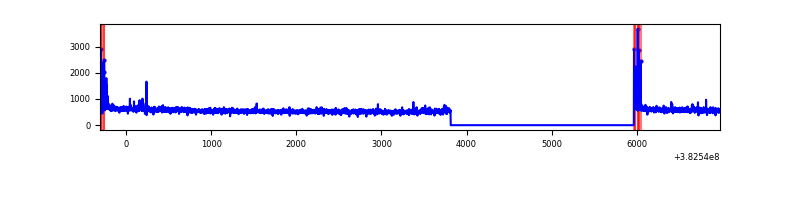 |
| D | 7280 | 5129 | 88 | 88 | 1.21% | 1.72% | 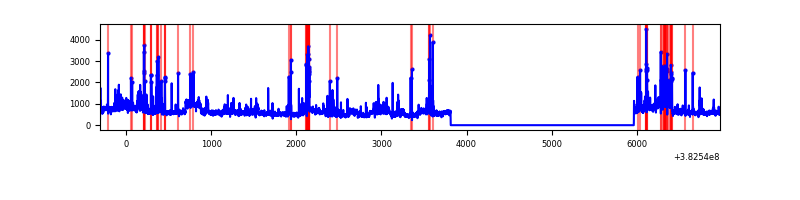 |
Top three noisy pixels from each quadrant. If the there are fewer than three noisy pixels in the level2.evt file, extra rows are filled as -1
| Pixel properties | Quadrant properties | ||||||
|---|---|---|---|---|---|---|---|
| Quadrant | DetID | PixID | Counts | Sigma | Mean | Median | Sigma |
| A | 9 | 143 | 56668 | 421.32 | 665 | 655 | 132.9 |
| A | 15 | 17 | 52454 | 389.62 | 665 | 655 | 132.9 |
| A | 10 | 83 | 39191 | 289.86 | 665 | 655 | 132.9 |
| B | 0 | 229 | 248050 | 2026.54 | 652 | 638 | 122.1 |
| B | 5 | 172 | 230634 | 1883.89 | 652 | 638 | 122.1 |
| B | 0 | 189 | 52944 | 428.44 | 652 | 638 | 122.1 |
| C | 15 | 214 | 220148 | 1491.73 | 648 | 655 | 147.1 |
| C | 0 | 10 | 93144 | 628.58 | 648 | 655 | 147.1 |
| C | 14 | 67 | 40319 | 269.57 | 648 | 655 | 147.1 |
| D | 8 | 195 | 520025 | 3304.6 | 647 | 631 | 157.2 |
| D | 10 | 199 | 128594 | 814.15 | 647 | 631 | 157.2 |
| D | 12 | 218 | 83766 | 528.94 | 647 | 631 | 157.2 |
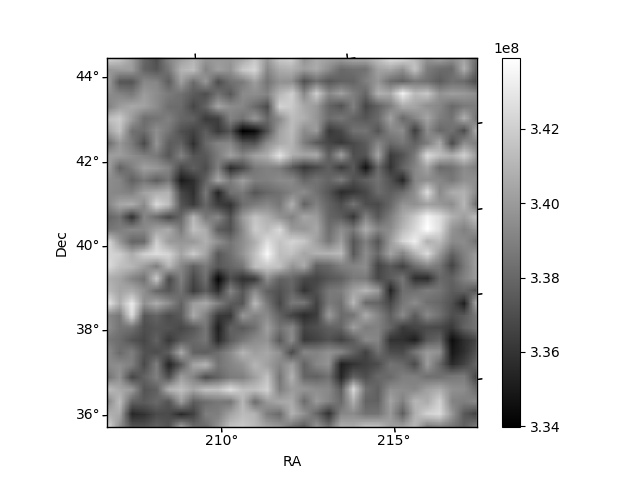
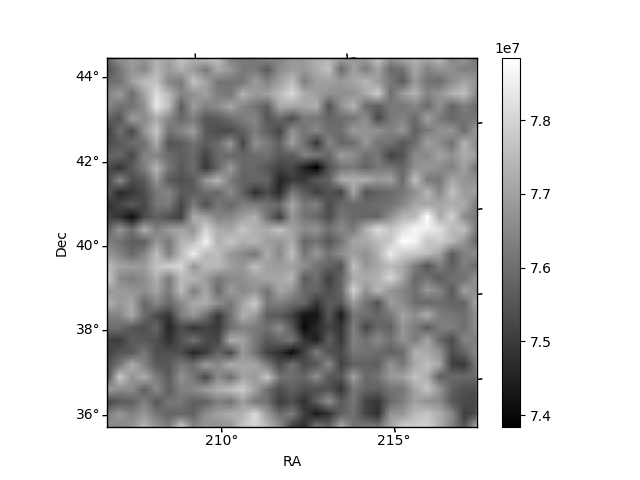
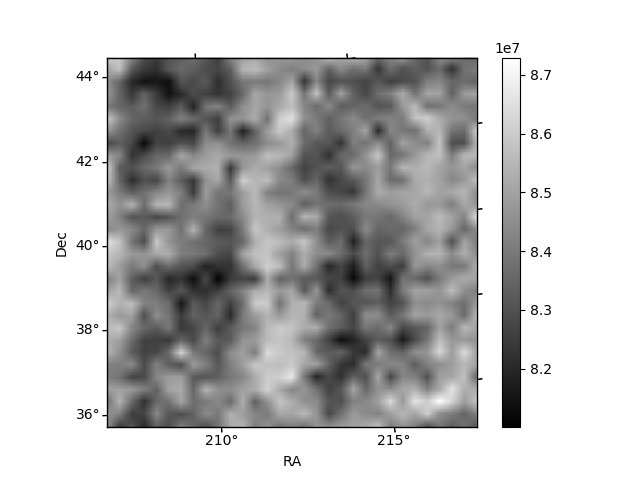
Histogram calculated using DETX and DETY for each event in the final _common_clean file
| Quadrant A | 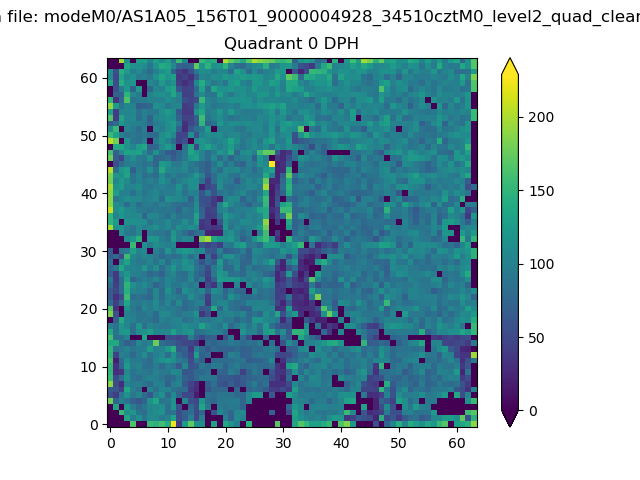 |
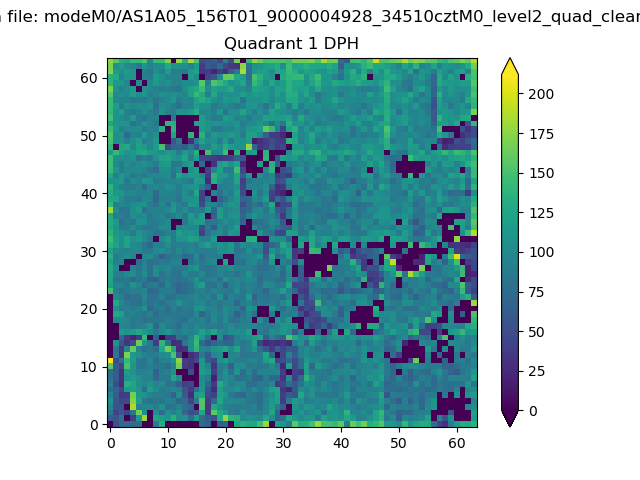 |
Quadrant B |
|---|---|---|---|
| Quadrant D | 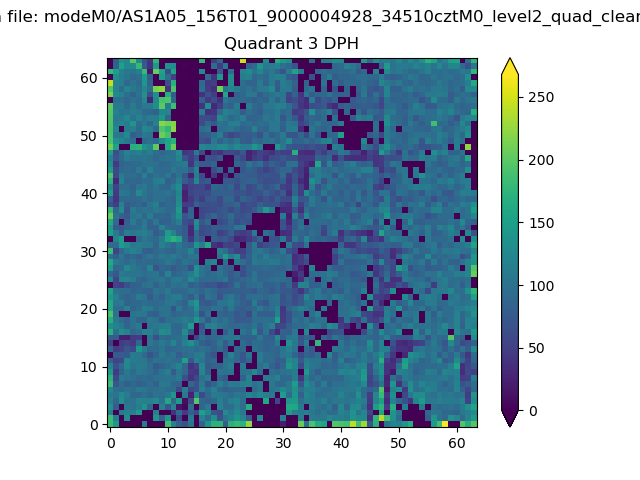 |
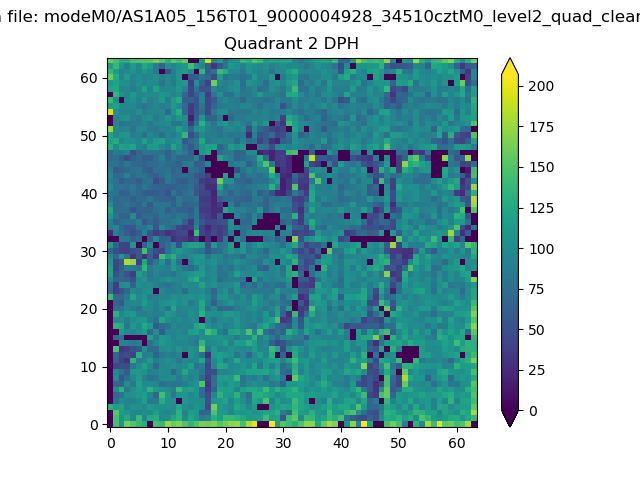 |
Quadrant C |
| Plot type | Count rate plots | Images |
|---|---|---|
| Comparison with Poisson distribution Blue bars denote a histogram of data divided into 1 sec bins. Red curve is a Poisson curve with rate = median count rate of data. |
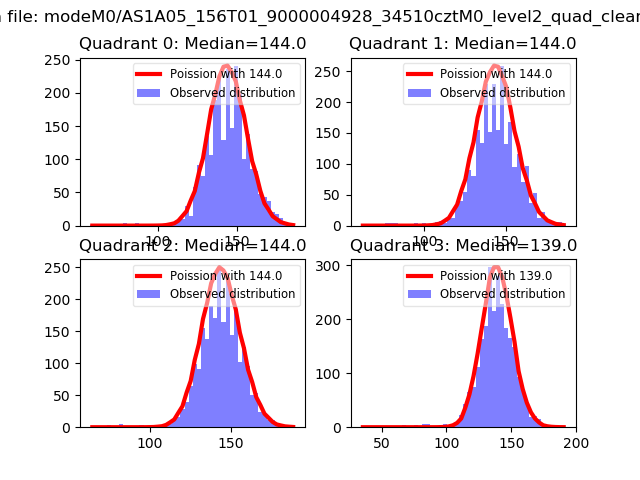 |
 |
| Quadrant-wise count rates Data is divided into 100 sec bins |
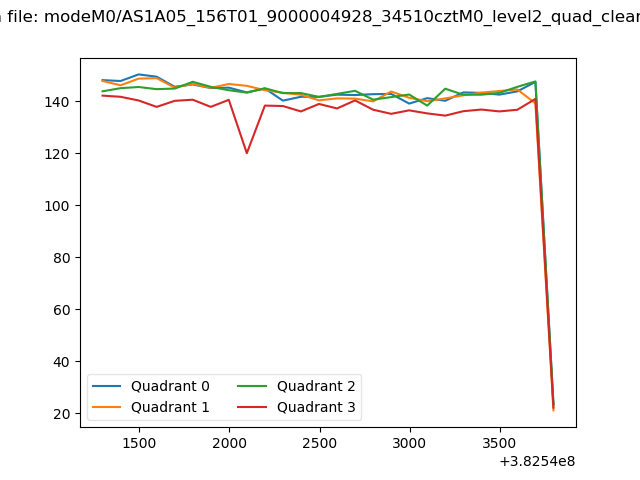 |
|
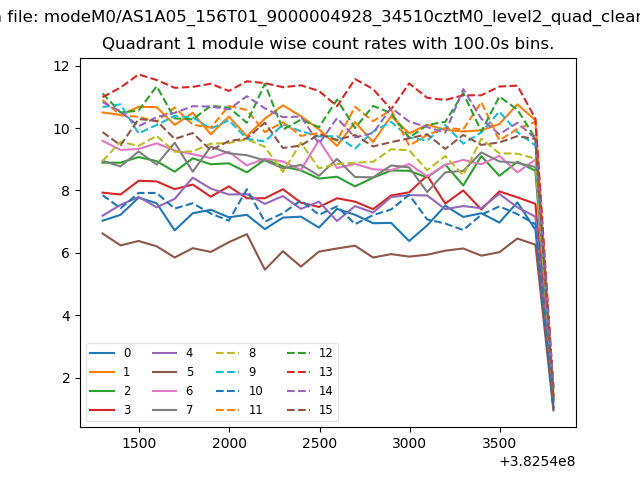
| Module-wise count rates for Quadrant A Data is divided into 100 sec bins |
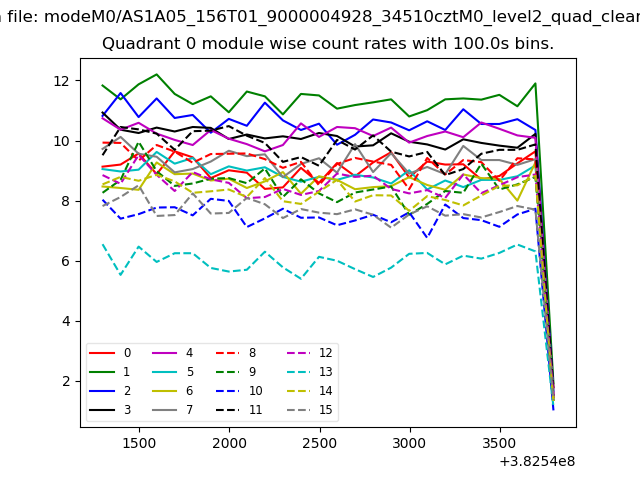 |
 |
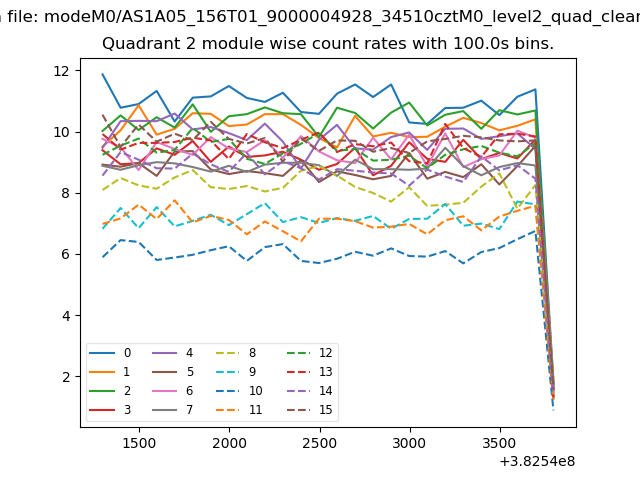
| Module-wise count rates for Quadrant B Data is divided into 100 sec bins |
 |
 |
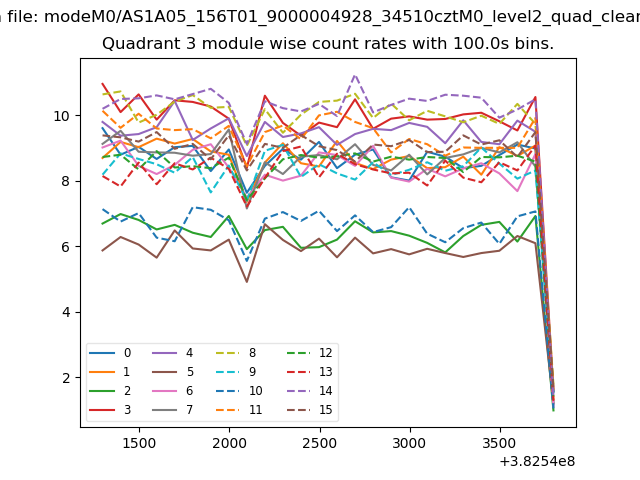
| Module-wise count rates for Quadrant C Data is divided into 100 sec bins |
 |
 |
| Module-wise count rates for Quadrant D Data is divided into 100 sec bins |
 |
 |
| Parameter | Plot |
|---|---|
| CZT HV Monitor | 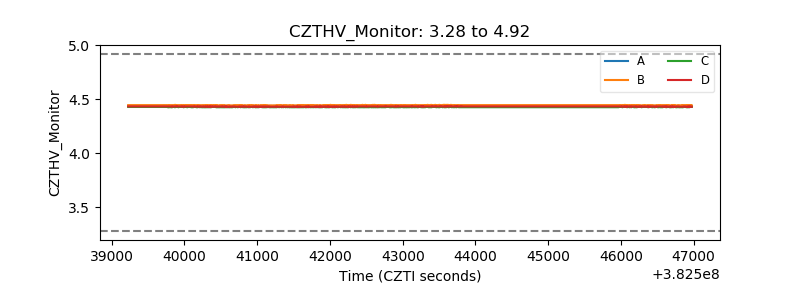 |
| D_VDD | 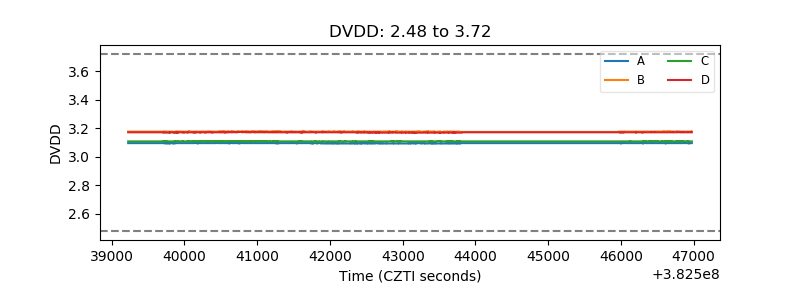 |
| Temperature 1 | 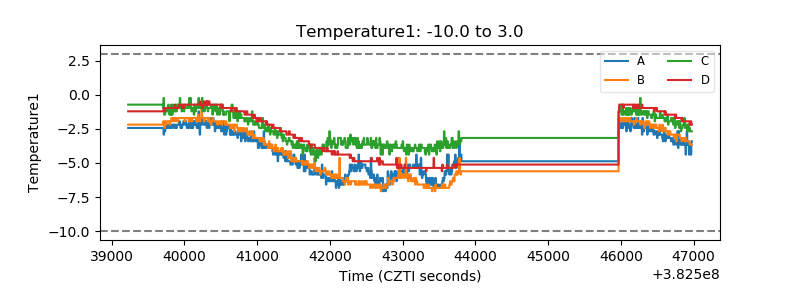 |
| Veto HV Monitor | 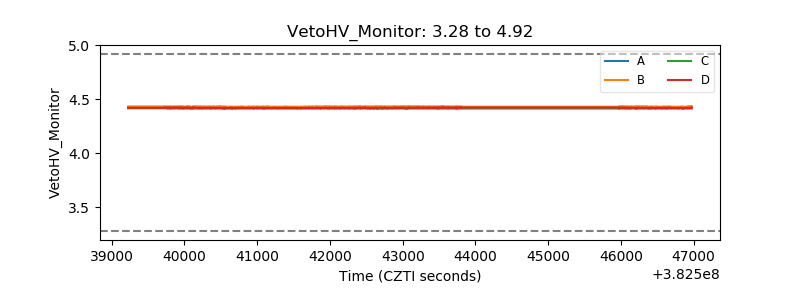 |
| Veto LLD | 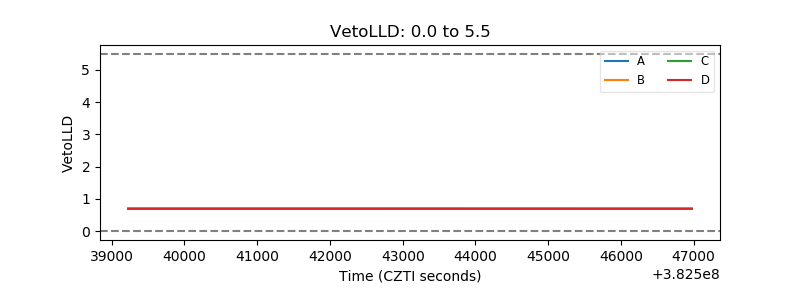 |
| Alpha Counter | 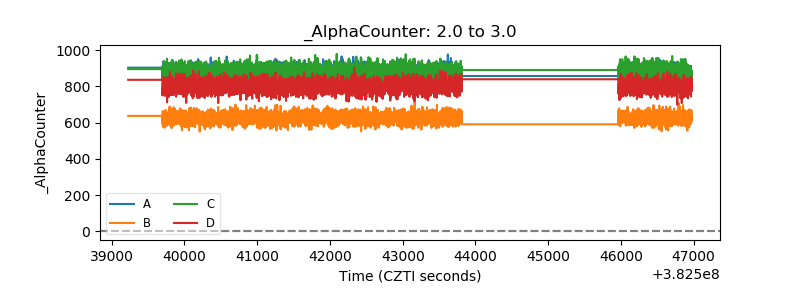 |
| _CPM_Rate | 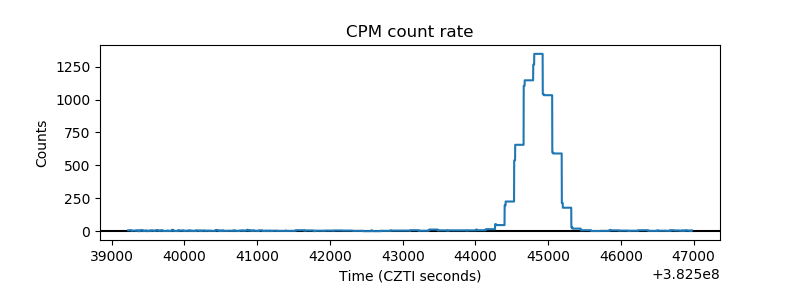 |
| CZT Counter | 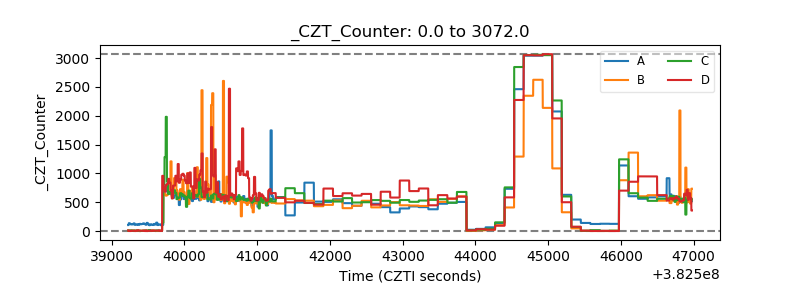 |
| +2.5 Volts monitor | 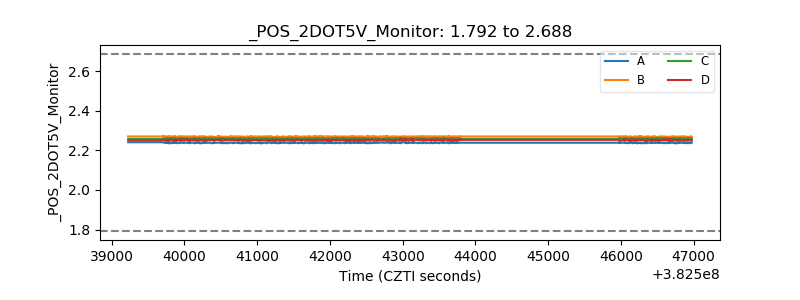 |
| +5 Volts monitor | 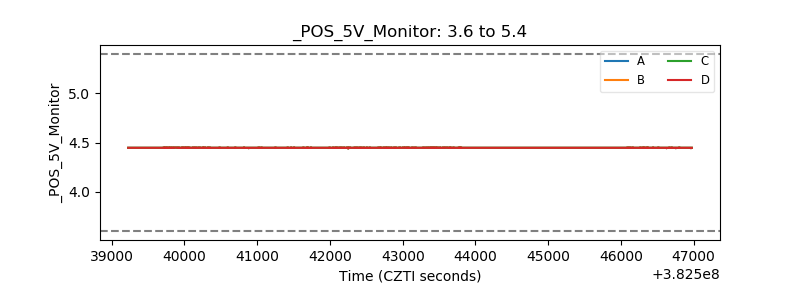 |
| _ROLL_ROT | 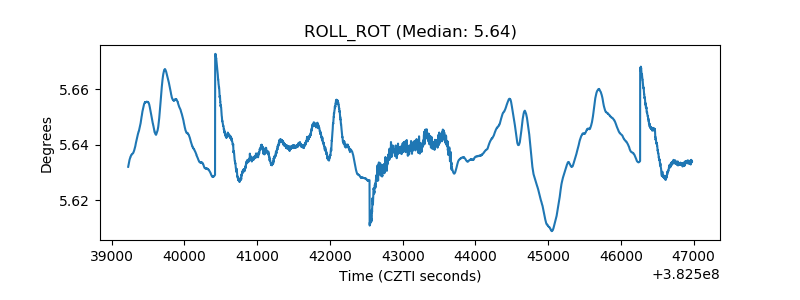 |
| _Roll_DEC | 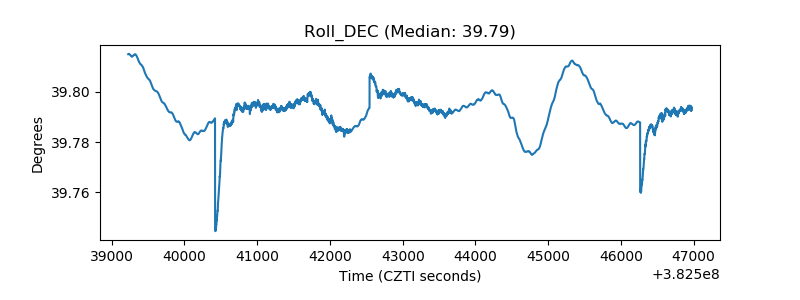 |
| _Roll_RA | 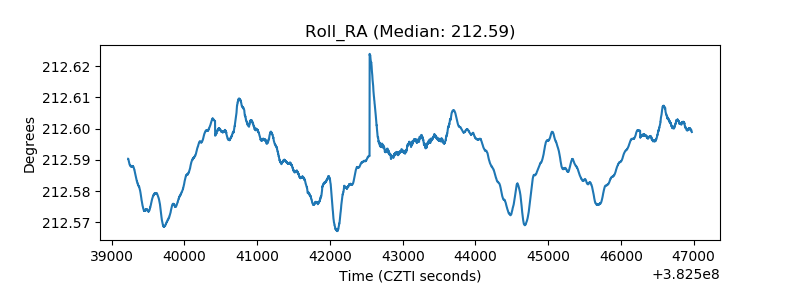 |
| Veto Counter | 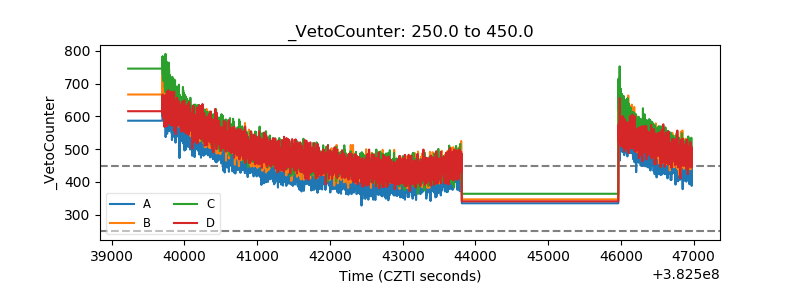 |