| Param | Original file | Final file |
|---|---|---|
| Filename | modeM0/AS1A05_156T01_9000004928_34509cztM0_level2.evt | modeM0/AS1A05_156T01_9000004928_34509cztM0_level2_quad_clean.evt |
| Size (bytes) | 487,802,880 | 52,634,880 |
| Size | 465.2 MB | 50.2 MB |
| Events in quadrant A | 2,801,758 | 315,596 |
| Events in quadrant B | 4,266,511 | 310,623 |
| Events in quadrant C | 3,090,927 | 310,164 |
| Events in quadrant D | 4,263,369 | 294,434 |
| Mode SS | |||
|---|---|---|---|
| Quadrant | BADHDUFLAG | Total packets | Discarded packets |
| A | 0 | 104 | 0 |
| B | 0 | 104 | 0 |
| C | 0 | 104 | 0 |
| D | 0 | 104 | 0 |
| Mode M0 | |||
|---|---|---|---|
| Quadrant | BADHDUFLAG | Total packets | Discarded packets |
| A | 0 | 11451 | 3 |
| B | 0 | 16040 | 2 |
| C | 0 | 12447 | 2 |
| D | 0 | 16231 | 2 |
| Mode M9 | |||
|---|---|---|---|
| Quadrant | BADHDUFLAG | Total packets | Discarded packets |
| A | 0 | 22 | 0 |
| B | 0 | 22 | 0 |
| C | 0 | 22 | 0 |
| D | 0 | 23 | 0 |
| Quadrant | Total seconds | Saturated seconds | Saturation percentage |
|---|---|---|---|
| A | 5180 | 21 | 0.405405% |
| B | 5180 | 483 | 9.324324% |
| C | 5180 | 45 | 0.868726% |
| D | 5180 | 143 | 2.760618% |
Noise dominated data is calculated using 1-second bins in cleaned event files. If a bin has >2000 counts, and if more than 50% of those come from <1% of pixels, then it is considered to be noise-dominated and hence unusable.
| Quadrant | # 1 sec bins | Bins with >0 counts | Bins with >2000 counts | High rate bins dominated by noise | Noise dominated (total time) | Noise dominated (detector-on time) | Marked lightcurve |
|---|---|---|---|---|---|---|---|
| A | 7273 | 5181 | 4 | 4 | 0.05% | 0.08% | 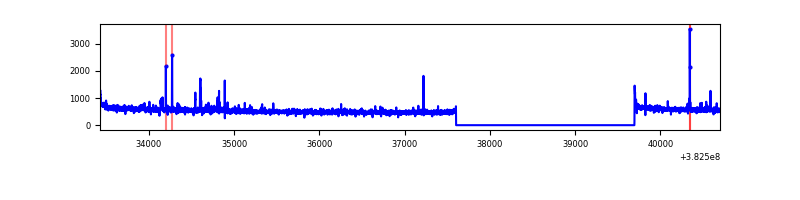 |
| B | 7273 | 5181 | 340 | 340 | 4.67% | 6.56% | 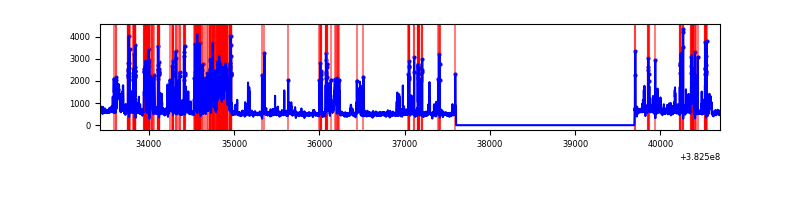 |
| C | 7273 | 5181 | 34 | 34 | 0.47% | 0.66% | 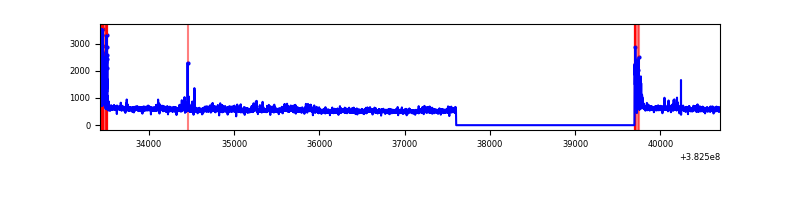 |
| D | 7273 | 5181 | 115 | 115 | 1.58% | 2.22% | 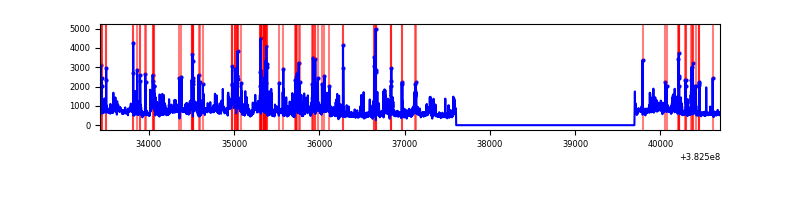 |
Top three noisy pixels from each quadrant. If the there are fewer than three noisy pixels in the level2.evt file, extra rows are filled as -1
| Pixel properties | Quadrant properties | ||||||
|---|---|---|---|---|---|---|---|
| Quadrant | DetID | PixID | Counts | Sigma | Mean | Median | Sigma |
| A | 15 | 17 | 51969 | 373.03 | 693 | 682 | 137.5 |
| A | 10 | 83 | 38149 | 272.52 | 693 | 682 | 137.5 |
| A | 9 | 143 | 21319 | 150.1 | 693 | 682 | 137.5 |
| B | 5 | 172 | 1038158 | 8430.18 | 658 | 645 | 123.1 |
| B | 0 | 229 | 346138 | 2807.26 | 658 | 645 | 123.1 |
| B | 4 | 232 | 131566 | 1063.78 | 658 | 645 | 123.1 |
| C | 15 | 214 | 221842 | 1459.78 | 665 | 671 | 151.5 |
| C | 0 | 10 | 136934 | 899.37 | 665 | 671 | 151.5 |
| C | 14 | 67 | 81080 | 530.72 | 665 | 671 | 151.5 |
| D | 8 | 195 | 528705 | 3249.13 | 668 | 651 | 162.5 |
| D | 12 | 17 | 261303 | 1603.8 | 668 | 651 | 162.5 |
| D | 2 | 250 | 147707 | 904.84 | 668 | 651 | 162.5 |
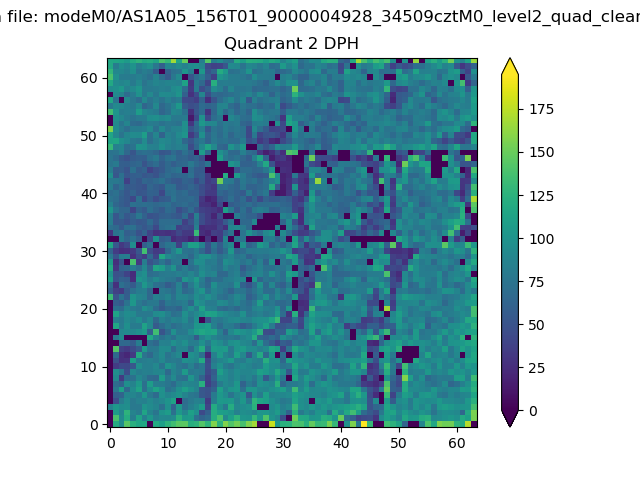
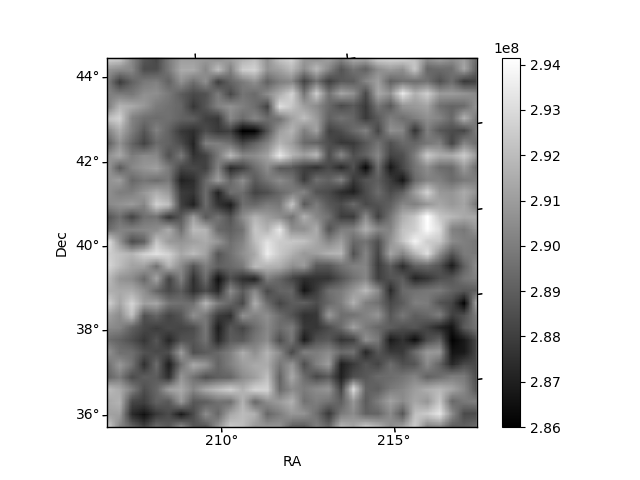
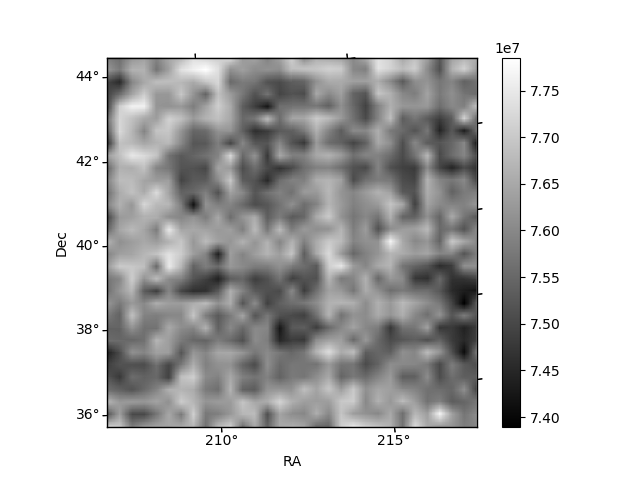
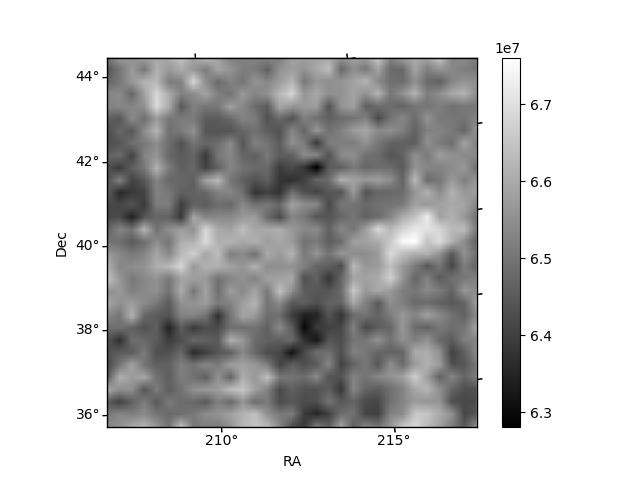
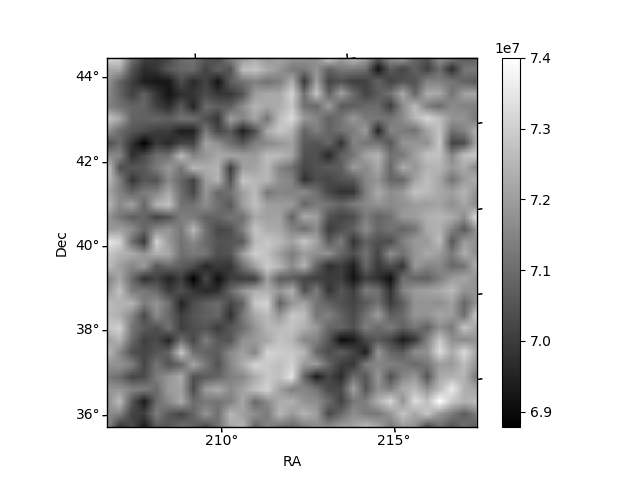
Histogram calculated using DETX and DETY for each event in the final _common_clean file
| Quadrant A | 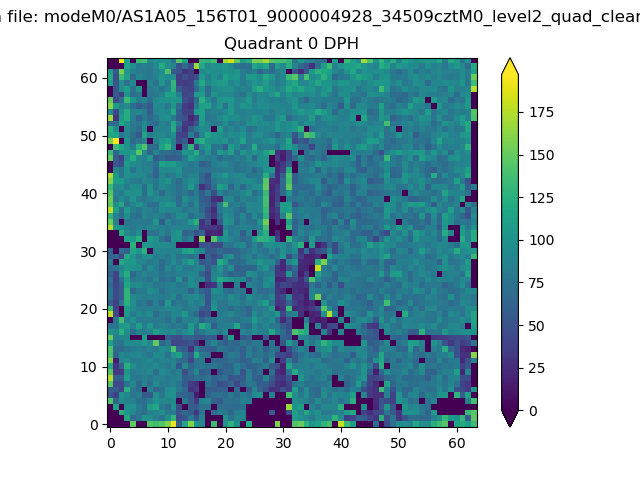 |
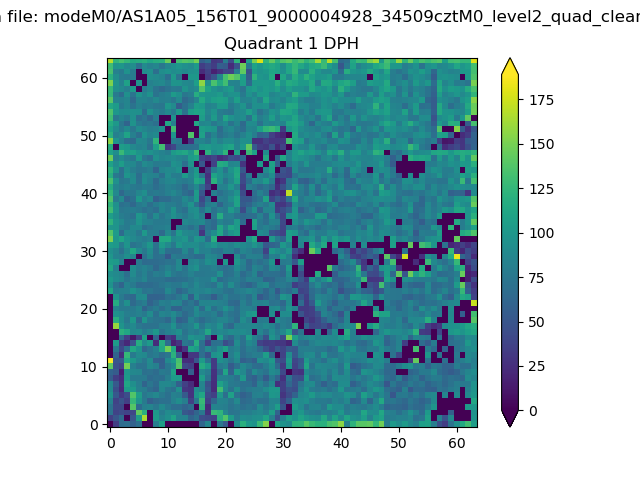 |
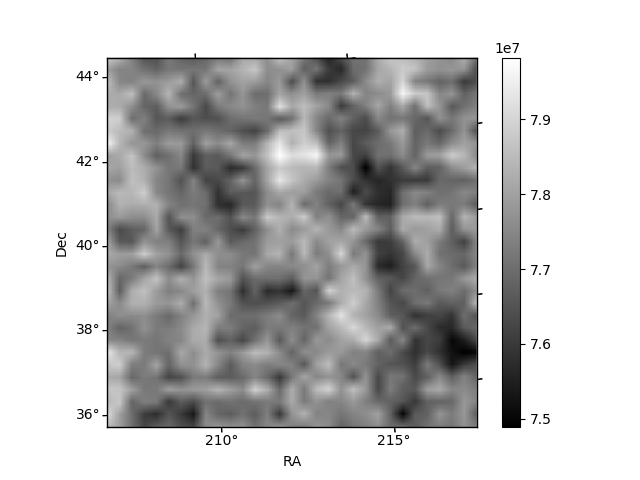
Quadrant B |
|---|---|---|---|
| Quadrant D | 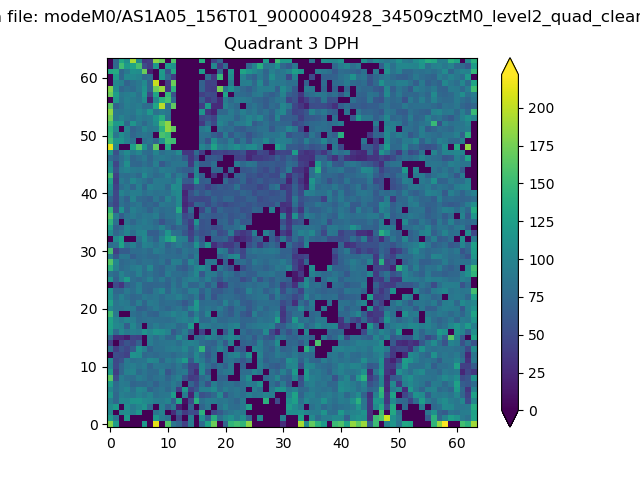 |
 |
Quadrant C |
| Plot type | Count rate plots | Images |
|---|---|---|
| Comparison with Poisson distribution Blue bars denote a histogram of data divided into 1 sec bins. Red curve is a Poisson curve with rate = median count rate of data. |
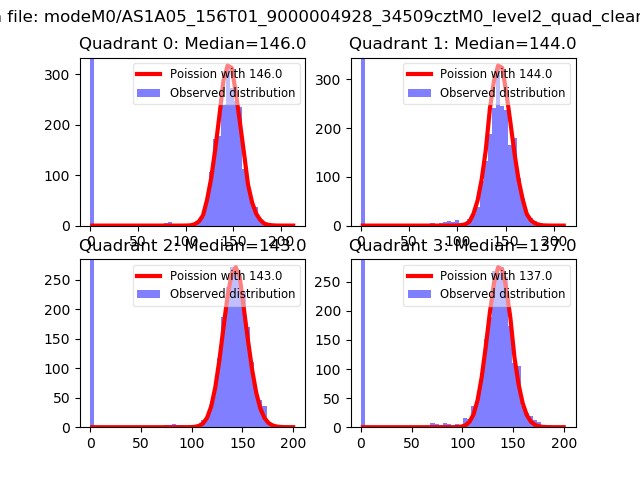 |
 |
| Quadrant-wise count rates Data is divided into 100 sec bins |
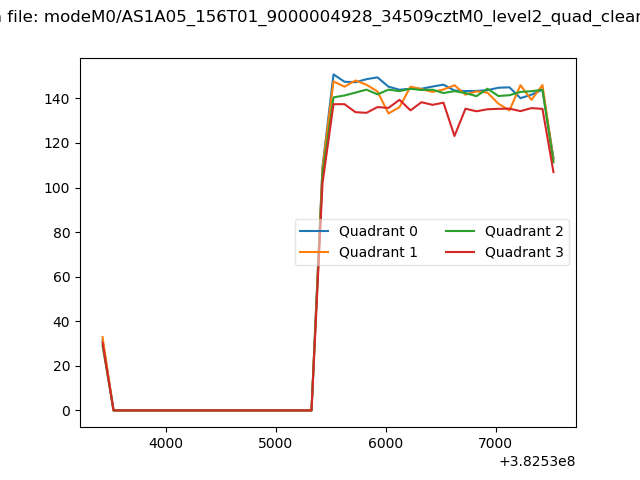 |
|
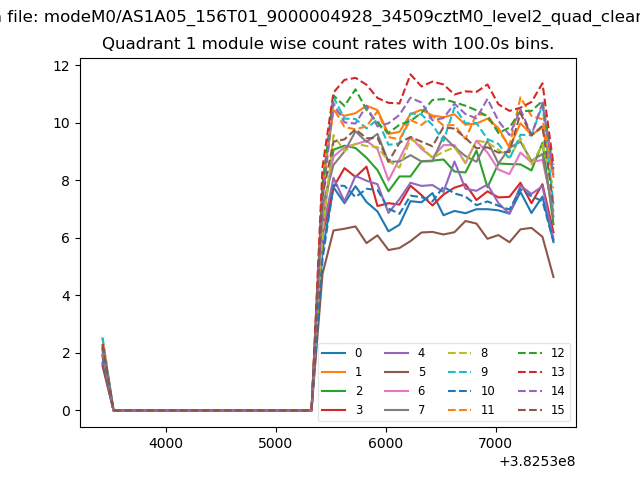
| Module-wise count rates for Quadrant A Data is divided into 100 sec bins |
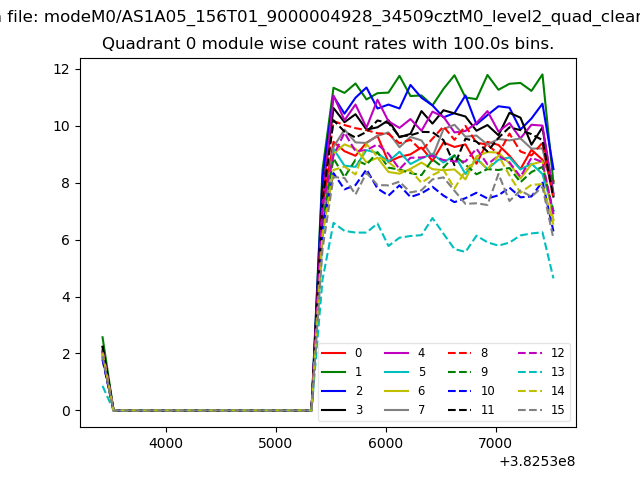 |
 |
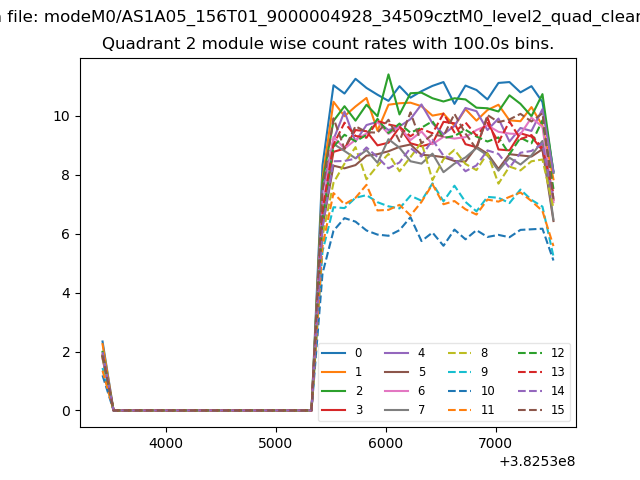
| Module-wise count rates for Quadrant B Data is divided into 100 sec bins |
 |
 |
| Module-wise count rates for Quadrant C Data is divided into 100 sec bins |
 |
 |
| Module-wise count rates for Quadrant D Data is divided into 100 sec bins |
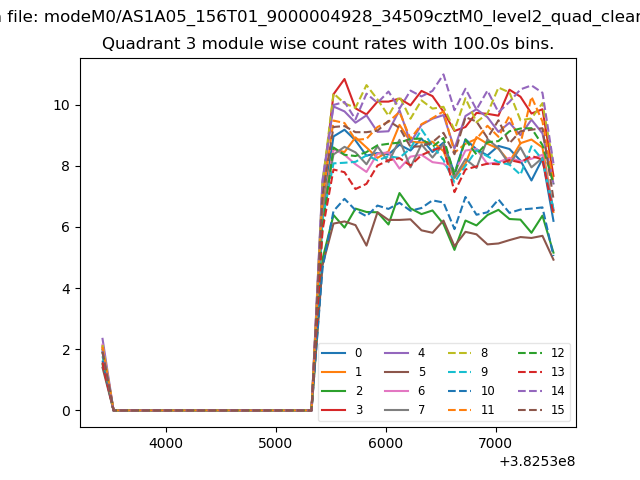 |
 |
| Parameter | Plot |
|---|---|
| CZT HV Monitor | 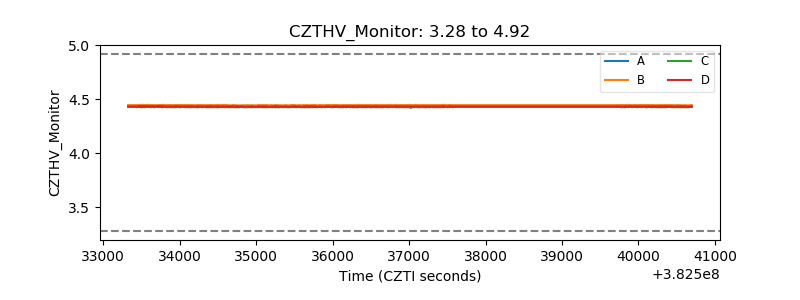 |
| D_VDD | 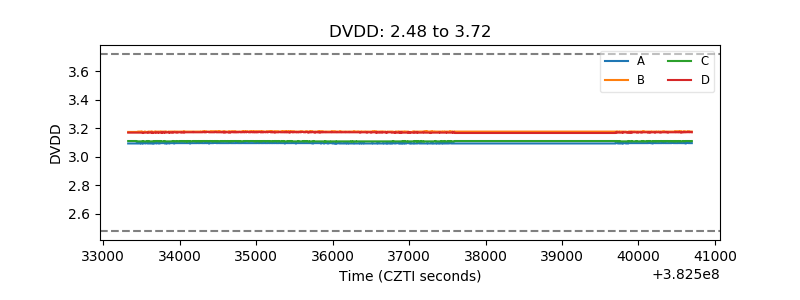 |
| Temperature 1 | 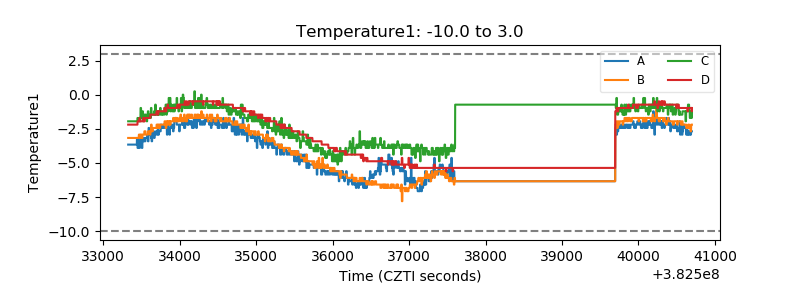 |
| Veto HV Monitor | 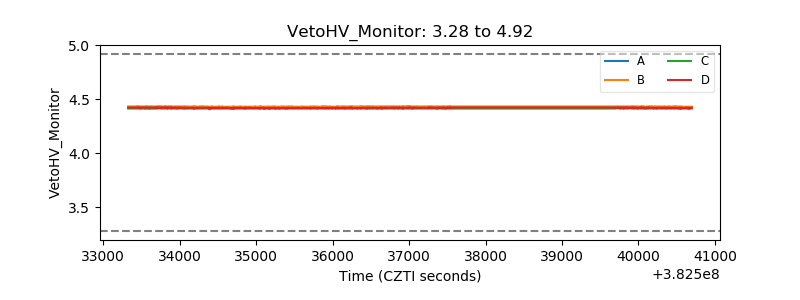 |
| Veto LLD | 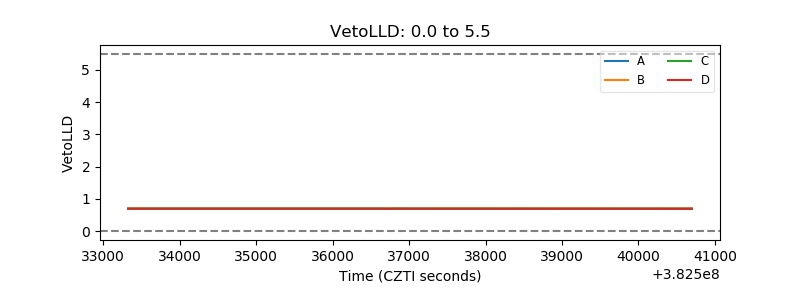 |
| Alpha Counter | 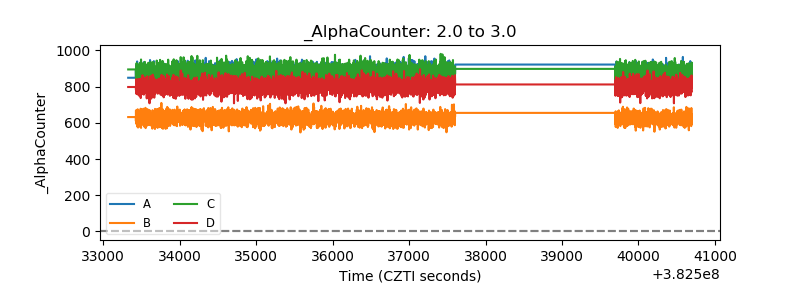 |
| _CPM_Rate | 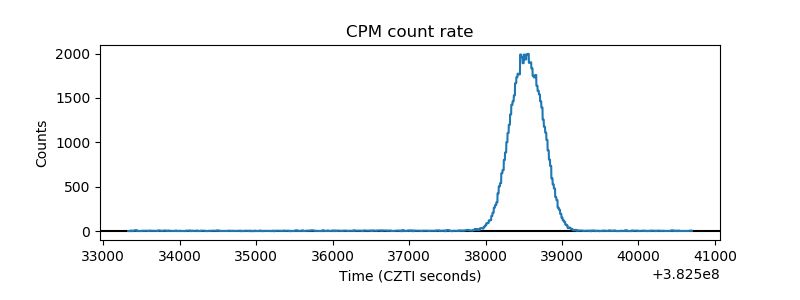 |
| CZT Counter | 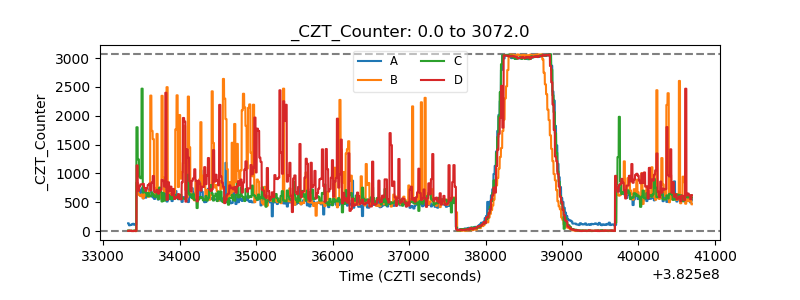 |
| +2.5 Volts monitor | 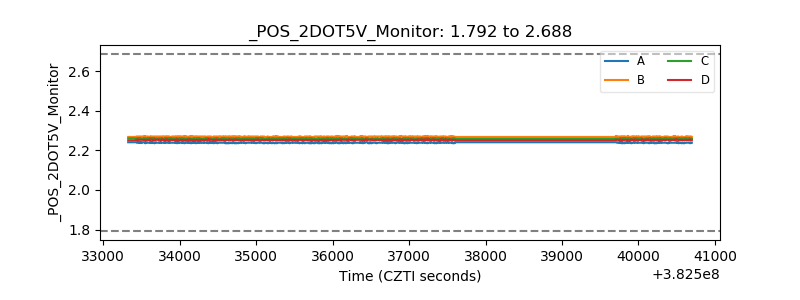 |
| +5 Volts monitor | 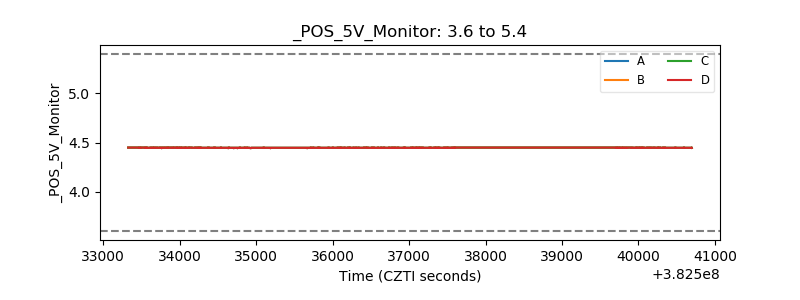 |
| _ROLL_ROT | 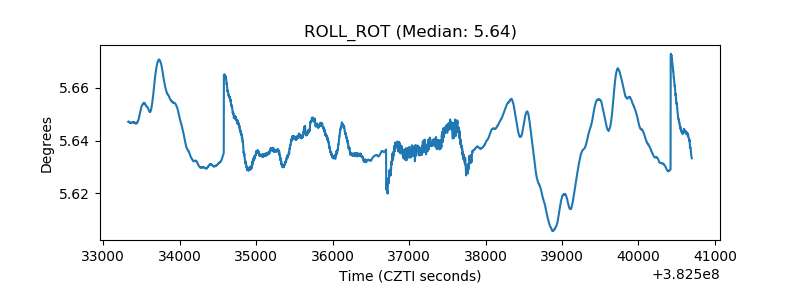 |
| _Roll_DEC | 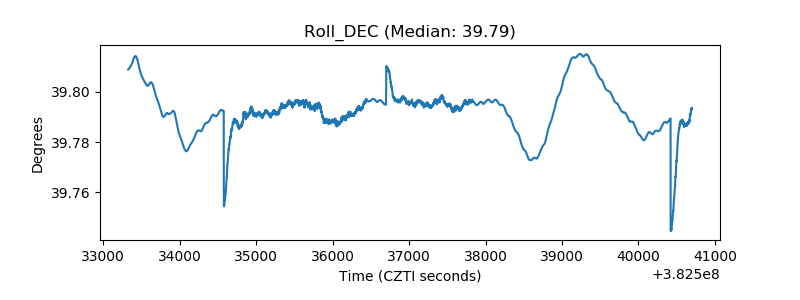 |
| _Roll_RA | 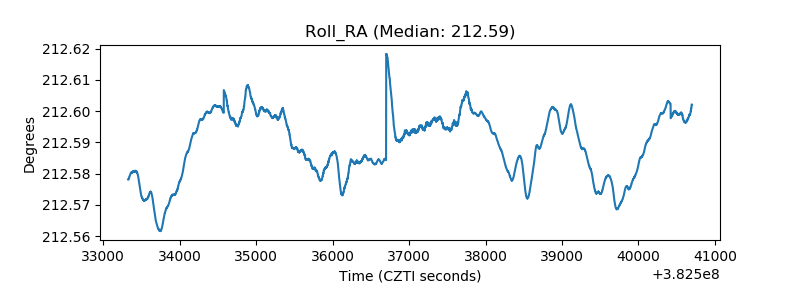 |
| Veto Counter | 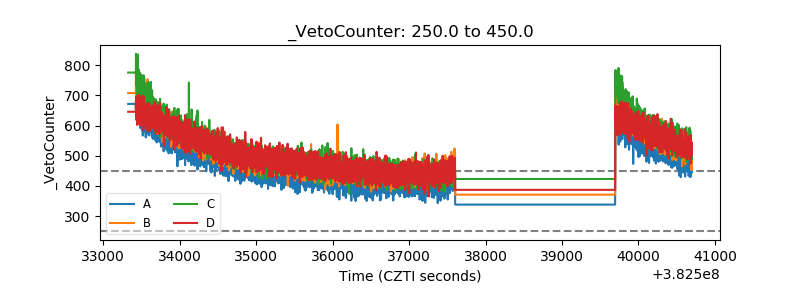 |