| Param | Original file | Final file |
|---|---|---|
| Filename | modeM0/AS1A05_156T01_9000004928_34500cztM0_level2.evt | modeM0/AS1A05_156T01_9000004928_34500cztM0_level2_quad_clean.evt |
| Size (bytes) | 536,978,880 | 84,945,600 |
| Size | 512.1 MB | 81.0 MB |
| Events in quadrant A | 3,010,518 | 538,140 |
| Events in quadrant B | 4,433,558 | 537,702 |
| Events in quadrant C | 3,205,718 | 540,506 |
| Events in quadrant D | 5,176,447 | 507,119 |
| Mode SS | |||
|---|---|---|---|
| Quadrant | BADHDUFLAG | Total packets | Discarded packets |
| A | 0 | 132 | 0 |
| B | 0 | 132 | 0 |
| C | 0 | 132 | 0 |
| D | 0 | 132 | 0 |
| Mode M0 | |||
|---|---|---|---|
| Quadrant | BADHDUFLAG | Total packets | Discarded packets |
| A | 0 | 13323 | 3 |
| B | 0 | 17593 | 2 |
| C | 0 | 13510 | 2 |
| D | 0 | 19874 | 2 |
| Mode M9 | |||
|---|---|---|---|
| Quadrant | BADHDUFLAG | Total packets | Discarded packets |
| A | 0 | 27 | 0 |
| B | 0 | 27 | 0 |
| C | 0 | 27 | 0 |
| D | 0 | 27 | 0 |
| Quadrant | Total seconds | Saturated seconds | Saturation percentage |
|---|---|---|---|
| A | 6435 | 13 | 0.202020% |
| B | 6435 | 534 | 8.298368% |
| C | 6435 | 21 | 0.326340% |
| D | 6435 | 241 | 3.745144% |
Noise dominated data is calculated using 1-second bins in cleaned event files. If a bin has >2000 counts, and if more than 50% of those come from <1% of pixels, then it is considered to be noise-dominated and hence unusable.
| Quadrant | # 1 sec bins | Bins with >0 counts | Bins with >2000 counts | High rate bins dominated by noise | Noise dominated (total time) | Noise dominated (detector-on time) | Marked lightcurve |
|---|---|---|---|---|---|---|---|
| A | 9090 | 6437 | 2 | 2 | 0.02% | 0.03% | 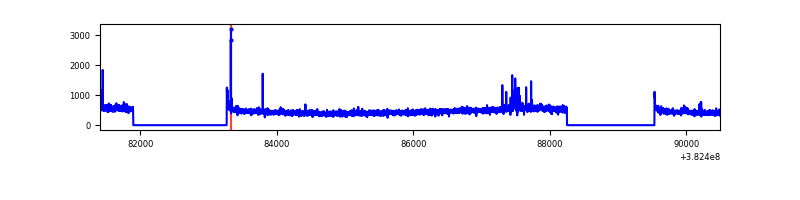 |
| B | 9090 | 6437 | 326 | 326 | 3.59% | 5.06% | 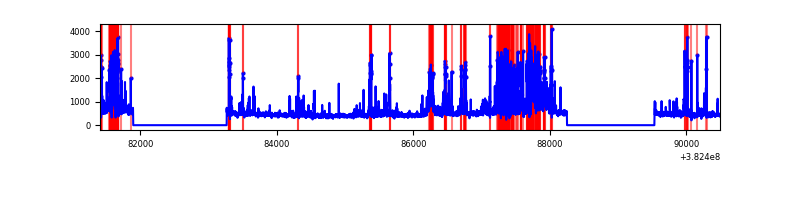 |
| C | 9090 | 6437 | 11 | 11 | 0.12% | 0.17% | 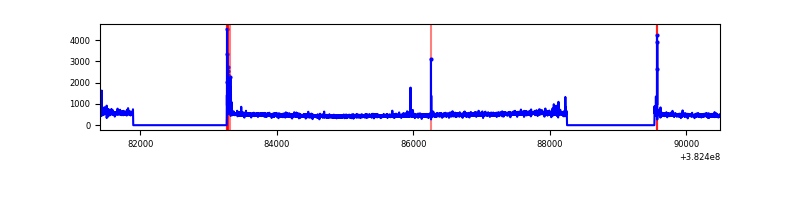 |
| D | 9090 | 6437 | 210 | 210 | 2.31% | 3.26% |  |
Top three noisy pixels from each quadrant. If the there are fewer than three noisy pixels in the level2.evt file, extra rows are filled as -1
| Pixel properties | Quadrant properties | ||||||
|---|---|---|---|---|---|---|---|
| Quadrant | DetID | PixID | Counts | Sigma | Mean | Median | Sigma |
| A | 10 | 83 | 39134 | 256.09 | 747 | 734 | 149.9 |
| A | 9 | 143 | 26895 | 174.47 | 747 | 734 | 149.9 |
| A | 15 | 169 | 21984 | 141.72 | 747 | 734 | 149.9 |
| B | 5 | 172 | 1111400 | 8112.39 | 714 | 696 | 136.9 |
| B | 4 | 171 | 300109 | 2186.86 | 714 | 696 | 136.9 |
| B | 0 | 189 | 88896 | 644.2 | 714 | 696 | 136.9 |
| C | 15 | 214 | 272876 | 1623.75 | 724 | 730 | 167.6 |
| C | 0 | 10 | 53699 | 316.04 | 724 | 730 | 167.6 |
| C | 14 | 67 | 21748 | 125.4 | 724 | 730 | 167.6 |
| D | 8 | 195 | 1010464 | 5293.07 | 710 | 698 | 190.8 |
| D | 2 | 250 | 556757 | 2914.79 | 710 | 698 | 190.8 |
| D | 10 | 204 | 261133 | 1365.17 | 710 | 698 | 190.8 |
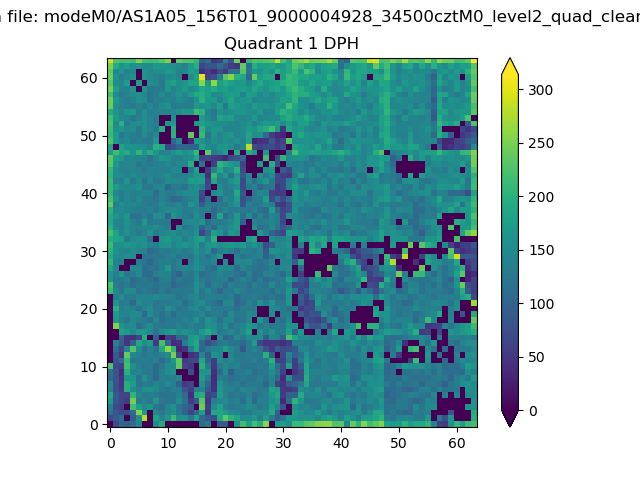
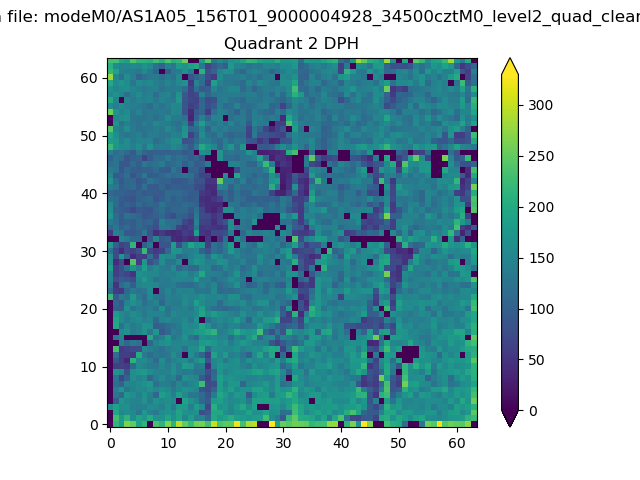
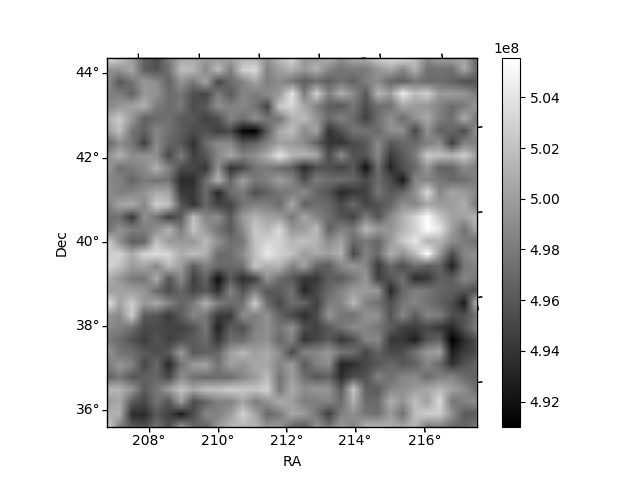
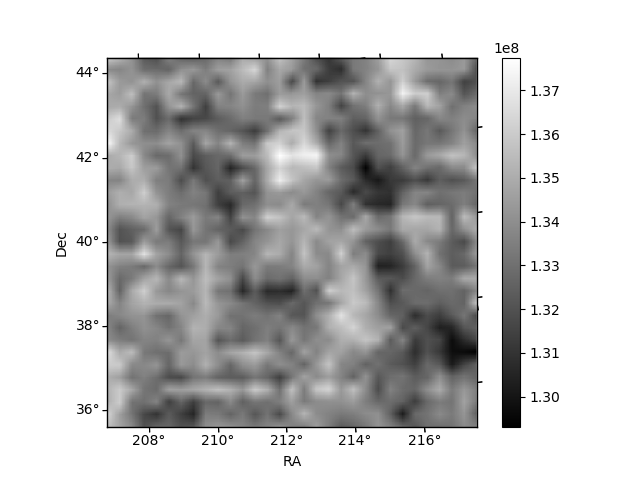
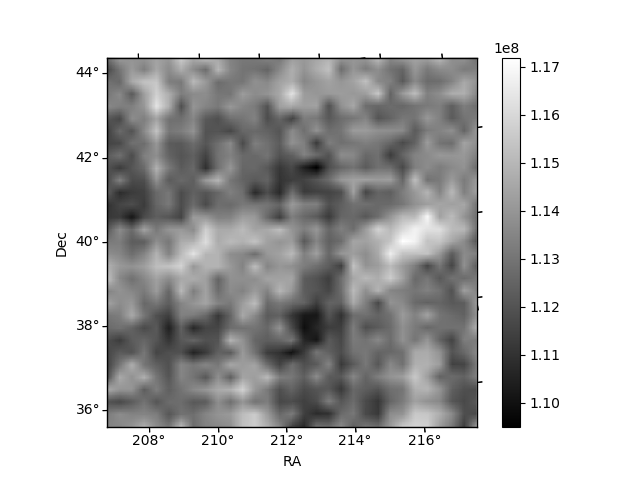
Histogram calculated using DETX and DETY for each event in the final _common_clean file
| Quadrant A | 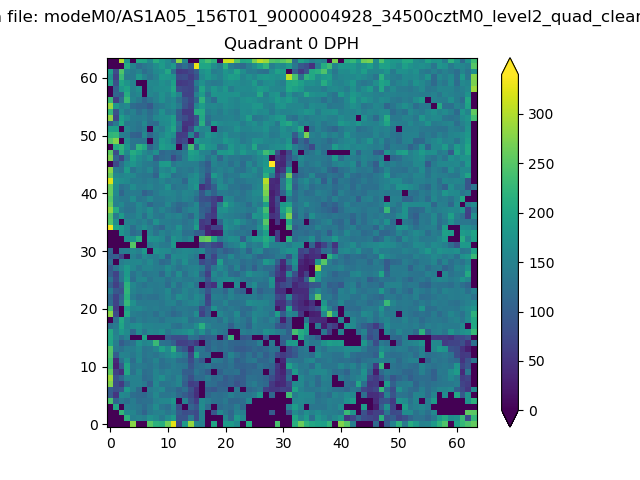 |
 |
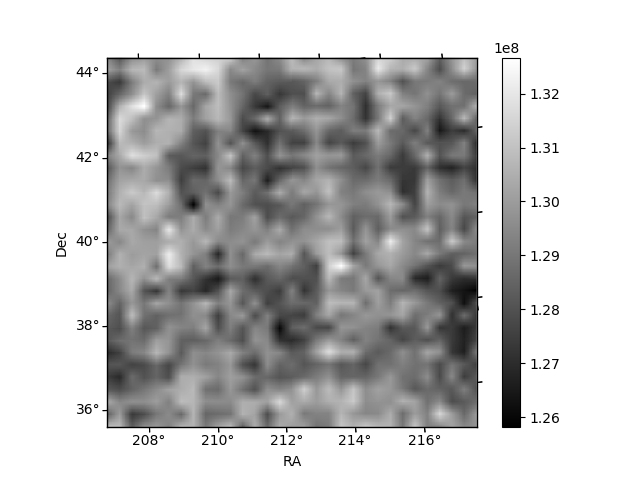
Quadrant B |
|---|---|---|---|
| Quadrant D | 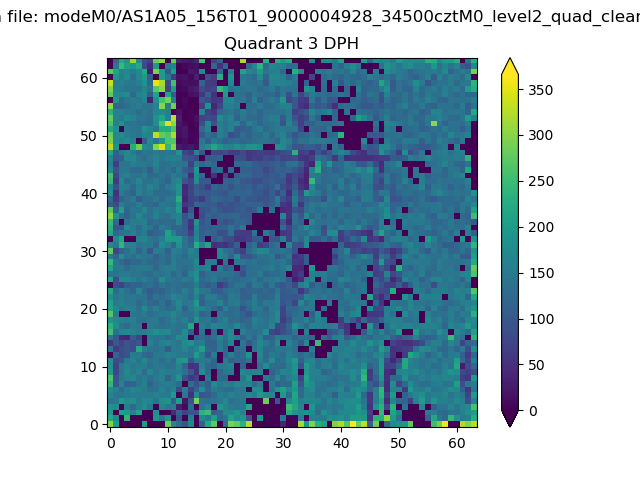 |
 |
Quadrant C |
| Plot type | Count rate plots | Images |
|---|---|---|
| Comparison with Poisson distribution Blue bars denote a histogram of data divided into 1 sec bins. Red curve is a Poisson curve with rate = median count rate of data. |
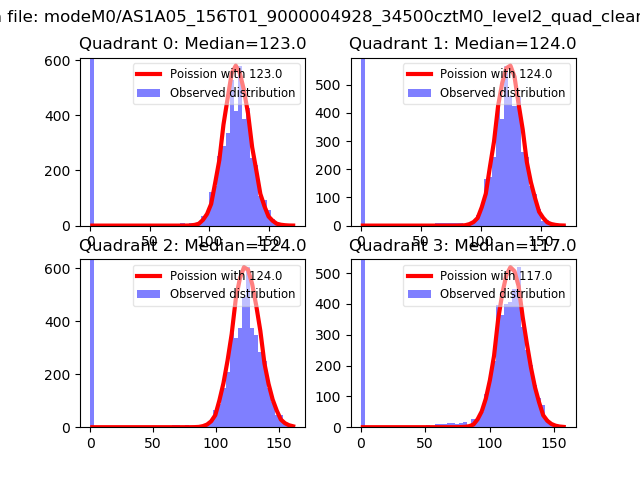 |
 |
| Quadrant-wise count rates Data is divided into 100 sec bins |
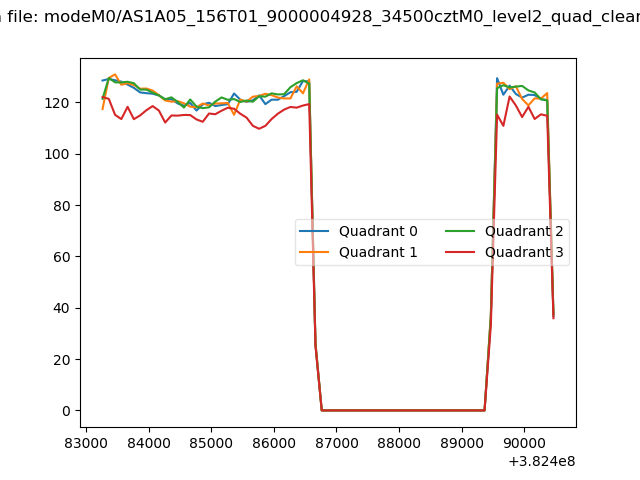 |
|
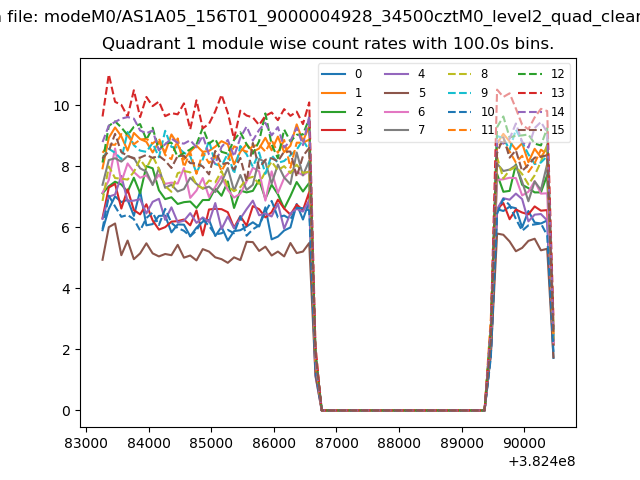
| Module-wise count rates for Quadrant A Data is divided into 100 sec bins |
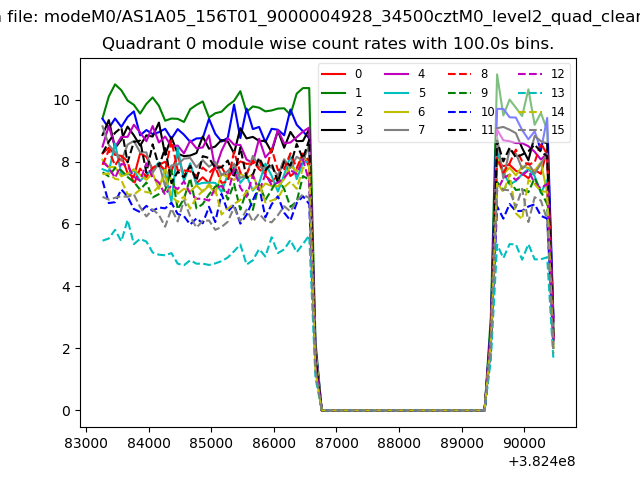 |
 |
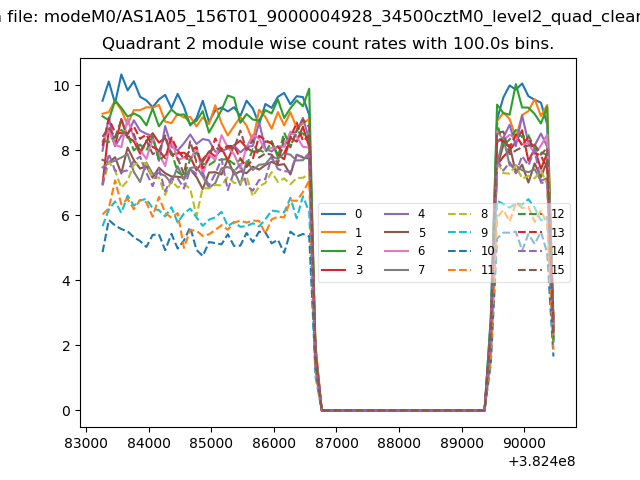
| Module-wise count rates for Quadrant B Data is divided into 100 sec bins |
 |
 |
| Module-wise count rates for Quadrant C Data is divided into 100 sec bins |
 |
 |
| Module-wise count rates for Quadrant D Data is divided into 100 sec bins |
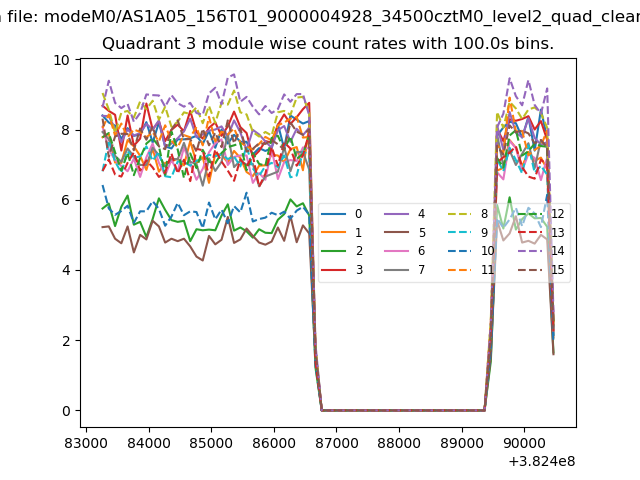 |
 |
| Parameter | Plot |
|---|---|
| CZT HV Monitor | 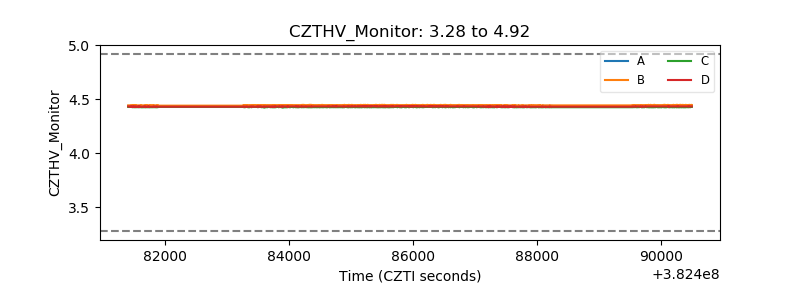 |
| D_VDD | 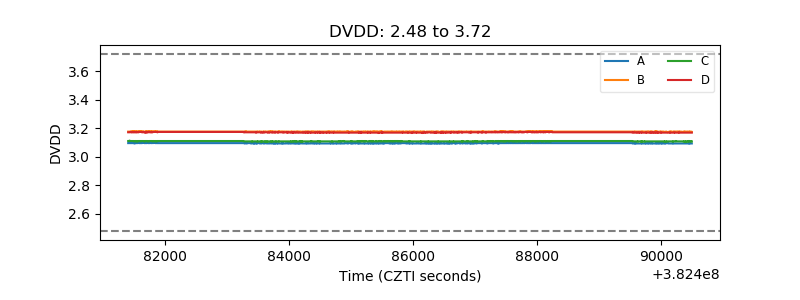 |
| Temperature 1 | 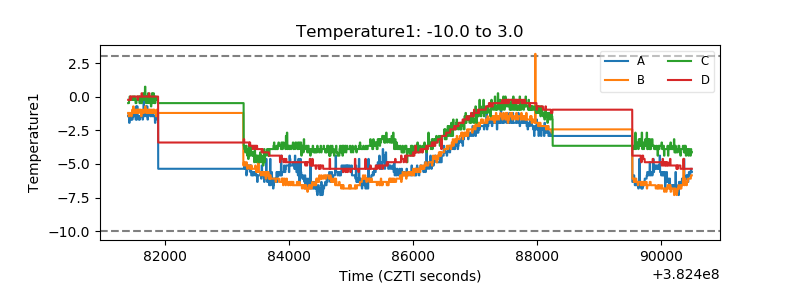 |
| Veto HV Monitor |  |
| Veto LLD | 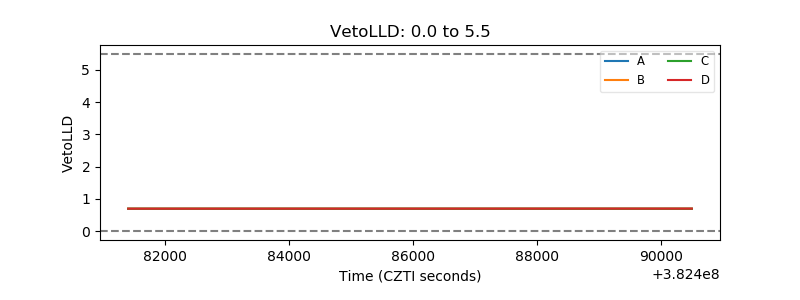 |
| Alpha Counter | 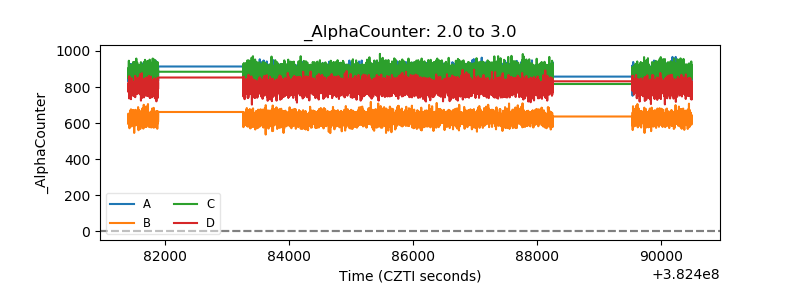 |
| _CPM_Rate | 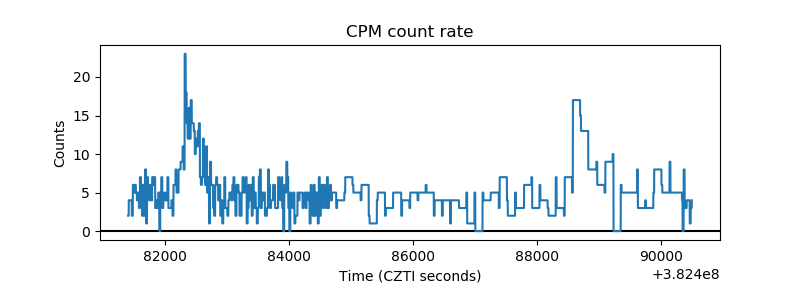 |
| CZT Counter | 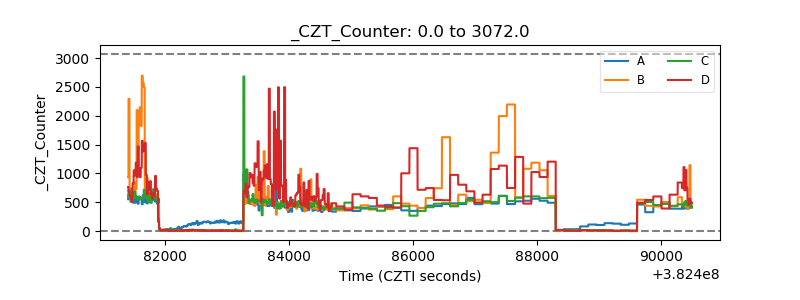 |
| +2.5 Volts monitor | 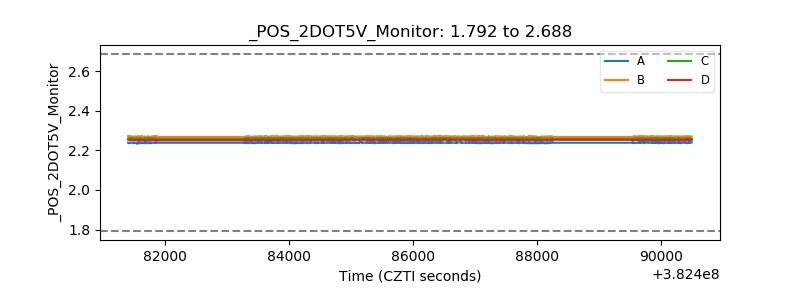 |
| +5 Volts monitor | 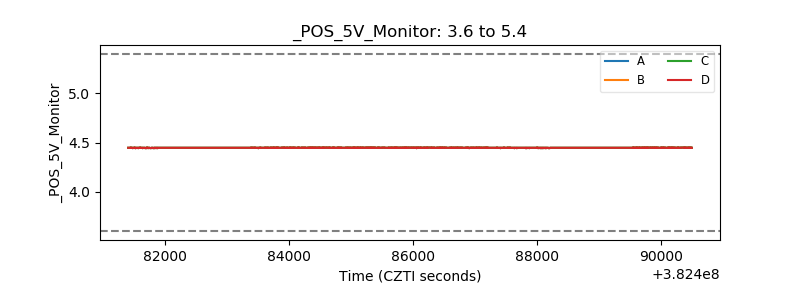 |
| _ROLL_ROT | 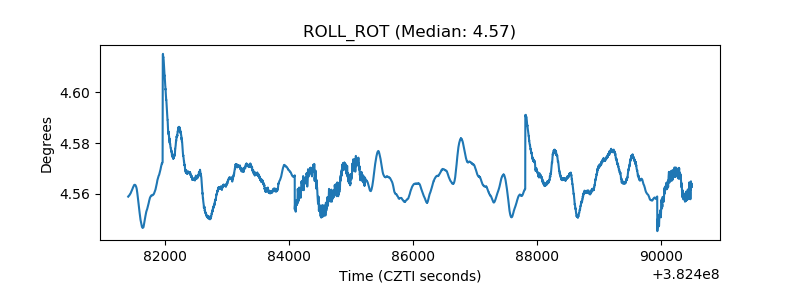 |
| _Roll_DEC | 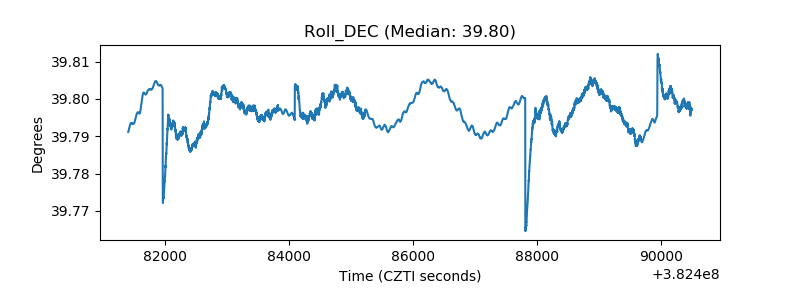 |
| _Roll_RA | 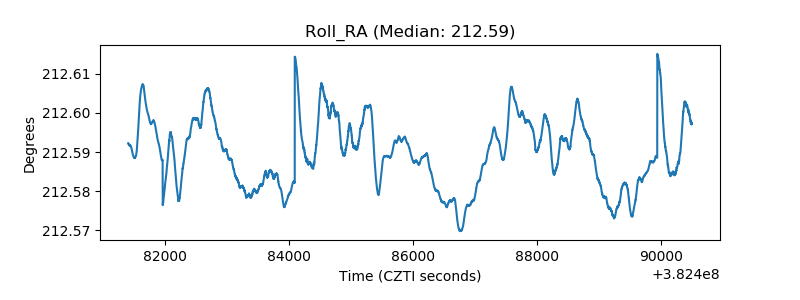 |
| Veto Counter | 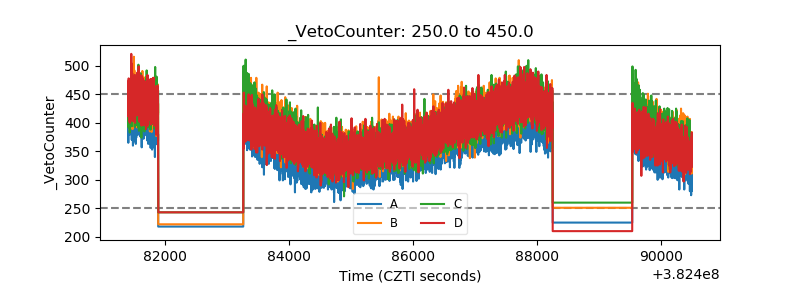 |