| Param | Original file | Final file |
|---|---|---|
| Filename | modeM0/AS1A05_156T01_9000004928_34498cztM0_level2.evt | modeM0/AS1A05_156T01_9000004928_34498cztM0_level2_quad_clean.evt |
| Size (bytes) | 521,026,560 | 90,144,000 |
| Size | 496.9 MB | 86.0 MB |
| Events in quadrant A | 2,765,847 | 604,380 |
| Events in quadrant B | 3,141,977 | 608,127 |
| Events in quadrant C | 2,968,859 | 604,803 |
| Events in quadrant D | 6,532,234 | 529,978 |
| Mode SS | |||
|---|---|---|---|
| Quadrant | BADHDUFLAG | Total packets | Discarded packets |
| A | 0 | 110 | 0 |
| B | 0 | 110 | 0 |
| C | 0 | 110 | 0 |
| D | 0 | 110 | 0 |
| Mode M0 | |||
|---|---|---|---|
| Quadrant | BADHDUFLAG | Total packets | Discarded packets |
| A | 0 | 11868 | 3 |
| B | 0 | 12926 | 2 |
| C | 0 | 12055 | 2 |
| D | 0 | 23312 | 2 |
| Mode M9 | |||
|---|---|---|---|
| Quadrant | BADHDUFLAG | Total packets | Discarded packets |
| A | 0 | 21 | 0 |
| B | 0 | 21 | 0 |
| C | 0 | 21 | 0 |
| D | 0 | 22 | 0 |
| Quadrant | Total seconds | Saturated seconds | Saturation percentage |
|---|---|---|---|
| A | 5465 | 41 | 0.750229% |
| B | 5465 | 213 | 3.897530% |
| C | 5465 | 84 | 1.537054% |
| D | 5465 | 1174 | 21.482159% |
Noise dominated data is calculated using 1-second bins in cleaned event files. If a bin has >2000 counts, and if more than 50% of those come from <1% of pixels, then it is considered to be noise-dominated and hence unusable.
| Quadrant | # 1 sec bins | Bins with >0 counts | Bins with >2000 counts | High rate bins dominated by noise | Noise dominated (total time) | Noise dominated (detector-on time) | Marked lightcurve |
|---|---|---|---|---|---|---|---|
| A | 7139 | 5466 | 26 | 26 | 0.36% | 0.48% | 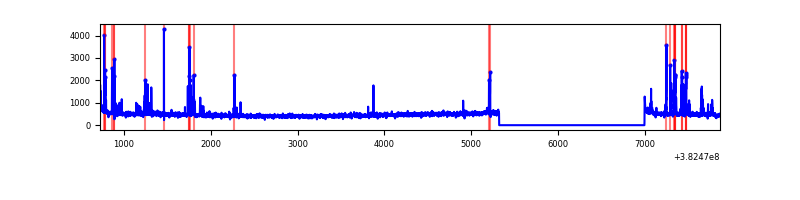 |
| B | 7139 | 5466 | 160 | 160 | 2.24% | 2.93% | 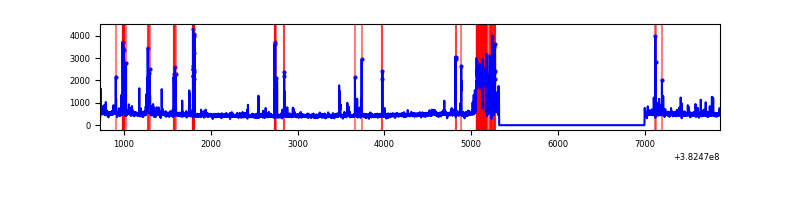 |
| C | 7139 | 5466 | 58 | 58 | 0.81% | 1.06% | 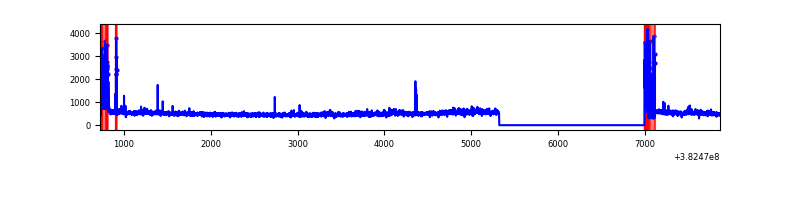 |
| D | 7139 | 5466 | 993 | 993 | 13.91% | 18.17% | 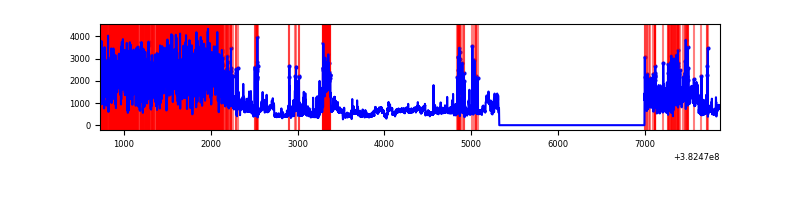 |
Top three noisy pixels from each quadrant. If the there are fewer than three noisy pixels in the level2.evt file, extra rows are filled as -1
| Pixel properties | Quadrant properties | ||||||
|---|---|---|---|---|---|---|---|
| Quadrant | DetID | PixID | Counts | Sigma | Mean | Median | Sigma |
| A | 15 | 169 | 167604 | 1308.68 | 633 | 620 | 127.6 |
| A | 9 | 143 | 65755 | 510.47 | 633 | 620 | 127.6 |
| A | 10 | 83 | 39134 | 301.84 | 633 | 620 | 127.6 |
| B | 5 | 172 | 551517 | 4654.4 | 617 | 601 | 118.4 |
| B | 0 | 189 | 69132 | 578.98 | 617 | 601 | 118.4 |
| B | 0 | 229 | 26128 | 215.66 | 617 | 601 | 118.4 |
| C | 15 | 214 | 231817 | 1619.52 | 616 | 621 | 142.8 |
| C | 0 | 10 | 198273 | 1384.55 | 616 | 621 | 142.8 |
| C | 14 | 67 | 90860 | 632.12 | 616 | 621 | 142.8 |
| D | 12 | 17 | 2527612 | 16577.51 | 560 | 549 | 152.4 |
| D | 8 | 195 | 847555 | 5556.35 | 560 | 549 | 152.4 |
| D | 2 | 249 | 174486 | 1141.02 | 560 | 549 | 152.4 |
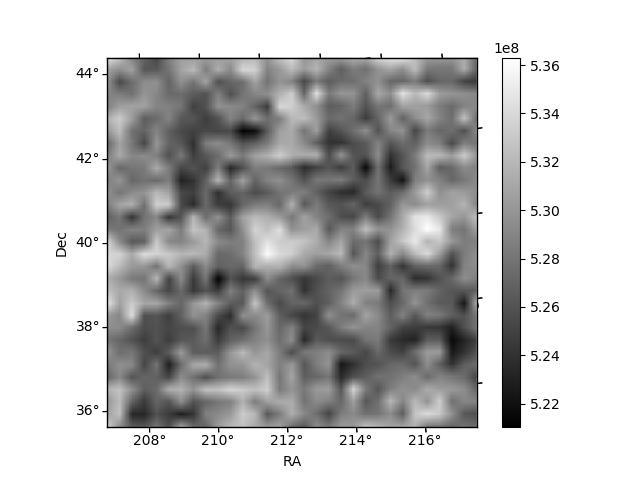
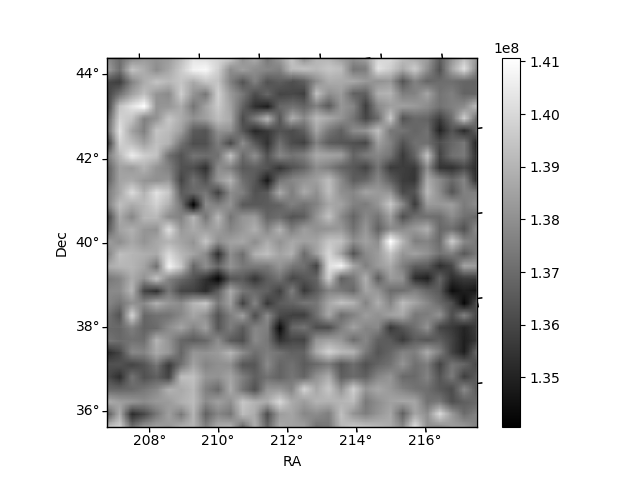
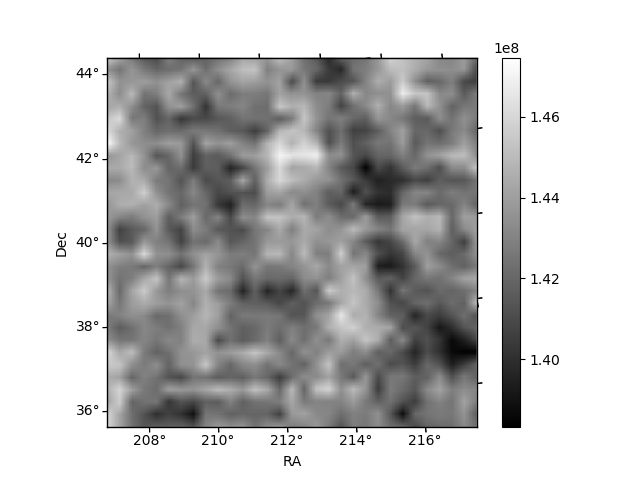
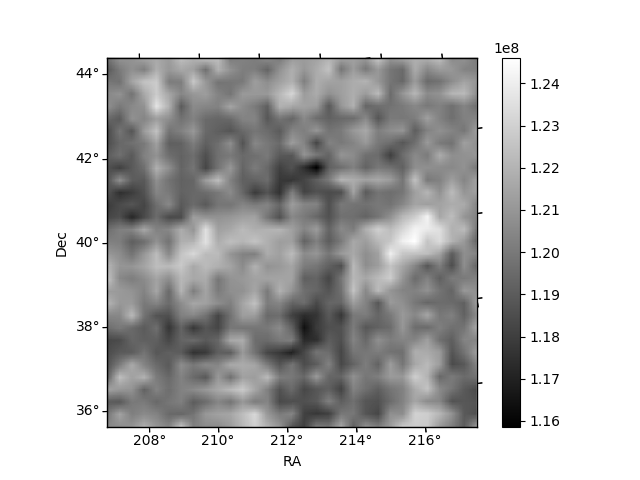
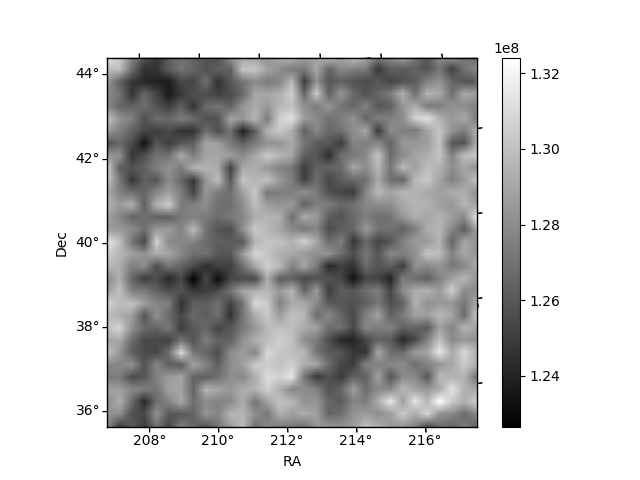
Histogram calculated using DETX and DETY for each event in the final _common_clean file
| Quadrant A | 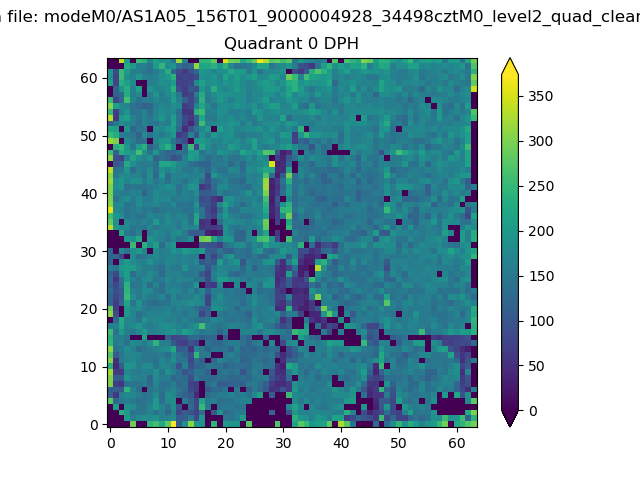 |
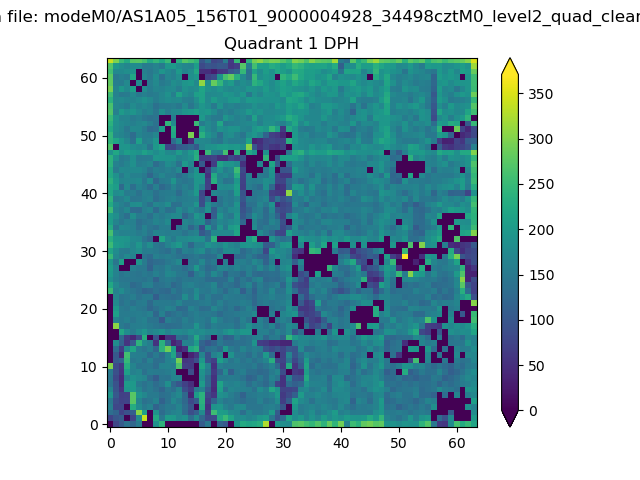 |
Quadrant B |
|---|---|---|---|
| Quadrant D | 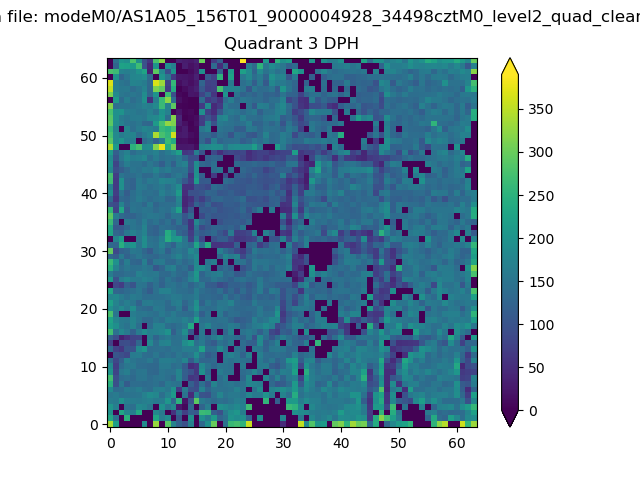 |
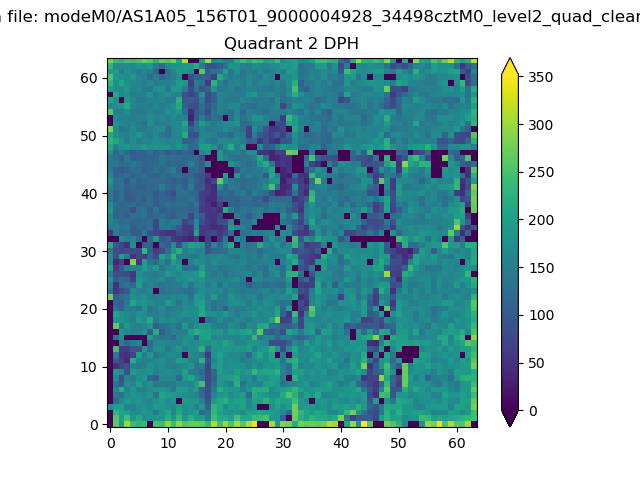 |
Quadrant C |
| Plot type | Count rate plots | Images |
|---|---|---|
| Comparison with Poisson distribution Blue bars denote a histogram of data divided into 1 sec bins. Red curve is a Poisson curve with rate = median count rate of data. |
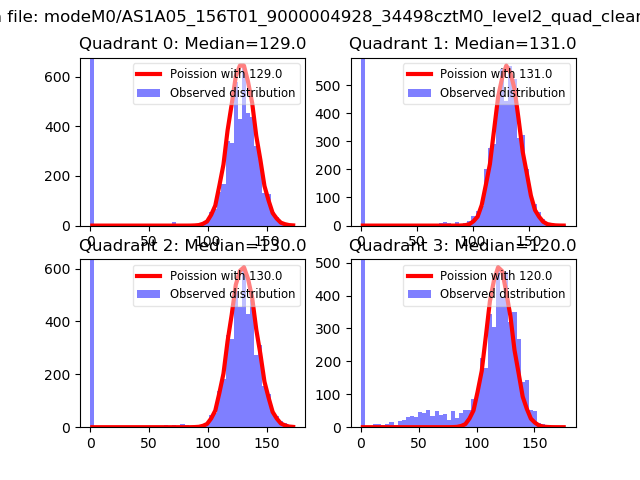 |
 |
| Quadrant-wise count rates Data is divided into 100 sec bins |
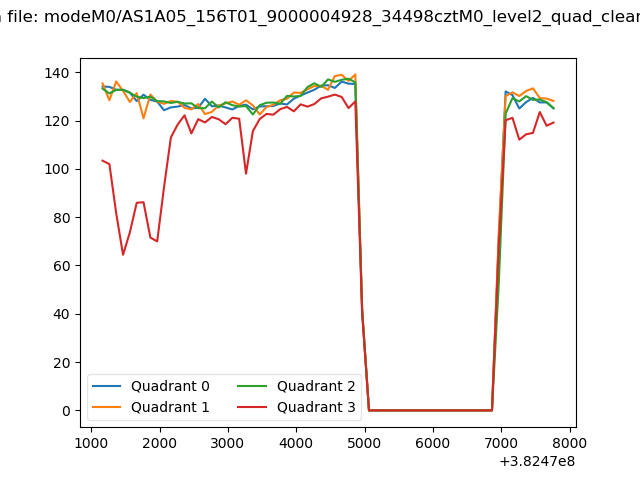 |
|
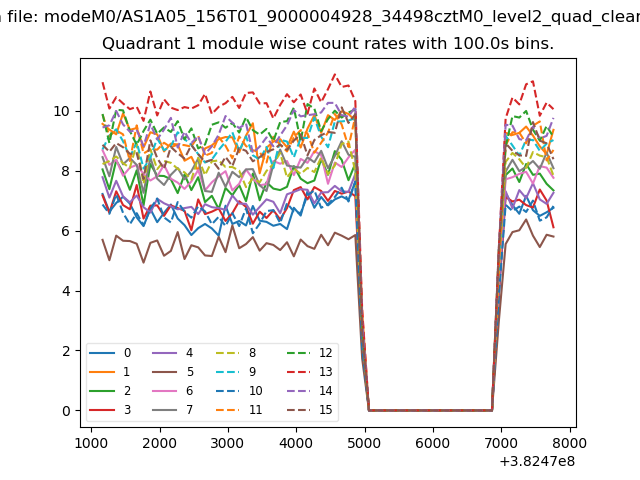
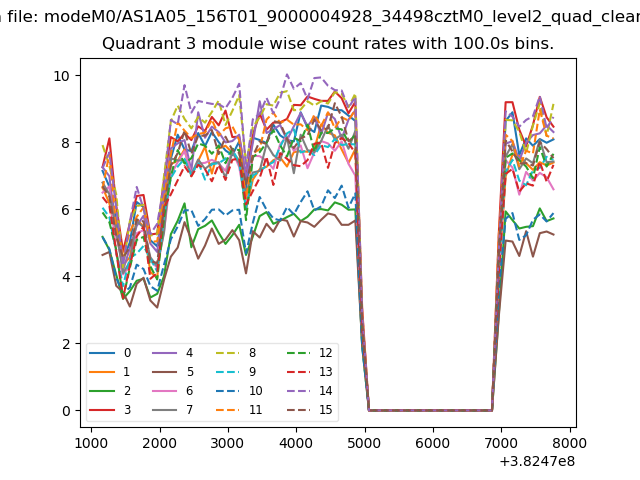
| Module-wise count rates for Quadrant A Data is divided into 100 sec bins |
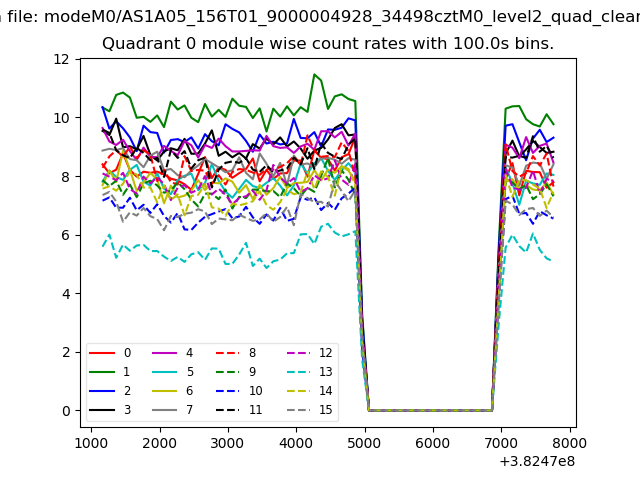 |
 |
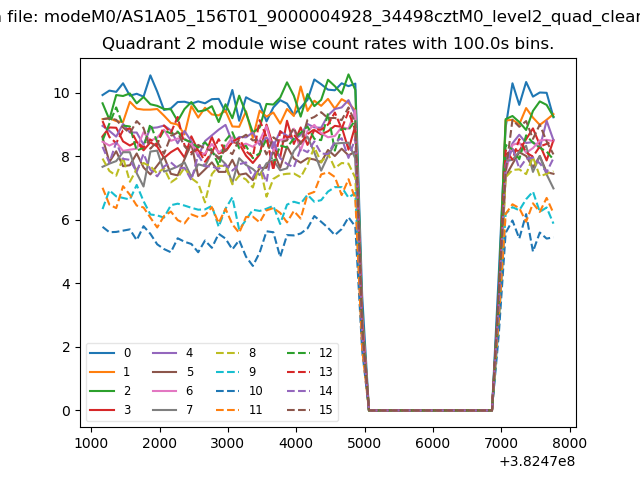
| Module-wise count rates for Quadrant B Data is divided into 100 sec bins |
 |
 |
| Module-wise count rates for Quadrant C Data is divided into 100 sec bins |
 |
 |
| Module-wise count rates for Quadrant D Data is divided into 100 sec bins |
 |
 |
| Parameter | Plot |
|---|---|
| CZT HV Monitor | 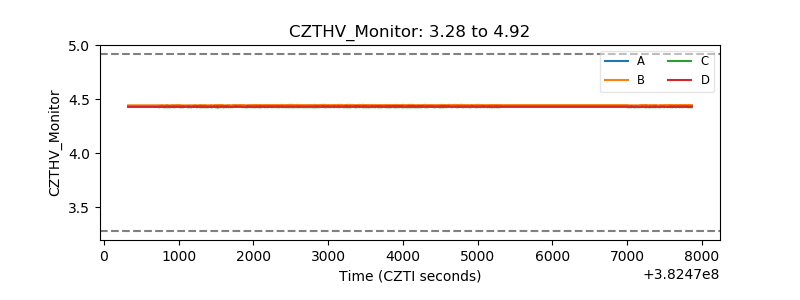 |
| D_VDD | 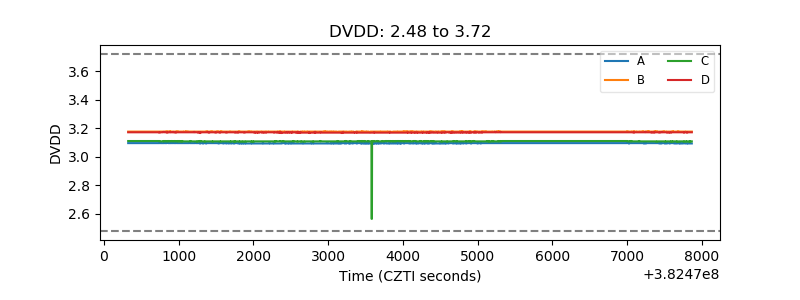 |
| Temperature 1 | 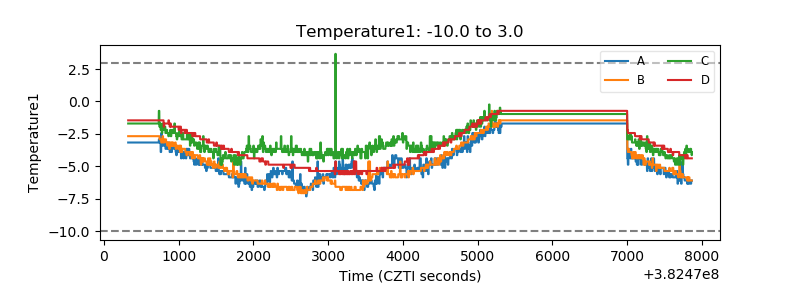 |
| Veto HV Monitor | 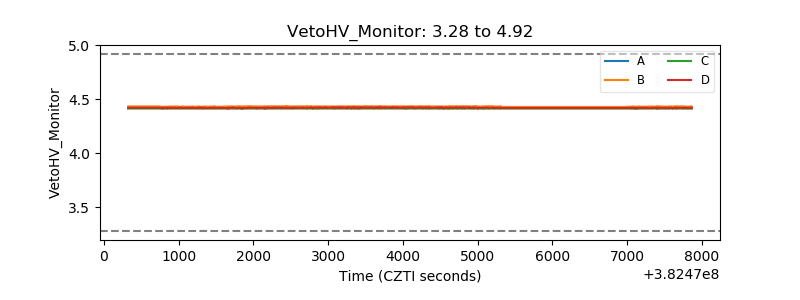 |
| Veto LLD | 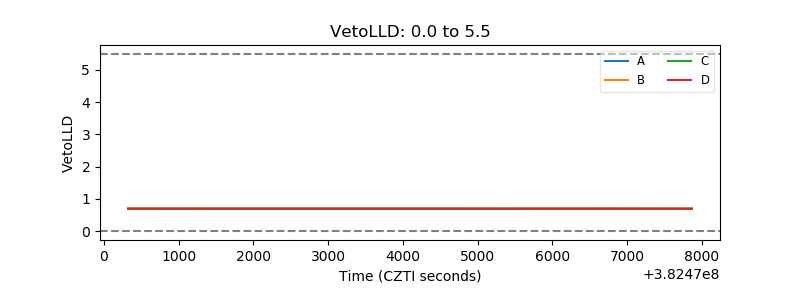 |
| Alpha Counter | 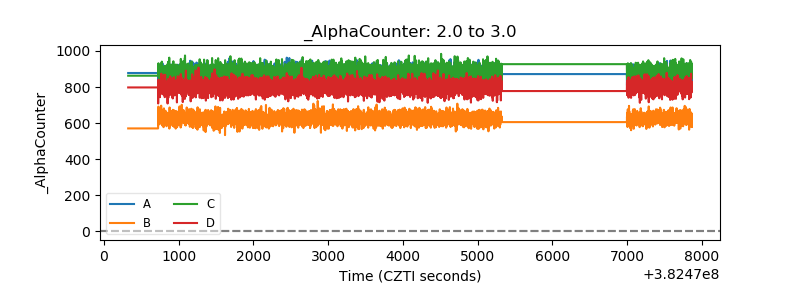 |
| _CPM_Rate | 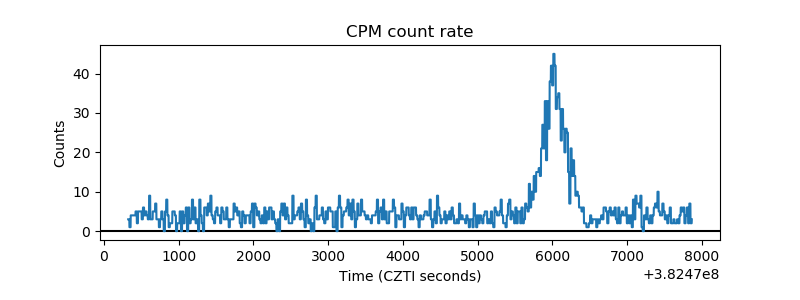 |
| CZT Counter | 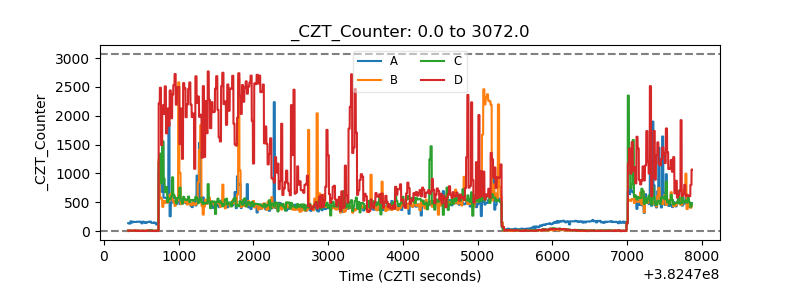 |
| +2.5 Volts monitor | 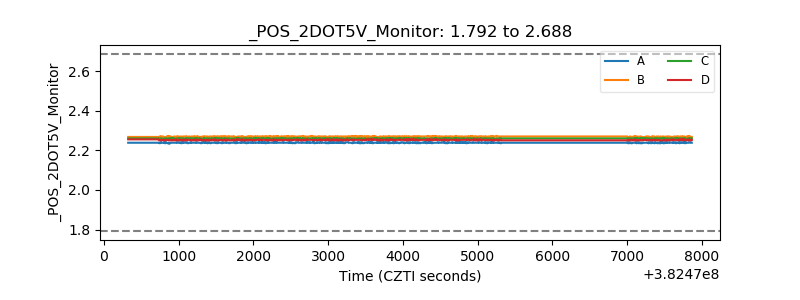 |
| +5 Volts monitor | 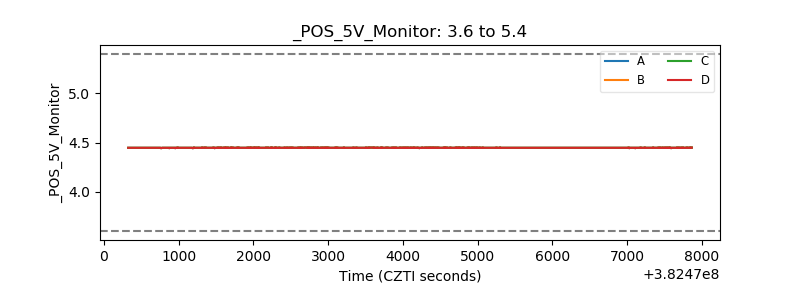 |
| _ROLL_ROT | 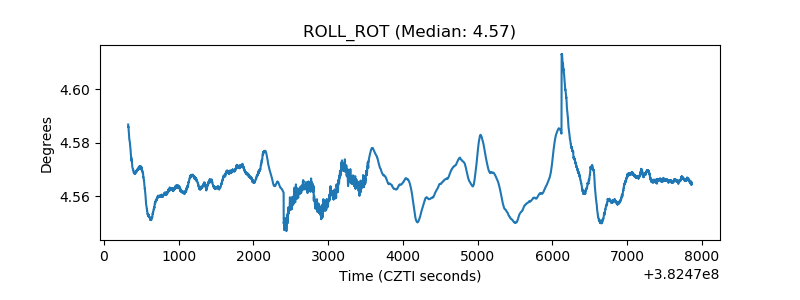 |
| _Roll_DEC | 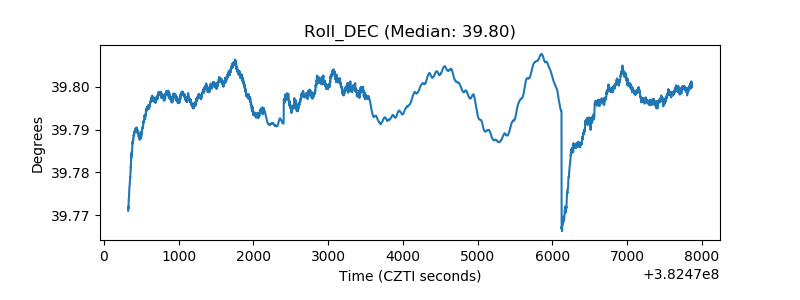 |
| _Roll_RA | 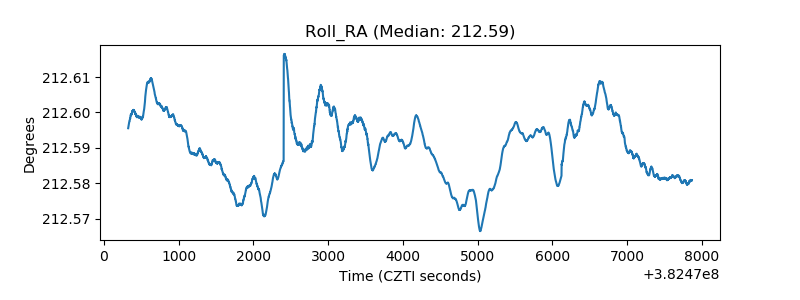 |
| Veto Counter | 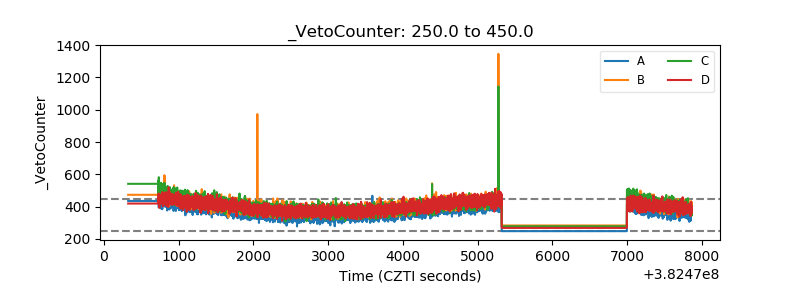 |