| Param | Original file | Final file |
|---|---|---|
| Filename | modeM0/AS1A05_156T01_9000004928cztM0_level2_bc.evt | modeM0/AS1A05_156T01_9000004928cztM0_level2_quad_clean.evt |
| Size (bytes) | 3,969,941,760 | 1,028,462,400 |
| Size | 3.7 GB | 980.8 MB |
| Events in quadrant A | 18,309,026 | 6,595,964 |
| Events in quadrant B | 27,515,833 | 6,568,382 |
| Events in quadrant C | 21,812,560 | 6,582,189 |
| Events in quadrant D | 47,262,653 | 6,026,565 |
| Mode SS | |||
|---|---|---|---|
| Quadrant | BADHDUFLAG | Total packets | Discarded packets |
| A | 0 | 1602 | 0 |
| B | 0 | 1602 | 0 |
| C | 0 | 1602 | 0 |
| D | 0 | 1602 | 0 |
| Mode M0 | |||
|---|---|---|---|
| Quadrant | BADHDUFLAG | Total packets | Discarded packets |
| A | 0 | 164773 | 0 |
| B | 0 | 206706 | 0 |
| C | 0 | 170320 | 0 |
| D | 0 | 270248 | 0 |
| Mode M9 | |||
|---|---|---|---|
| Quadrant | BADHDUFLAG | Total packets | Discarded packets |
| A | 0 | 326 | 0 |
| B | 0 | 326 | 0 |
| C | 0 | 326 | 0 |
| D | 0 | 326 | 0 |
| Quadrant | Total seconds | Saturated seconds | Saturation percentage |
|---|---|---|---|
| A | 78455 | 203 | 0.258747% |
| B | 78455 | 4430 | 5.646549% |
| C | 78455 | 367 | 0.467784% |
| D | 78455 | 6310 | 8.042827% |
Noise dominated data is calculated using 1-second bins in cleaned event files. If a bin has >2000 counts, and if more than 50% of those come from <1% of pixels, then it is considered to be noise-dominated and hence unusable.
| Quadrant | # 1 sec bins | Bins with >0 counts | Bins with >2000 counts | High rate bins dominated by noise | Noise dominated (total time) | Noise dominated (detector-on time) | Marked lightcurve |
|---|---|---|---|---|---|---|---|
| A | 110880 | 78470 | 19 | 19 | 0.02% | 0.02% | 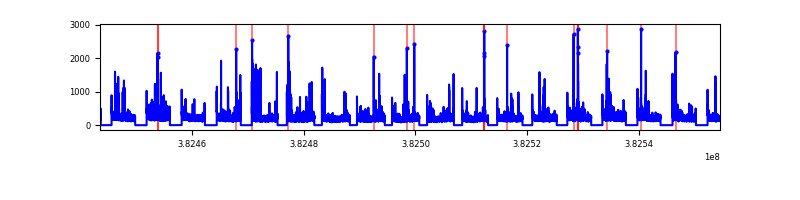 |
| B | 110880 | 78456 | 196 | 196 | 0.18% | 0.25% | 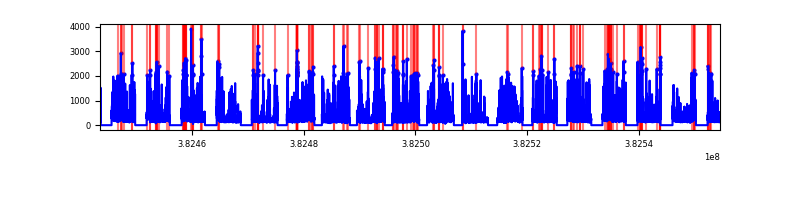 |
| C | 110880 | 78458 | 82 | 82 | 0.07% | 0.10% |  |
| D | 110880 | 78456 | 918 | 918 | 0.83% | 1.17% | 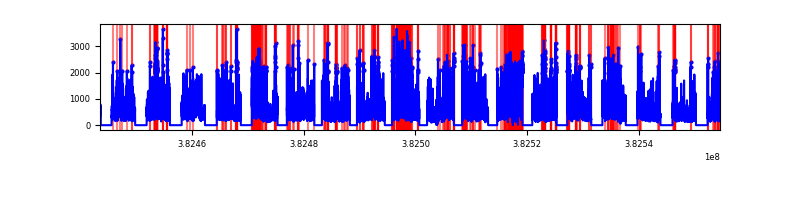 |
Top three noisy pixels from each quadrant. If the there are fewer than three noisy pixels in the level2.evt file, extra rows are filled as -1
| Pixel properties | Quadrant properties | ||||||
|---|---|---|---|---|---|---|---|
| Quadrant | DetID | PixID | Counts | Sigma | Mean | Median | Sigma |
| A | 9 | 143 | 432643 | 455.54 | 4302 | 4243 | 940.4 |
| A | 10 | 83 | 375991 | 395.3 | 4302 | 4243 | 940.4 |
| A | 15 | 169 | 358510 | 376.71 | 4302 | 4243 | 940.4 |
| B | 5 | 172 | 6988542 | 8599.33 | 4188 | 4117 | 812.2 |
| B | 0 | 229 | 1140308 | 1398.9 | 4188 | 4117 | 812.2 |
| B | 5 | 63 | 784956 | 961.38 | 4188 | 4117 | 812.2 |
| C | 15 | 214 | 3150974 | 3337.71 | 4178 | 4163 | 942.8 |
| C | 14 | 67 | 1098648 | 1160.88 | 4178 | 4163 | 942.8 |
| C | 0 | 10 | 758574 | 800.18 | 4178 | 4163 | 942.8 |
| D | 8 | 195 | 12848363 | 13384.21 | 4077 | 3963 | 959.7 |
| D | 12 | 17 | 5423296 | 5647.09 | 4077 | 3963 | 959.7 |
| D | 2 | 250 | 2497578 | 2598.41 | 4077 | 3963 | 959.7 |
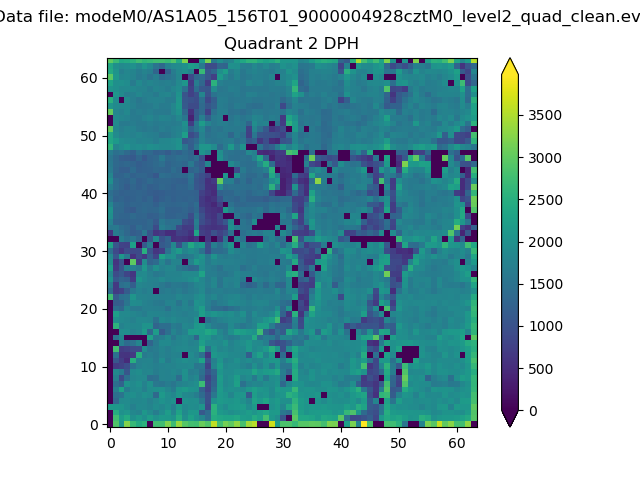
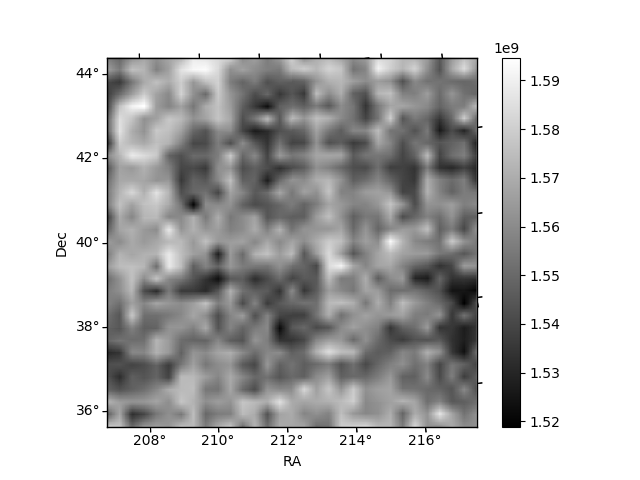
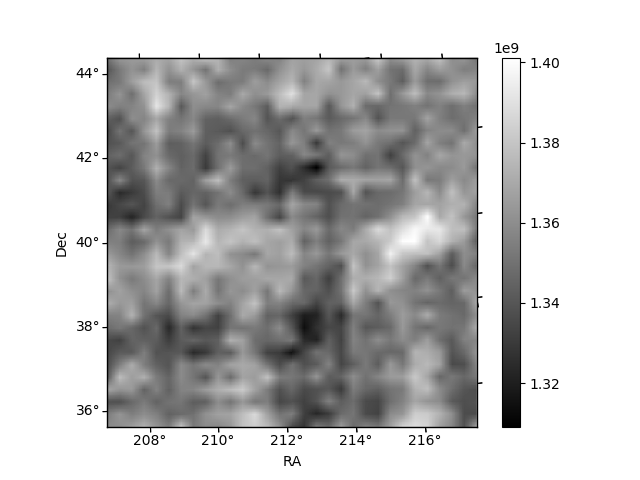
Histogram calculated using DETX and DETY for each event in the final _common_clean file
| Quadrant A | 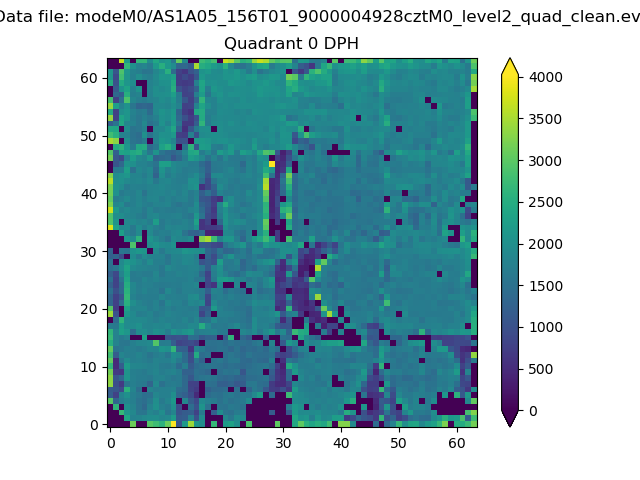 |
 |
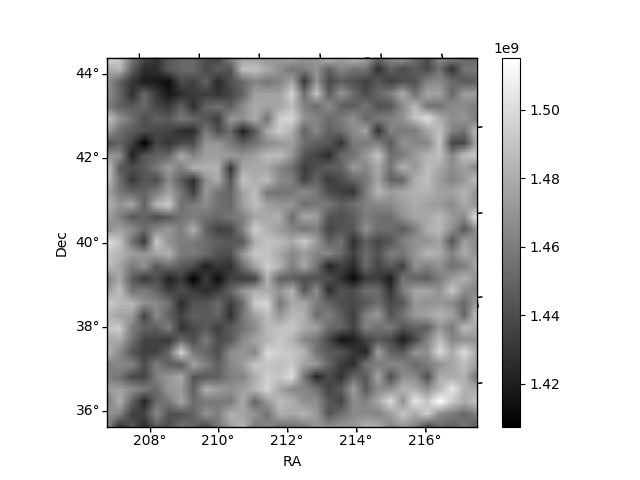
Quadrant B |
|---|---|---|---|
| Quadrant D | 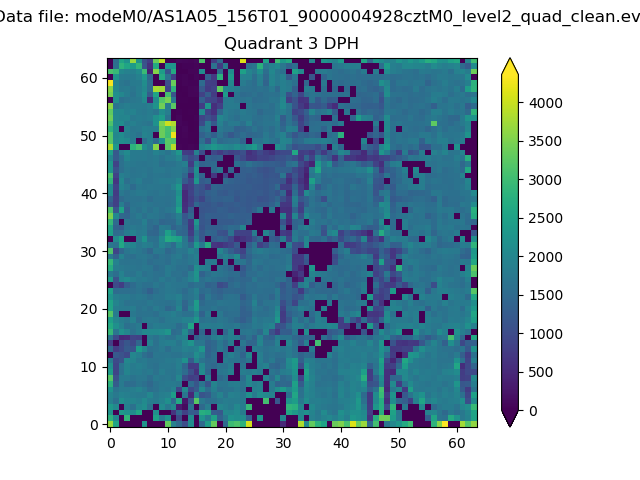 |
 |
Quadrant C |
| Plot type | Count rate plots | Images |
|---|---|---|
| Comparison with Poisson distribution Blue bars denote a histogram of data divided into 1 sec bins. Red curve is a Poisson curve with rate = median count rate of data. |
 |
 |
| Quadrant-wise count rates Data is divided into 100 sec bins |
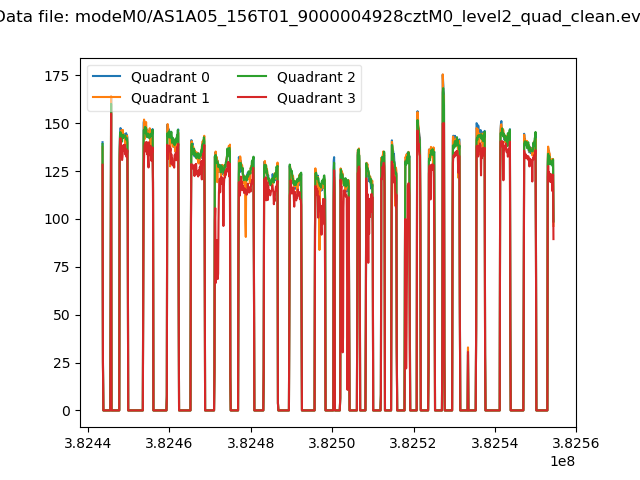 |
|
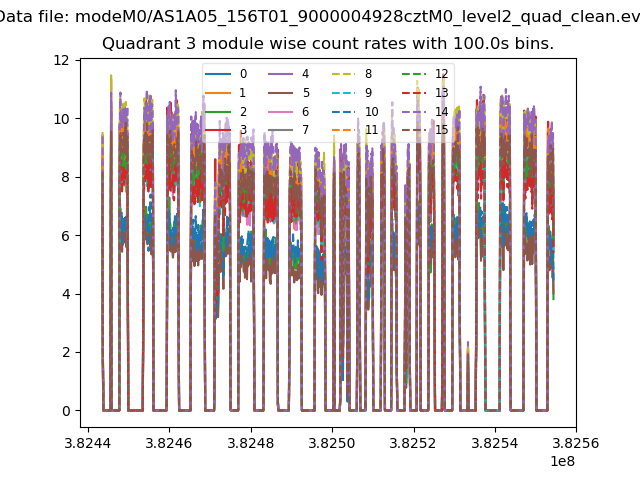
| Module-wise count rates for Quadrant A Data is divided into 100 sec bins |
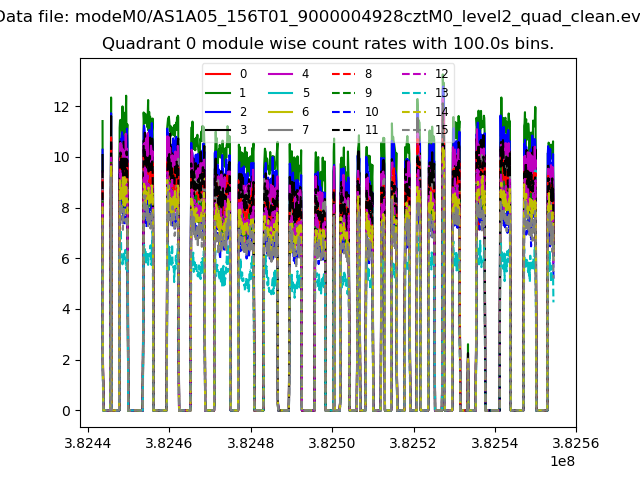 |
 |
| Module-wise count rates for Quadrant B Data is divided into 100 sec bins |
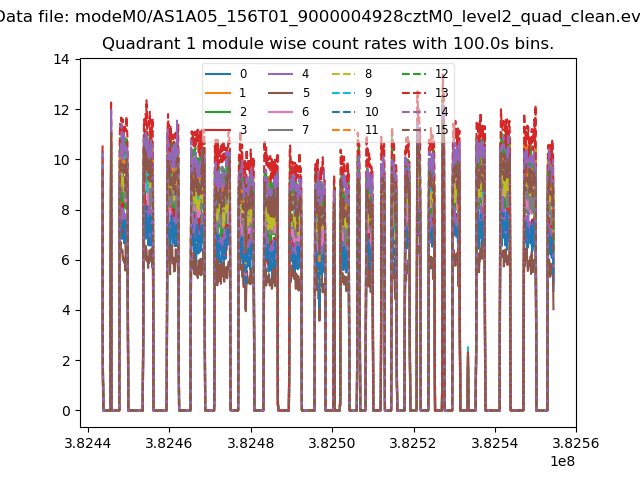 |
 |
| Module-wise count rates for Quadrant C Data is divided into 100 sec bins |
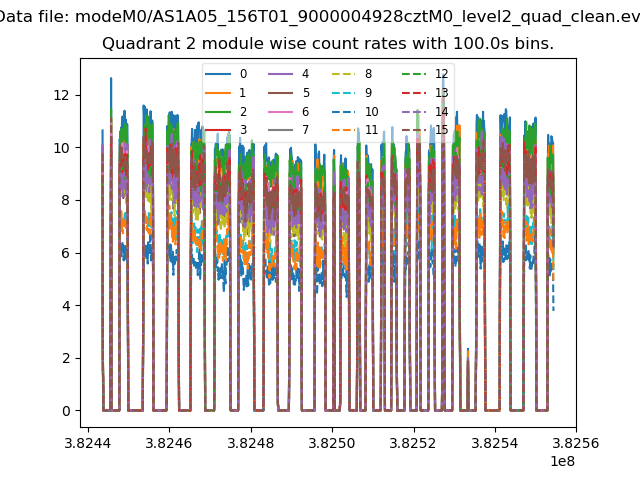 |
 |
| Module-wise count rates for Quadrant D Data is divided into 100 sec bins |
 |
 |
| Parameter | Plot |
|---|---|
| CZT HV Monitor | 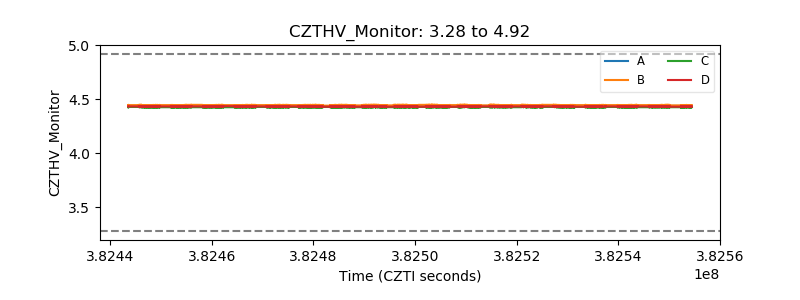 |
| D_VDD | 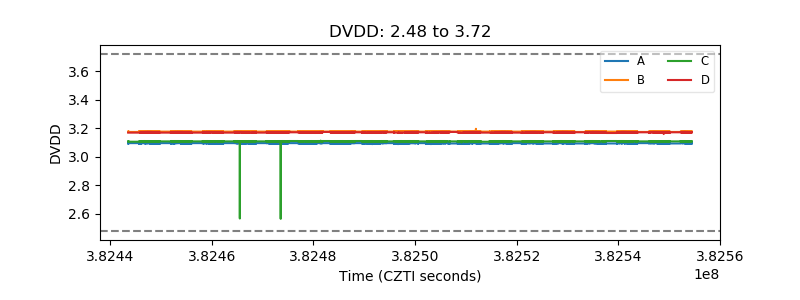 |
| Temperature 1 | 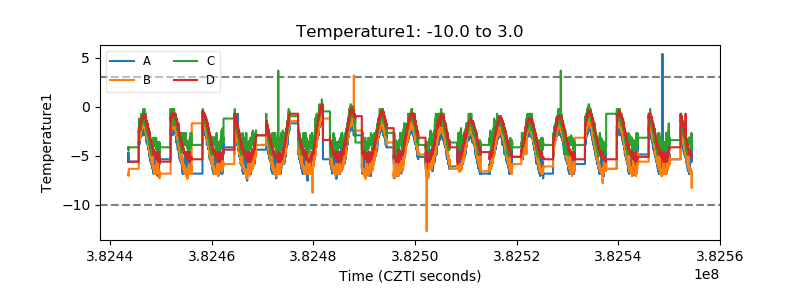 |
| Veto HV Monitor | 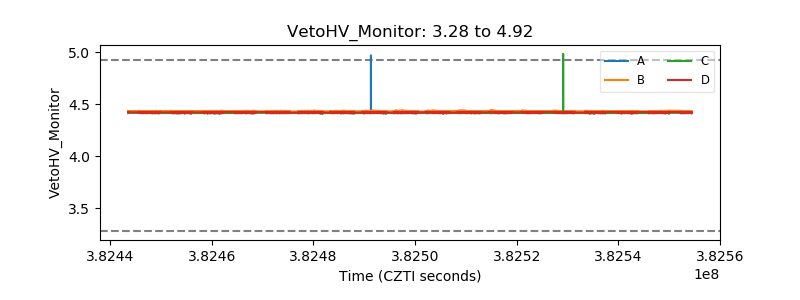 |
| Veto LLD |  |
| Alpha Counter |  |
| _CPM_Rate | 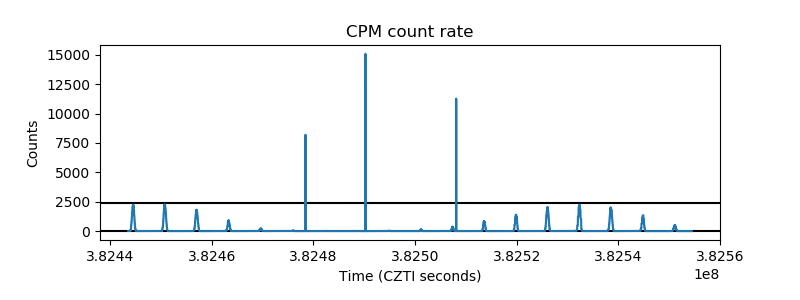 |
| CZT Counter | 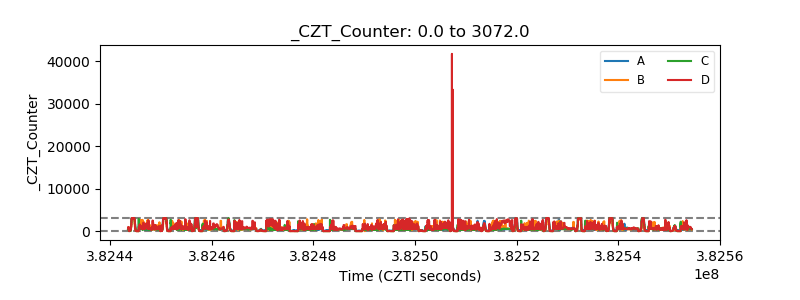 |
| +2.5 Volts monitor |  |
| +5 Volts monitor | 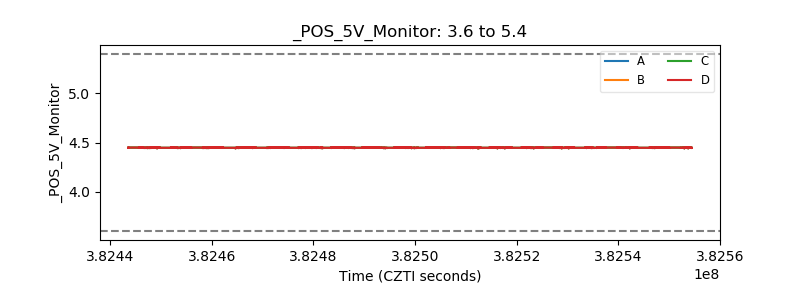 |
| _ROLL_ROT | 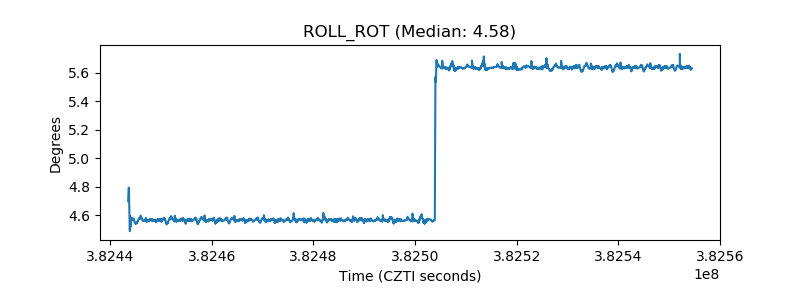 |
| _Roll_DEC | 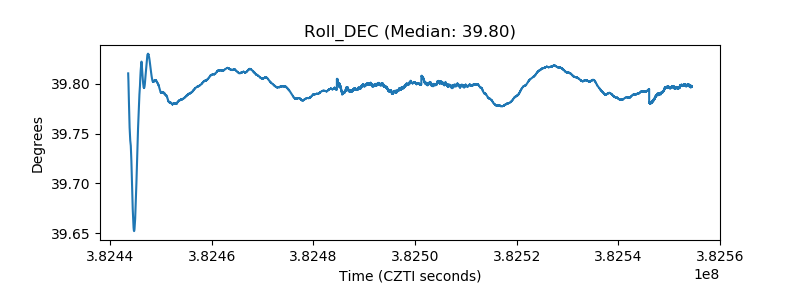 |
| _Roll_RA | 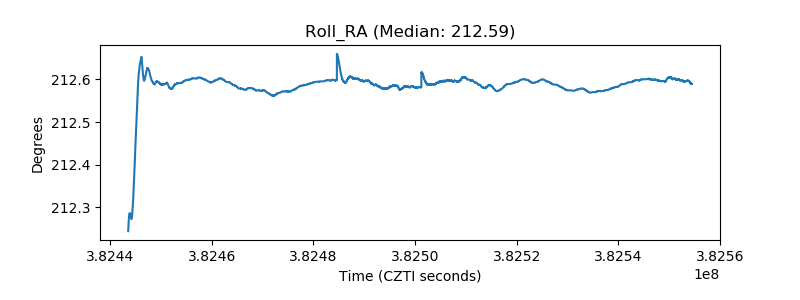 |
| Veto Counter | 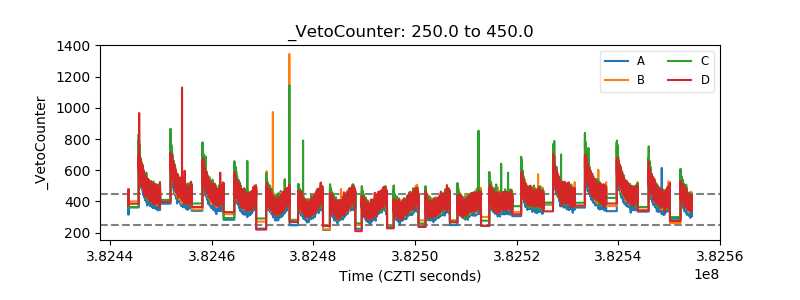 |