| Param | Original file | Final file |
|---|---|---|
| Filename | modeM0/AS1A10_071T14_9000004924_34492cztM0_level2.evt | modeM0/AS1A10_071T14_9000004924_34492cztM0_level2_quad_clean.evt |
| Size (bytes) | 1,298,160,000 | 217,261,440 |
| Size | 1.2 GB | 207.2 MB |
| Events in quadrant A | 10,473,954 | 1,378,570 |
| Events in quadrant B | 9,258,288 | 1,421,722 |
| Events in quadrant C | 7,689,287 | 1,416,436 |
| Events in quadrant D | 10,881,621 | 1,328,702 |
| Mode M0 | |||
|---|---|---|---|
| Quadrant | BADHDUFLAG | Total packets | Discarded packets |
| A | 0 | 41262 | 3 |
| B | 0 | 37497 | 3 |
| C | 0 | 31901 | 3 |
| D | 0 | 42566 | 3 |
| Mode SS | |||
|---|---|---|---|
| Quadrant | BADHDUFLAG | Total packets | Discarded packets |
| A | 0 | 306 | 0 |
| B | 0 | 306 | 0 |
| C | 0 | 306 | 0 |
| D | 0 | 306 | 0 |
| Mode M9 | |||
|---|---|---|---|
| Quadrant | BADHDUFLAG | Total packets | Discarded packets |
| A | 0 | 47 | 0 |
| B | 0 | 47 | 0 |
| C | 0 | 47 | 0 |
| D | 0 | 47 | 0 |
| Quadrant | Total seconds | Saturated seconds | Saturation percentage |
|---|---|---|---|
| A | 14995 | 1243 | 8.289430% |
| B | 14995 | 803 | 5.355118% |
| C | 14995 | 55 | 0.366789% |
| D | 14995 | 661 | 4.408136% |
Noise dominated data is calculated using 1-second bins in cleaned event files. If a bin has >2000 counts, and if more than 50% of those come from <1% of pixels, then it is considered to be noise-dominated and hence unusable.
| Quadrant | # 1 sec bins | Bins with >0 counts | Bins with >2000 counts | High rate bins dominated by noise | Noise dominated (total time) | Noise dominated (detector-on time) | Marked lightcurve |
|---|---|---|---|---|---|---|---|
| A | 19713 | 14998 | 836 | 836 | 4.24% | 5.57% | 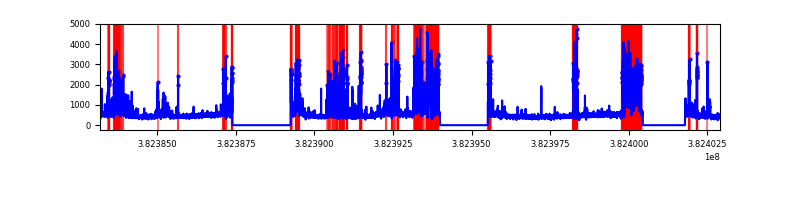 |
| B | 19713 | 14998 | 502 | 502 | 2.55% | 3.35% | 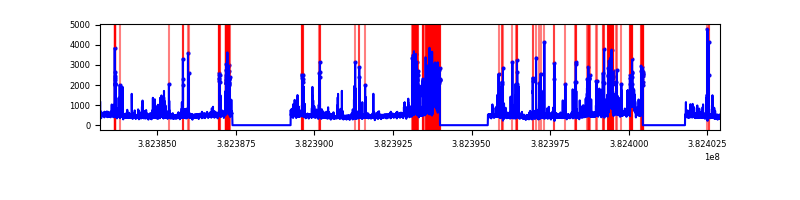 |
| C | 19713 | 14998 | 37 | 37 | 0.19% | 0.25% | 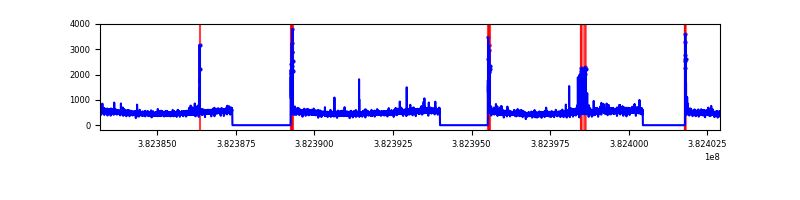 |
| D | 19713 | 14998 | 579 | 579 | 2.94% | 3.86% | 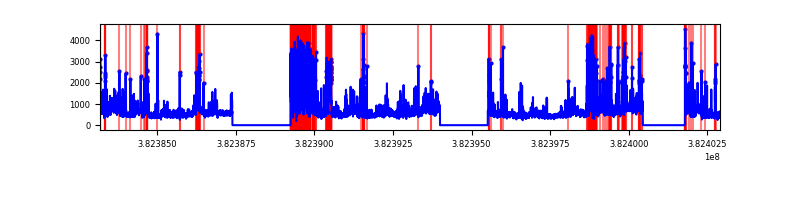 |
Top three noisy pixels from each quadrant. If the there are fewer than three noisy pixels in the level2.evt file, extra rows are filled as -1
| Pixel properties | Quadrant properties | ||||||
|---|---|---|---|---|---|---|---|
| Quadrant | DetID | PixID | Counts | Sigma | Mean | Median | Sigma |
| A | 15 | 169 | 3811436 | 11274.91 | 1688 | 1657 | 337.9 |
| A | 10 | 83 | 63534 | 183.12 | 1688 | 1657 | 337.9 |
| A | 9 | 143 | 34515 | 97.24 | 1688 | 1657 | 337.9 |
| B | 5 | 172 | 1862122 | 5737.65 | 1703 | 1661 | 324.3 |
| B | 0 | 229 | 218039 | 667.31 | 1703 | 1661 | 324.3 |
| B | 0 | 189 | 210238 | 643.25 | 1703 | 1661 | 324.3 |
| C | 15 | 214 | 627548 | 1601.44 | 1708 | 1727 | 390.8 |
| C | 0 | 10 | 151796 | 384.02 | 1708 | 1727 | 390.8 |
| C | 15 | 208 | 134700 | 340.27 | 1708 | 1727 | 390.8 |
| D | 8 | 195 | 1422157 | 3463.93 | 1681 | 1638 | 410.1 |
| D | 7 | 223 | 1036014 | 2522.32 | 1681 | 1638 | 410.1 |
| D | 2 | 250 | 779608 | 1897.08 | 1681 | 1638 | 410.1 |
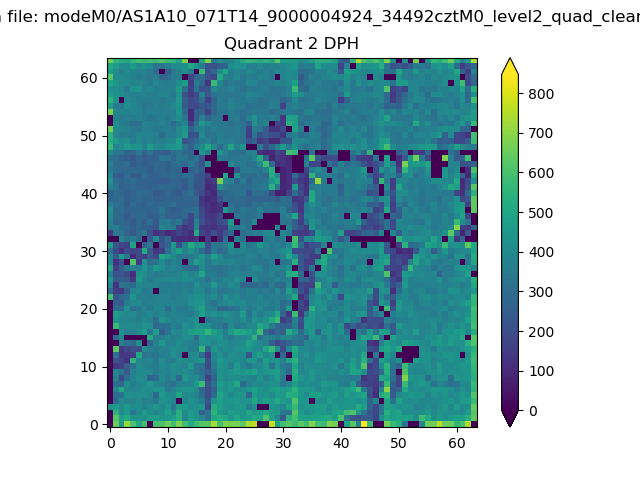
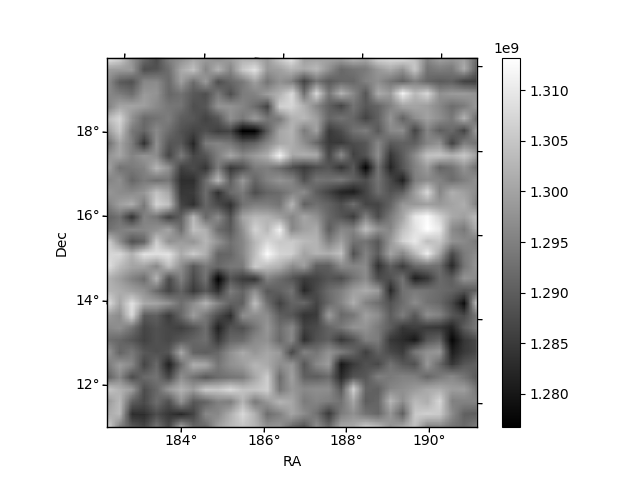
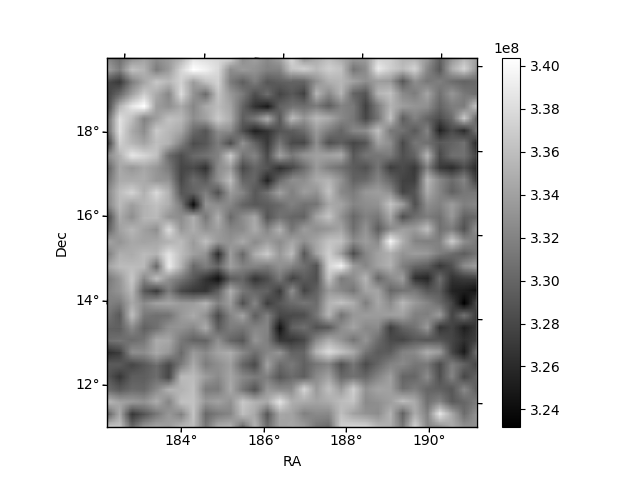
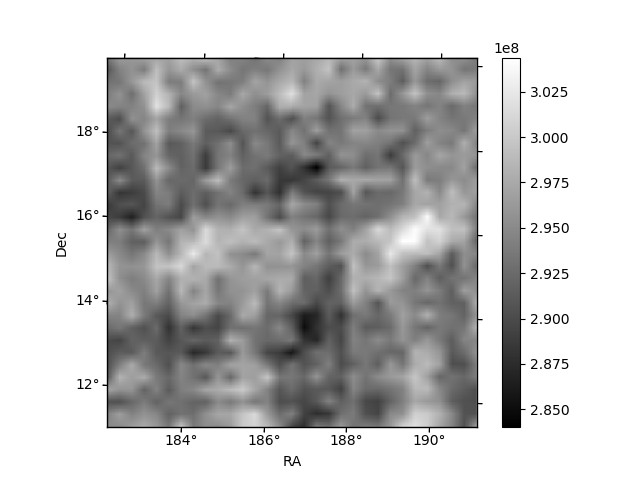
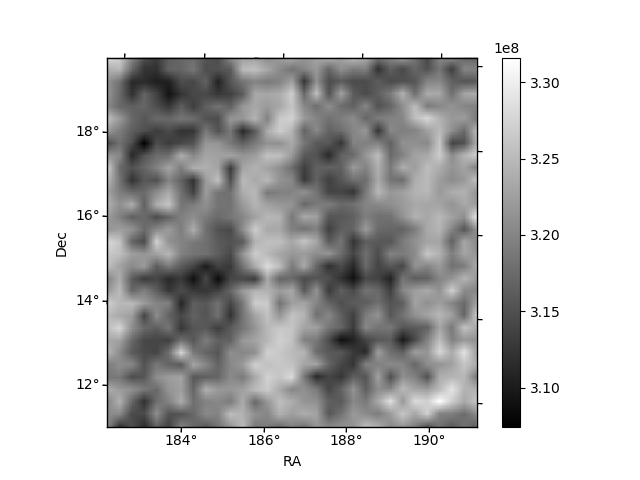
Histogram calculated using DETX and DETY for each event in the final _common_clean file
| Quadrant A | 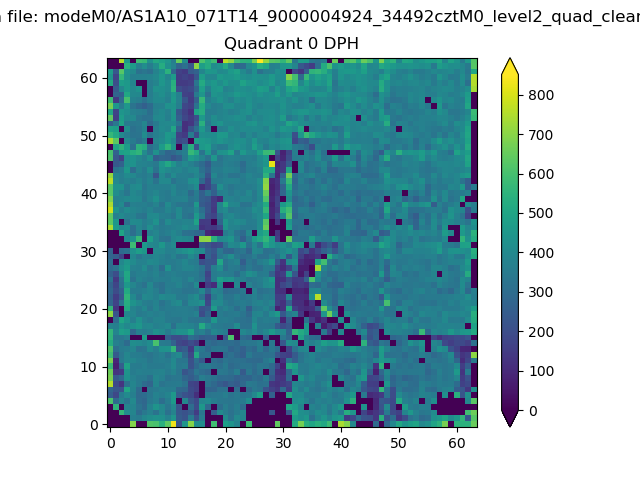 |
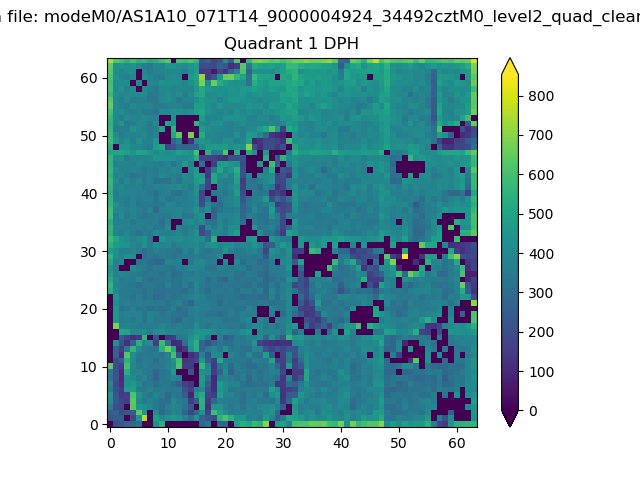 |
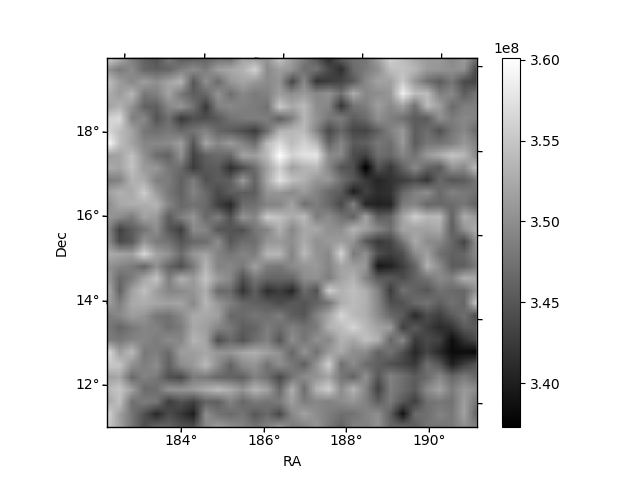
Quadrant B |
|---|---|---|---|
| Quadrant D | 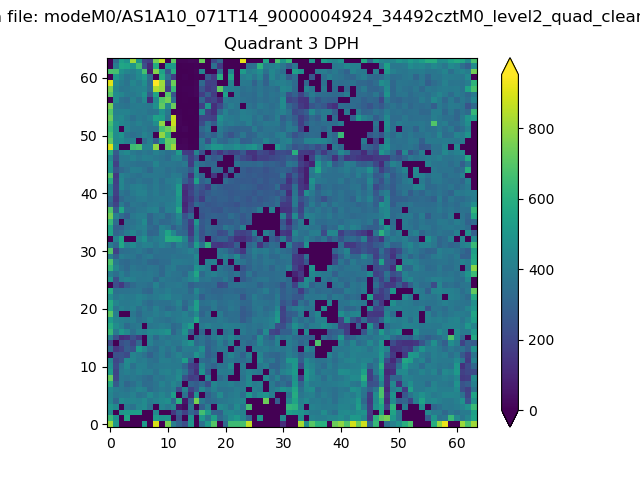 |
 |
Quadrant C |
| Plot type | Count rate plots | Images |
|---|---|---|
| Comparison with Poisson distribution Blue bars denote a histogram of data divided into 1 sec bins. Red curve is a Poisson curve with rate = median count rate of data. |
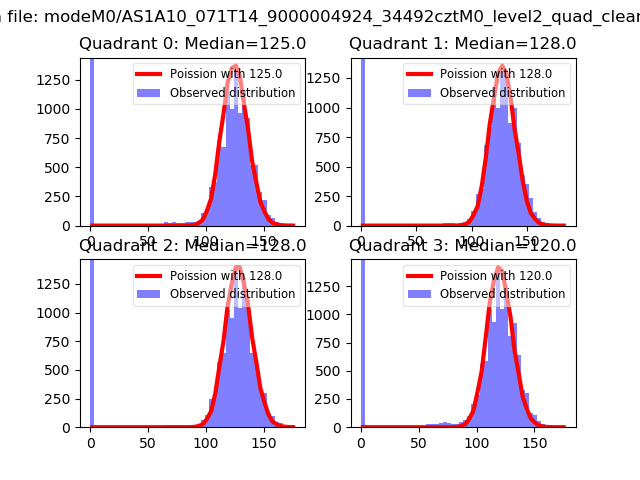 |
 |
| Quadrant-wise count rates Data is divided into 100 sec bins |
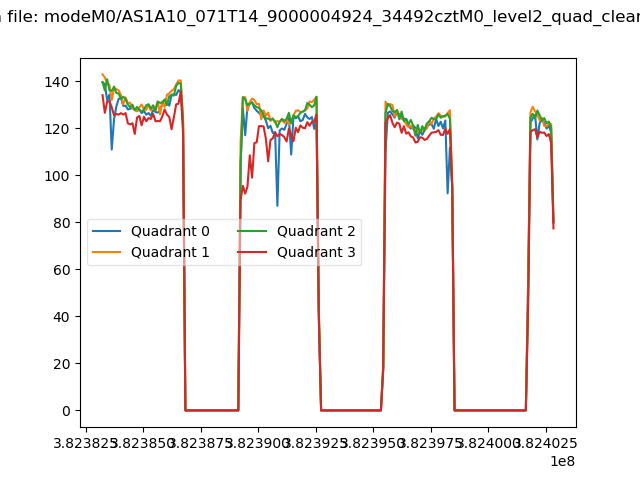 |
|
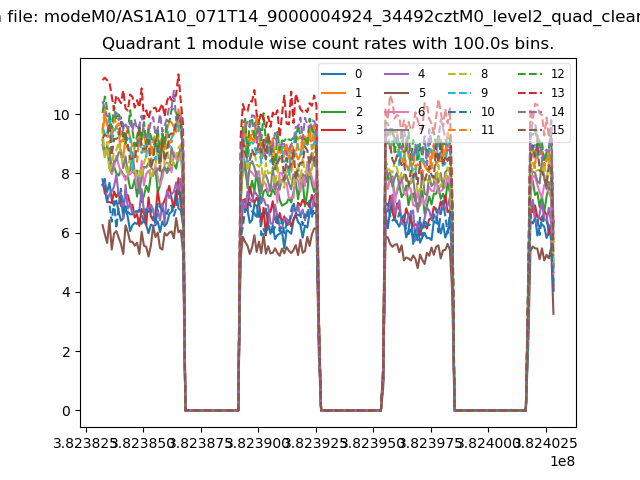
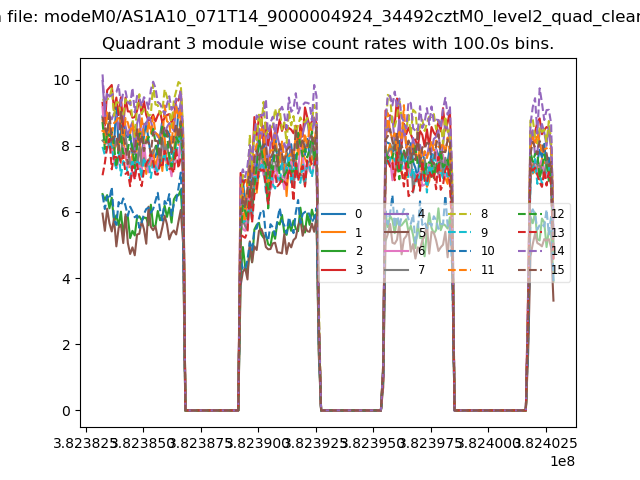
| Module-wise count rates for Quadrant A Data is divided into 100 sec bins |
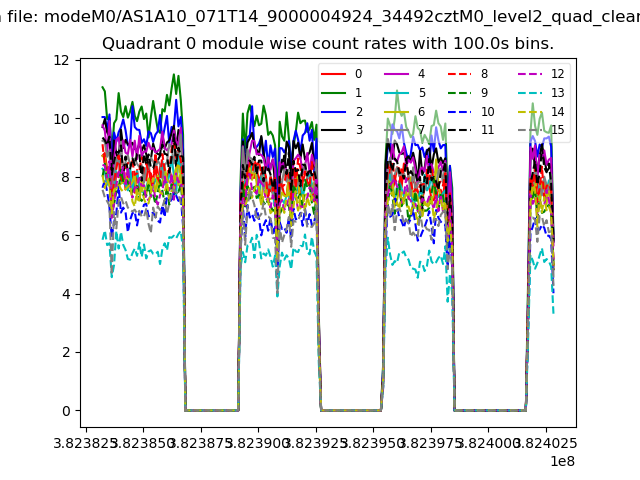 |
 |
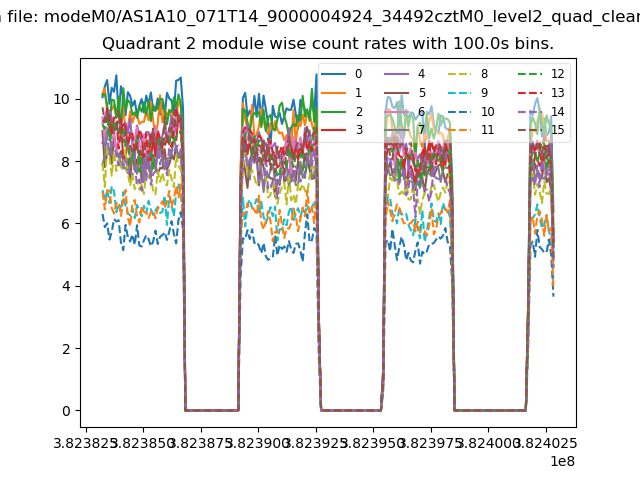
| Module-wise count rates for Quadrant B Data is divided into 100 sec bins |
 |
 |
| Module-wise count rates for Quadrant C Data is divided into 100 sec bins |
 |
 |
| Module-wise count rates for Quadrant D Data is divided into 100 sec bins |
 |
 |
| Parameter | Plot |
|---|---|
| CZT HV Monitor | 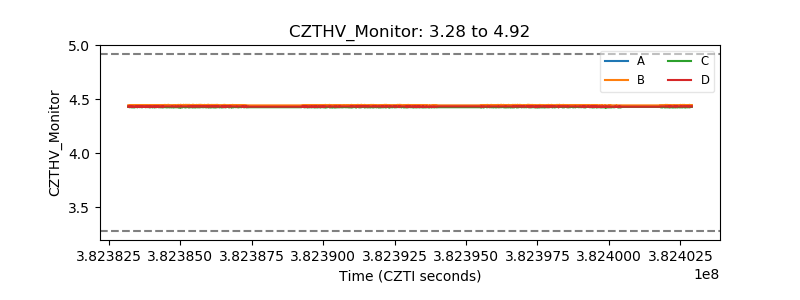 |
| D_VDD | 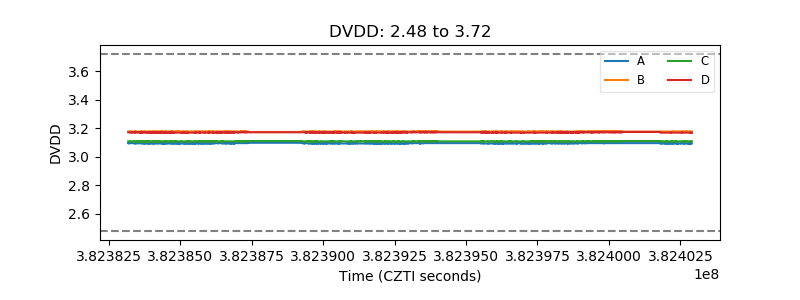 |
| Temperature 1 | 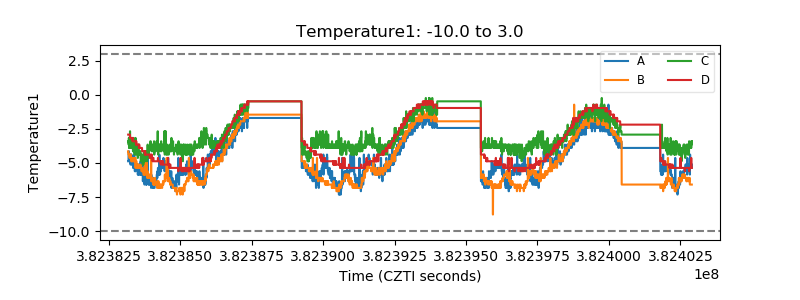 |
| Veto HV Monitor | 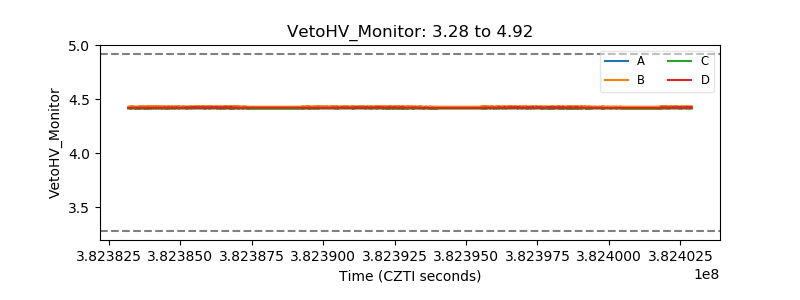 |
| Veto LLD | 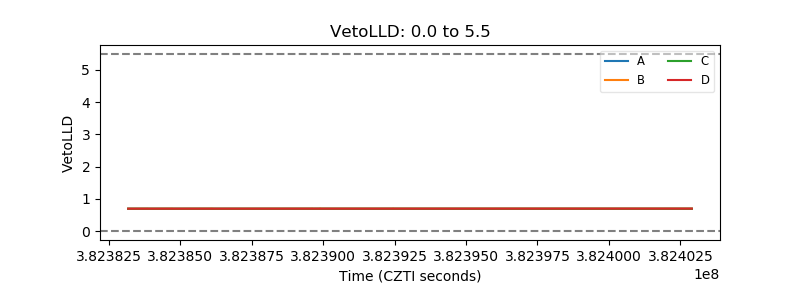 |
| Alpha Counter | 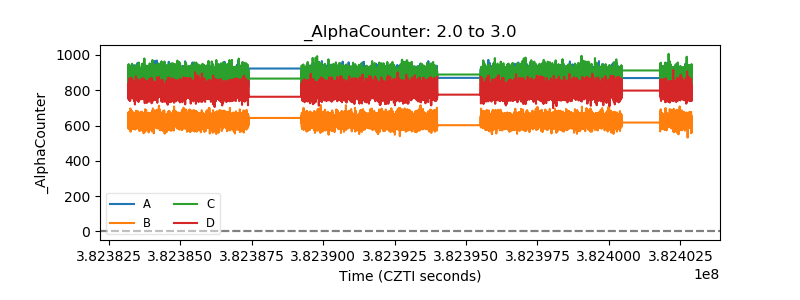 |
| _CPM_Rate | 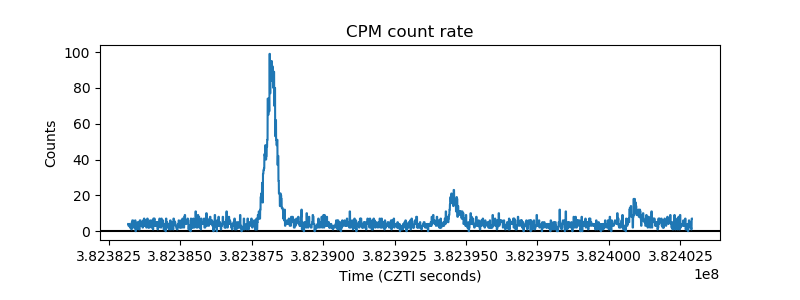 |
| CZT Counter | 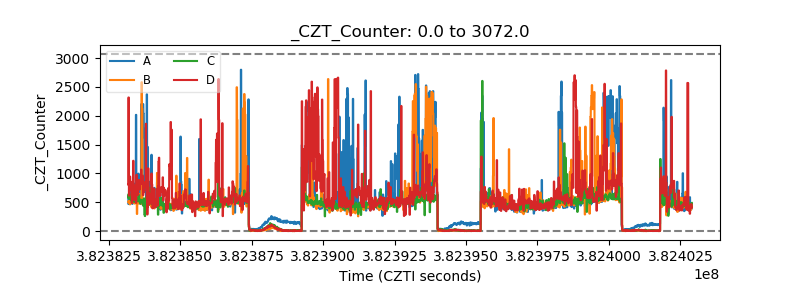 |
| +2.5 Volts monitor | 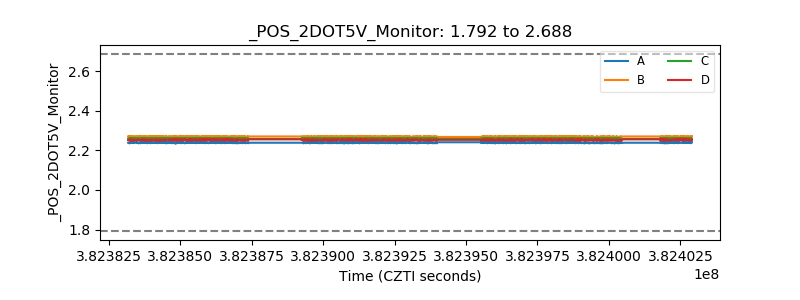 |
| +5 Volts monitor | 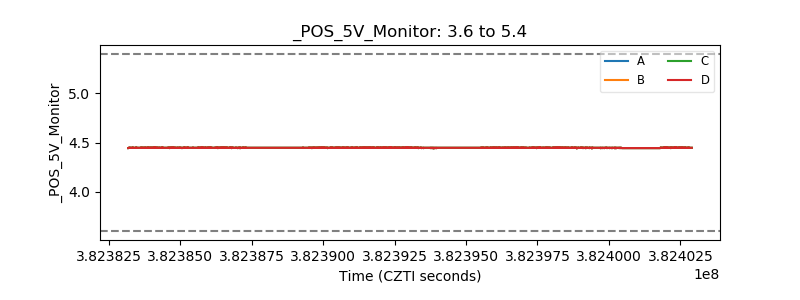 |
| _ROLL_ROT | 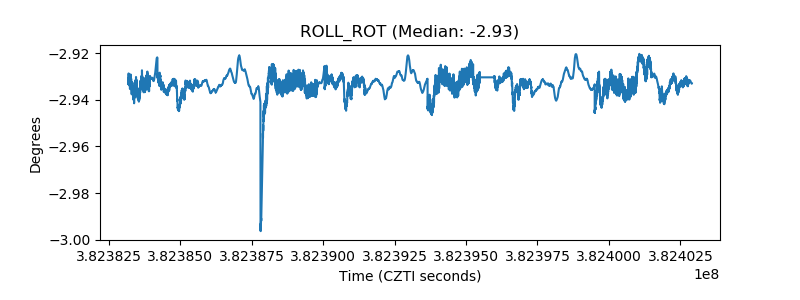 |
| _Roll_DEC | 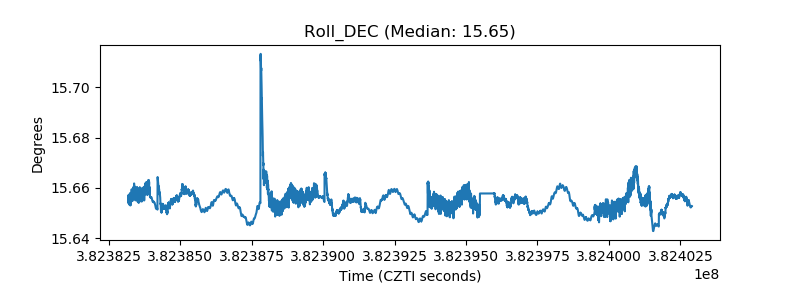 |
| _Roll_RA | 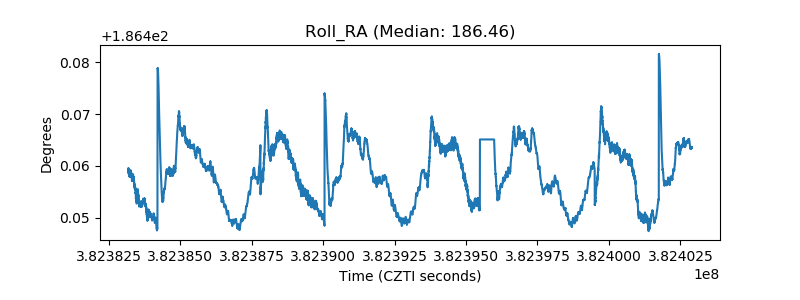 |
| Veto Counter | 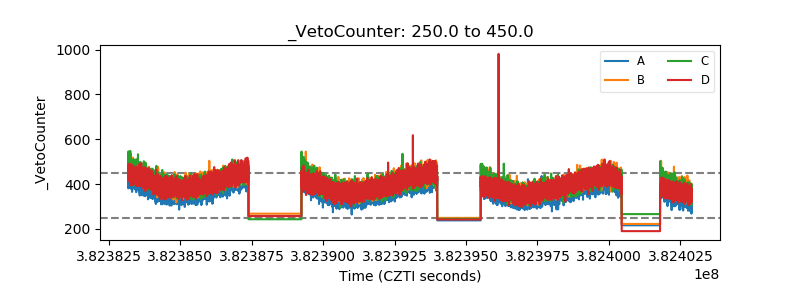 |