| Param | Original file | Final file |
|---|---|---|
| Filename | modeM0/AS1A10_071T14_9000004924_34484cztM0_level2.evt | modeM0/AS1A10_071T14_9000004924_34484cztM0_level2_quad_clean.evt |
| Size (bytes) | 520,176,960 | 81,483,840 |
| Size | 496.1 MB | 77.7 MB |
| Events in quadrant A | 4,431,998 | 516,619 |
| Events in quadrant B | 3,597,529 | 538,152 |
| Events in quadrant C | 2,866,375 | 534,306 |
| Events in quadrant D | 4,481,922 | 490,444 |
| Mode M0 | |||
|---|---|---|---|
| Quadrant | BADHDUFLAG | Total packets | Discarded packets |
| A | 0 | 16920 | 3 |
| B | 0 | 14396 | 2 |
| C | 0 | 11804 | 2 |
| D | 0 | 17053 | 2 |
| Mode SS | |||
|---|---|---|---|
| Quadrant | BADHDUFLAG | Total packets | Discarded packets |
| A | 0 | 112 | 0 |
| B | 0 | 112 | 0 |
| C | 0 | 112 | 0 |
| D | 0 | 112 | 0 |
| Mode M9 | |||
|---|---|---|---|
| Quadrant | BADHDUFLAG | Total packets | Discarded packets |
| A | 0 | 19 | 0 |
| B | 0 | 19 | 0 |
| C | 0 | 19 | 0 |
| D | 0 | 20 | 0 |
| Quadrant | Total seconds | Saturated seconds | Saturation percentage |
|---|---|---|---|
| A | 5544 | 612 | 11.038961% |
| B | 5544 | 431 | 7.774170% |
| C | 5544 | 31 | 0.559163% |
| D | 5544 | 388 | 6.998557% |
Noise dominated data is calculated using 1-second bins in cleaned event files. If a bin has >2000 counts, and if more than 50% of those come from <1% of pixels, then it is considered to be noise-dominated and hence unusable.
| Quadrant | # 1 sec bins | Bins with >0 counts | Bins with >2000 counts | High rate bins dominated by noise | Noise dominated (total time) | Noise dominated (detector-on time) | Marked lightcurve |
|---|---|---|---|---|---|---|---|
| A | 7066 | 5545 | 436 | 436 | 6.17% | 7.86% | 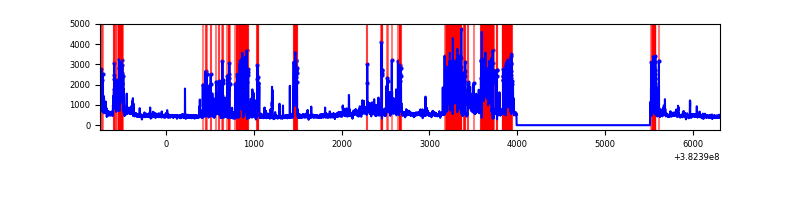 |
| B | 7066 | 5545 | 269 | 269 | 3.81% | 4.85% | 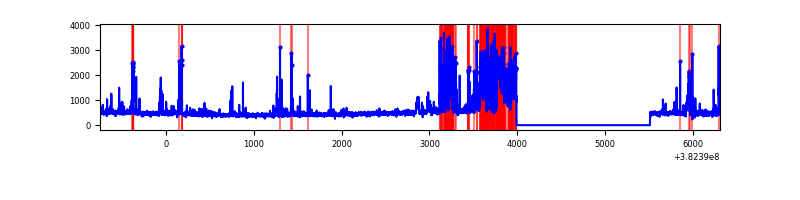 |
| C | 7066 | 5545 | 20 | 20 | 0.28% | 0.36% | 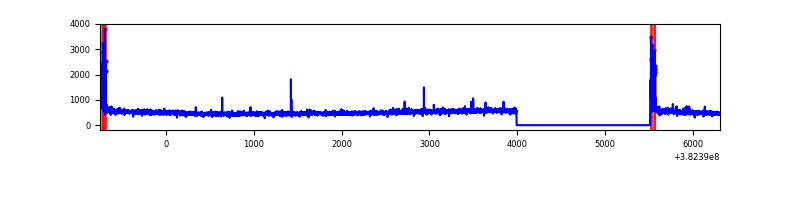 |
| D | 7066 | 5545 | 356 | 356 | 5.04% | 6.42% | 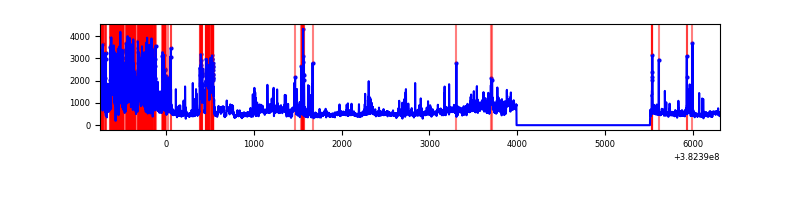 |
Top three noisy pixels from each quadrant. If the there are fewer than three noisy pixels in the level2.evt file, extra rows are filled as -1
| Pixel properties | Quadrant properties | ||||||
|---|---|---|---|---|---|---|---|
| Quadrant | DetID | PixID | Counts | Sigma | Mean | Median | Sigma |
| A | 15 | 169 | 1983766 | 15889.45 | 617 | 604 | 124.8 |
| A | 10 | 83 | 33911 | 266.86 | 617 | 604 | 124.8 |
| A | 9 | 143 | 22661 | 176.72 | 617 | 604 | 124.8 |
| B | 5 | 172 | 944480 | 7829.4 | 624 | 610 | 120.6 |
| B | 0 | 229 | 88121 | 725.9 | 624 | 610 | 120.6 |
| B | 0 | 189 | 49175 | 402.85 | 624 | 610 | 120.6 |
| C | 15 | 214 | 236698 | 1605.46 | 633 | 639 | 147.0 |
| C | 0 | 10 | 109823 | 742.57 | 633 | 639 | 147.0 |
| C | 14 | 67 | 19843 | 130.61 | 633 | 639 | 147.0 |
| D | 7 | 223 | 997223 | 6209.14 | 615 | 604 | 160.5 |
| D | 8 | 195 | 522502 | 3251.53 | 615 | 604 | 160.5 |
| D | 12 | 218 | 232331 | 1443.71 | 615 | 604 | 160.5 |
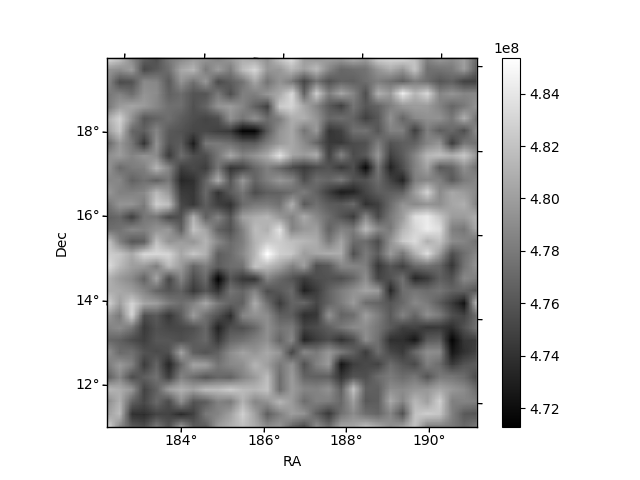
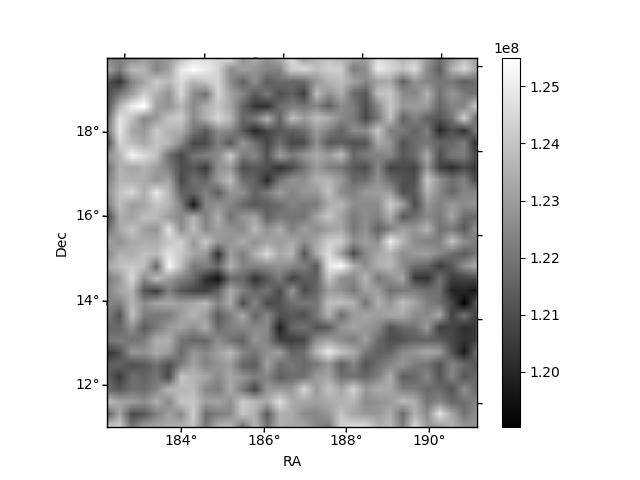
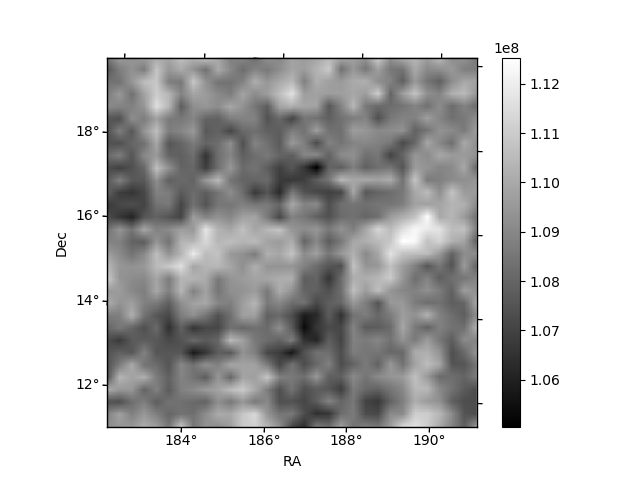
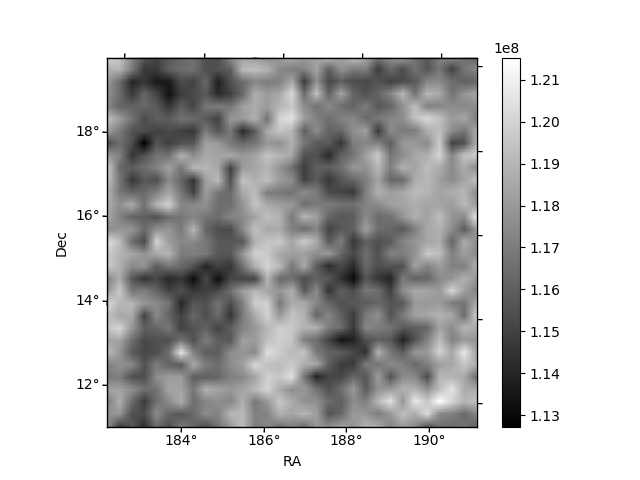
Histogram calculated using DETX and DETY for each event in the final _common_clean file
| Quadrant A | 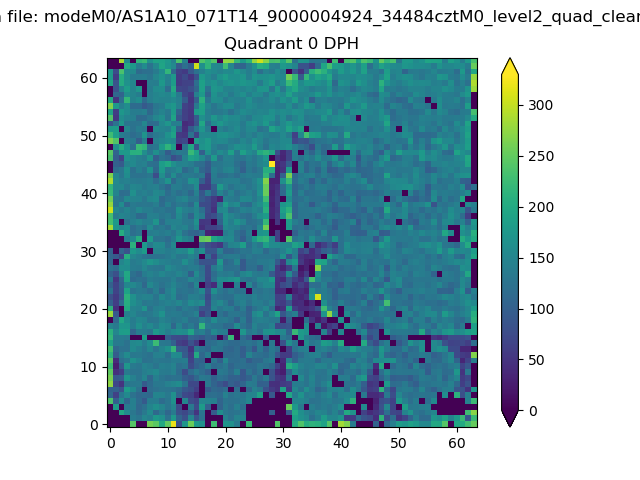 |
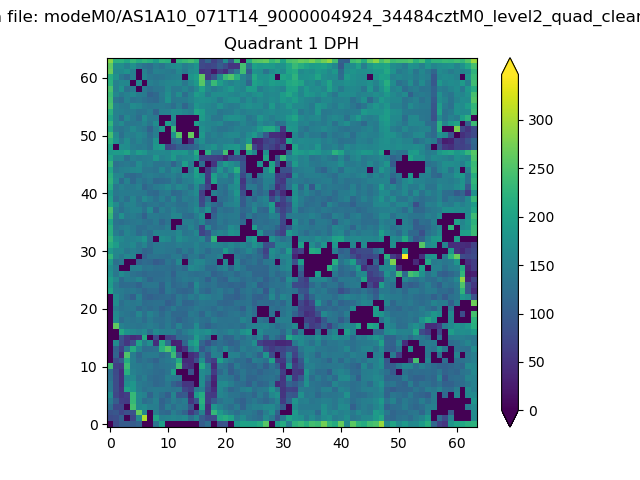 |
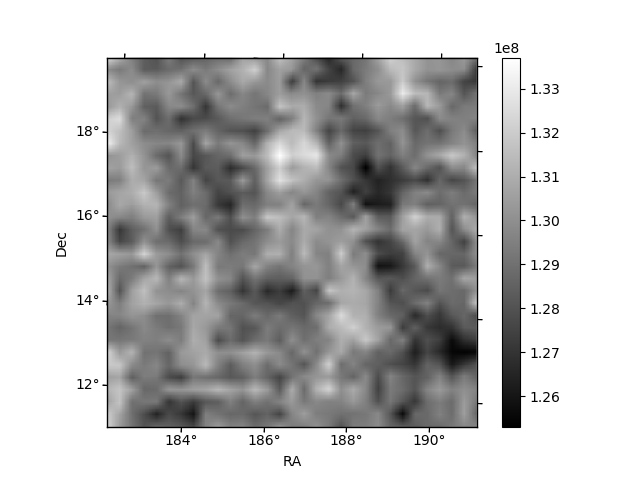
Quadrant B |
|---|---|---|---|
| Quadrant D | 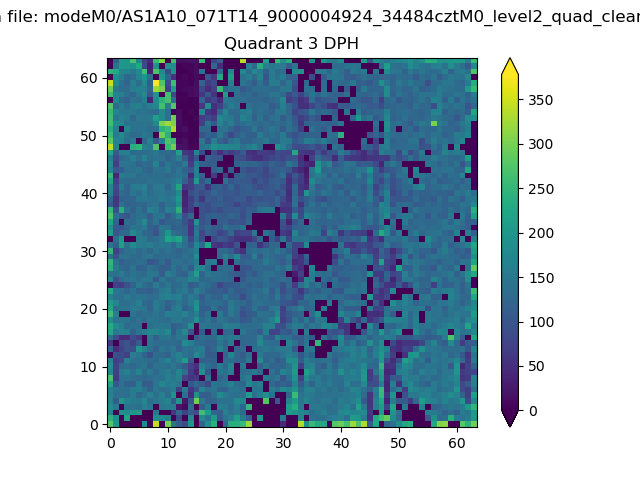 |
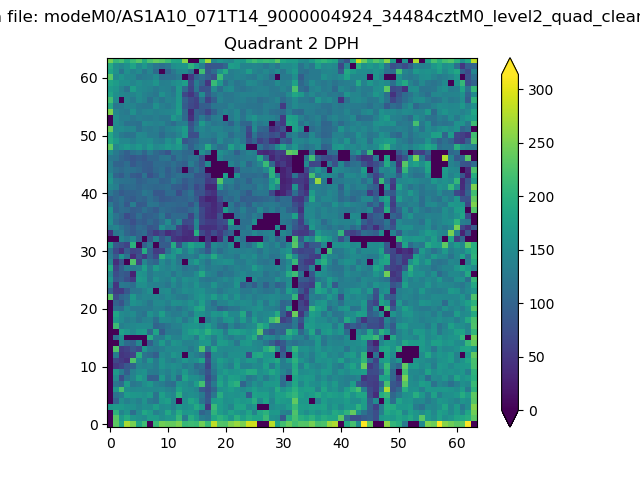 |
Quadrant C |
| Plot type | Count rate plots | Images |
|---|---|---|
| Comparison with Poisson distribution Blue bars denote a histogram of data divided into 1 sec bins. Red curve is a Poisson curve with rate = median count rate of data. |
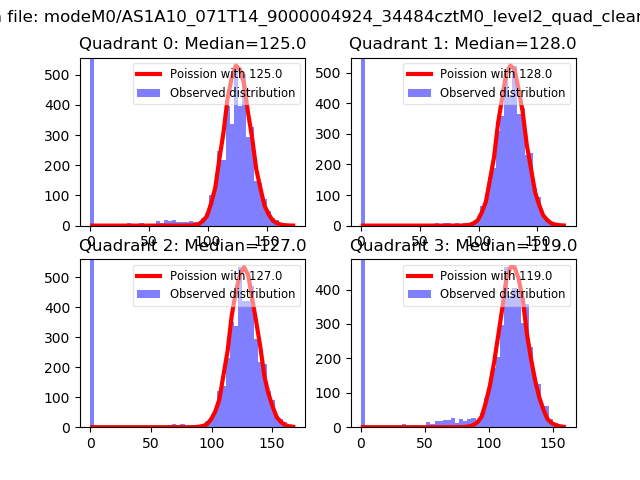 |
 |
| Quadrant-wise count rates Data is divided into 100 sec bins |
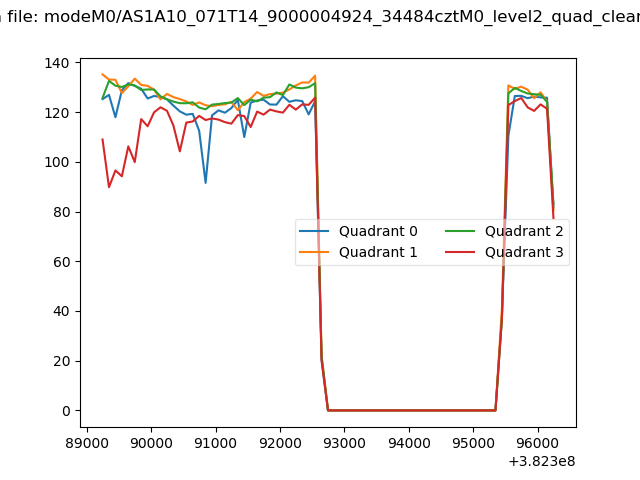 |
|
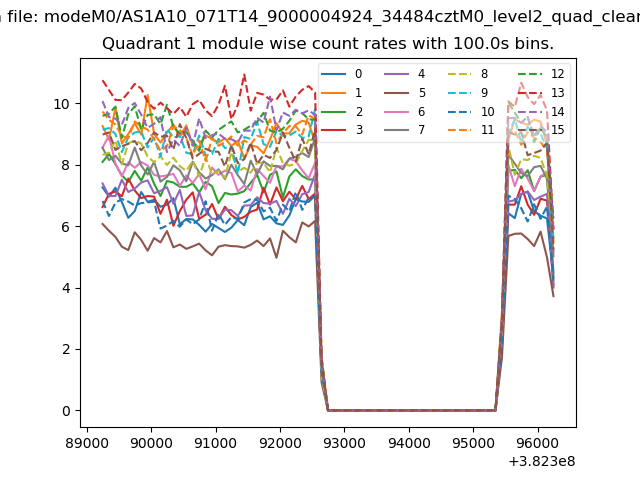
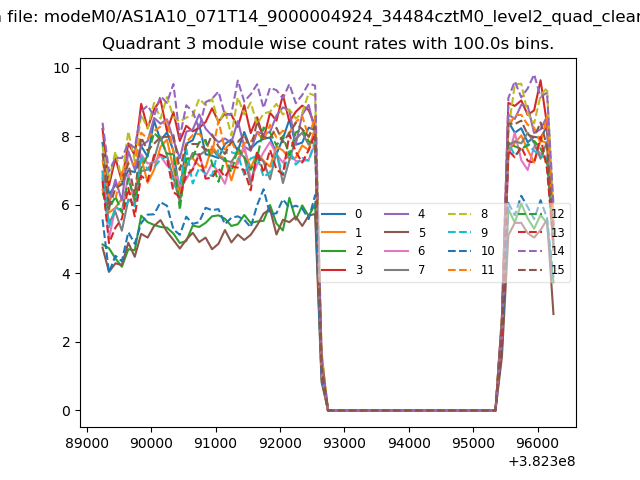
| Module-wise count rates for Quadrant A Data is divided into 100 sec bins |
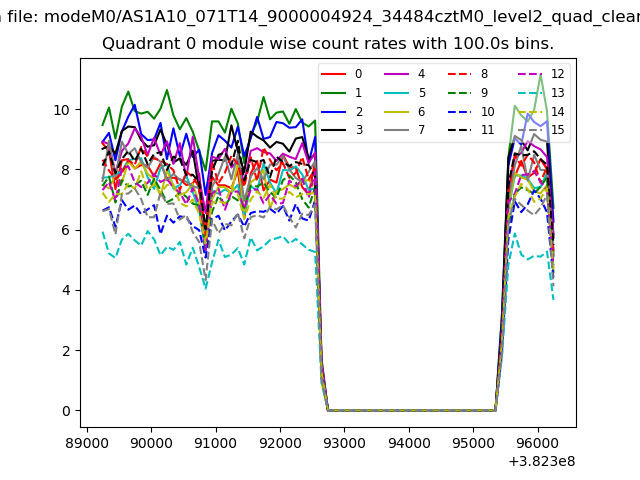 |
 |
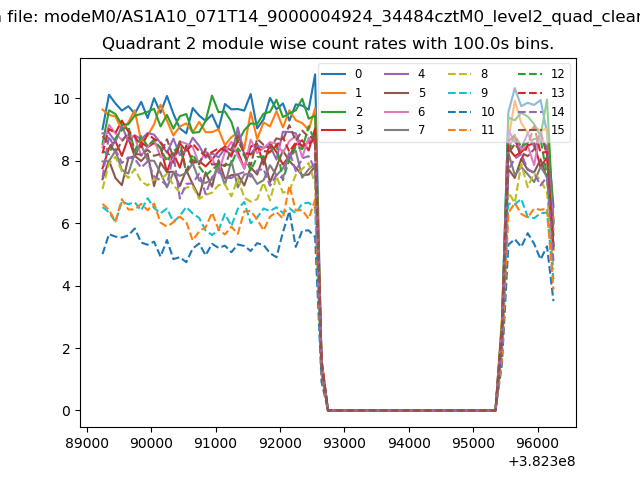
| Module-wise count rates for Quadrant B Data is divided into 100 sec bins |
 |
 |
| Module-wise count rates for Quadrant C Data is divided into 100 sec bins |
 |
 |
| Module-wise count rates for Quadrant D Data is divided into 100 sec bins |
 |
 |
| Parameter | Plot |
|---|---|
| CZT HV Monitor | 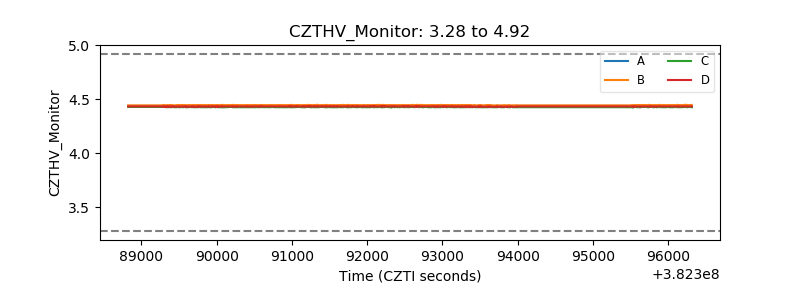 |
| D_VDD | 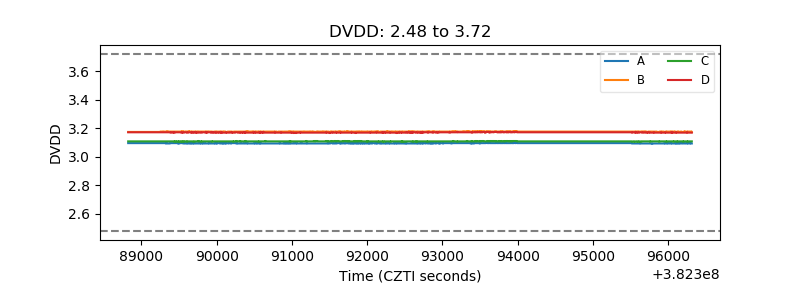 |
| Temperature 1 | 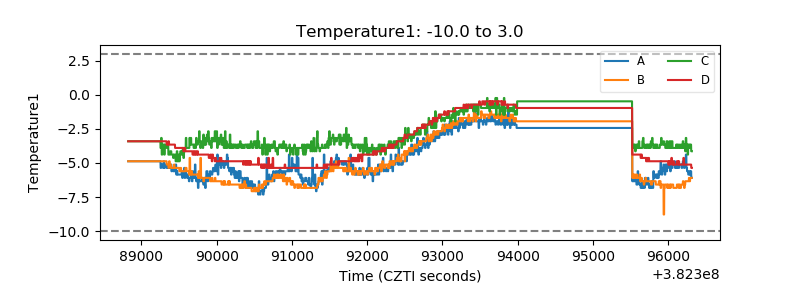 |
| Veto HV Monitor |  |
| Veto LLD | 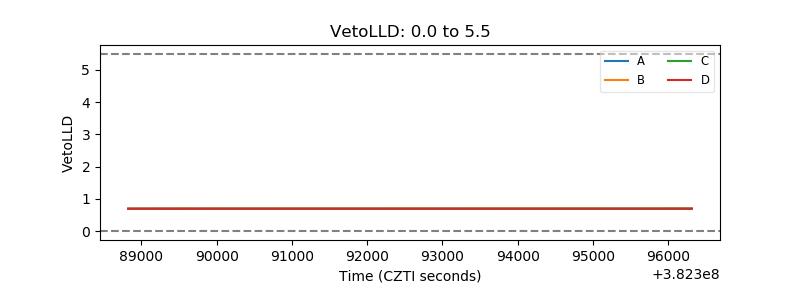 |
| Alpha Counter | 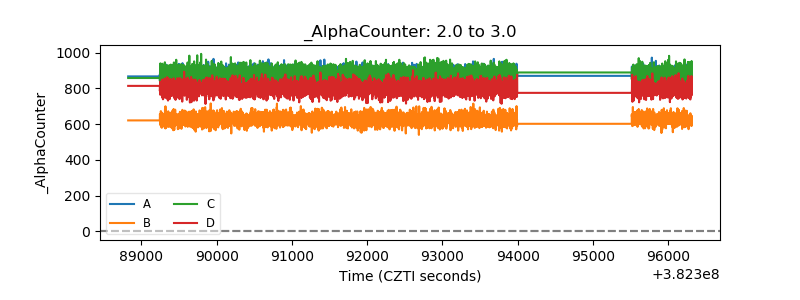 |
| _CPM_Rate | 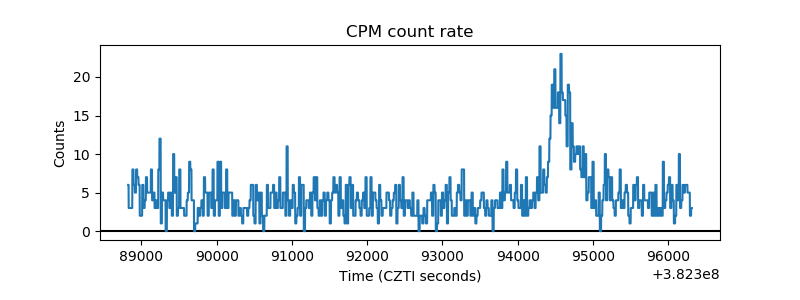 |
| CZT Counter | 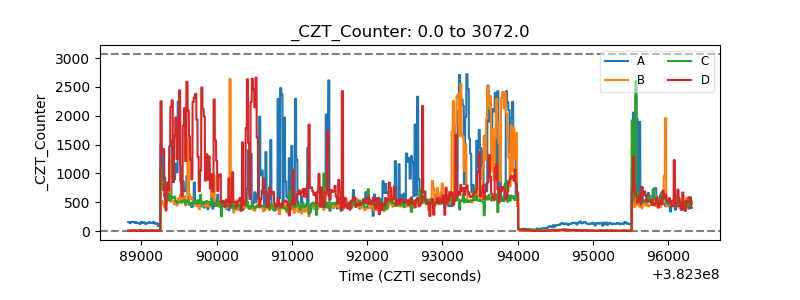 |
| +2.5 Volts monitor | 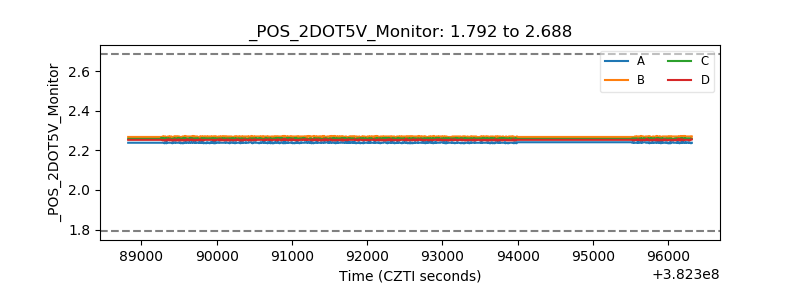 |
| +5 Volts monitor | 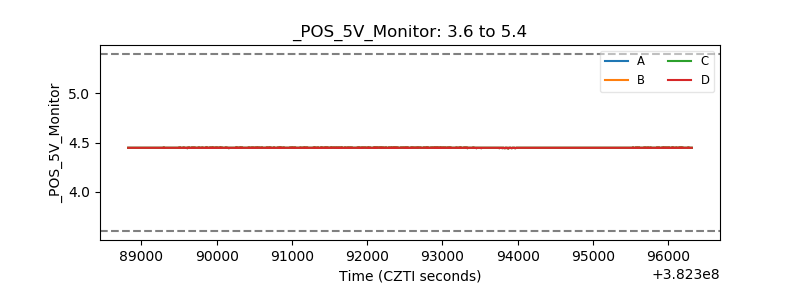 |
| _ROLL_ROT | 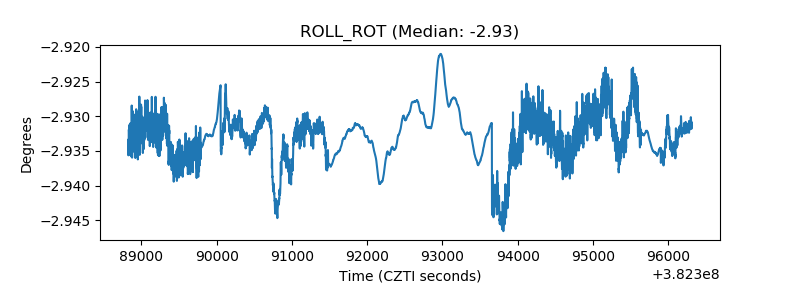 |
| _Roll_DEC | 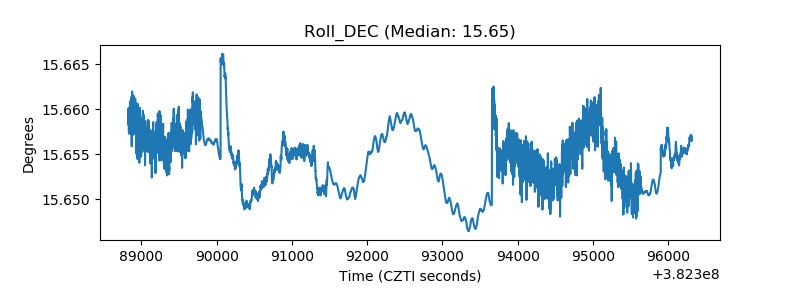 |
| _Roll_RA | 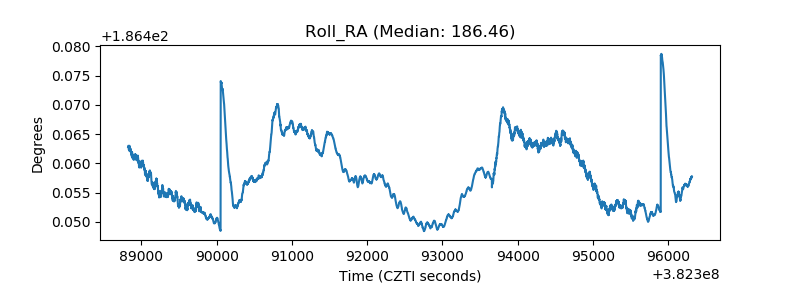 |
| Veto Counter | 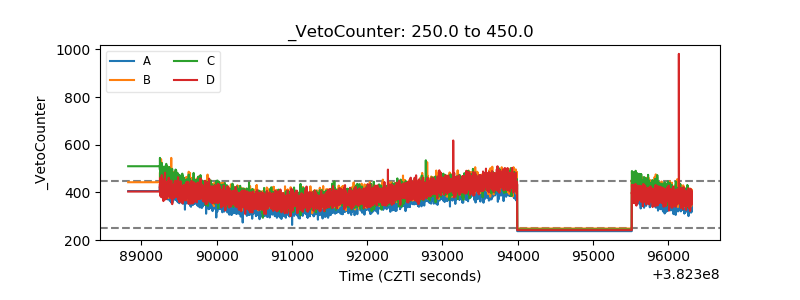 |