| Param | Original file | Final file |
|---|---|---|
| Filename | modeM0/AS1A10_071T14_9000004924_34483cztM0_level2.evt | modeM0/AS1A10_071T14_9000004924_34483cztM0_level2_quad_clean.evt |
| Size (bytes) | 446,757,120 | 86,304,960 |
| Size | 426.1 MB | 82.3 MB |
| Events in quadrant A | 3,254,666 | 563,911 |
| Events in quadrant B | 2,873,136 | 579,095 |
| Events in quadrant C | 2,767,674 | 576,131 |
| Events in quadrant D | 4,282,700 | 531,175 |
| Mode M0 | |||
|---|---|---|---|
| Quadrant | BADHDUFLAG | Total packets | Discarded packets |
| A | 0 | 13122 | 3 |
| B | 0 | 11756 | 2 |
| C | 0 | 11229 | 2 |
| D | 0 | 16282 | 2 |
| Mode SS | |||
|---|---|---|---|
| Quadrant | BADHDUFLAG | Total packets | Discarded packets |
| A | 0 | 104 | 0 |
| B | 0 | 104 | 0 |
| C | 0 | 104 | 0 |
| D | 0 | 104 | 0 |
| Mode M9 | |||
|---|---|---|---|
| Quadrant | BADHDUFLAG | Total packets | Discarded packets |
| A | 0 | 38 | 0 |
| B | 0 | 38 | 0 |
| C | 0 | 38 | 0 |
| D | 0 | 39 | 0 |
| Quadrant | Total seconds | Saturated seconds | Saturation percentage |
|---|---|---|---|
| A | 5188 | 178 | 3.430995% |
| B | 5188 | 125 | 2.409406% |
| C | 5188 | 47 | 0.905937% |
| D | 5188 | 396 | 7.632999% |
Noise dominated data is calculated using 1-second bins in cleaned event files. If a bin has >2000 counts, and if more than 50% of those come from <1% of pixels, then it is considered to be noise-dominated and hence unusable.
| Quadrant | # 1 sec bins | Bins with >0 counts | Bins with >2000 counts | High rate bins dominated by noise | Noise dominated (total time) | Noise dominated (detector-on time) | Marked lightcurve |
|---|---|---|---|---|---|---|---|
| A | 7041 | 5189 | 123 | 123 | 1.75% | 2.37% | 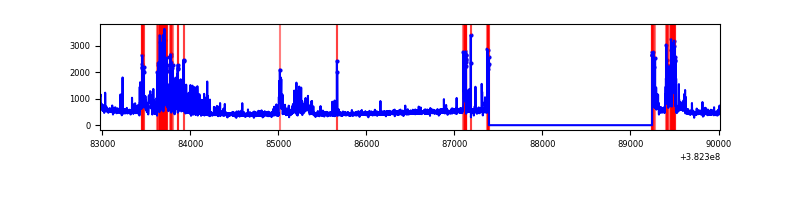 |
| B | 7041 | 5189 | 86 | 86 | 1.22% | 1.66% | 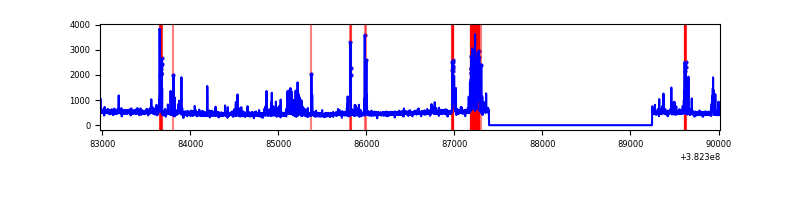 |
| C | 7041 | 5189 | 37 | 37 | 0.53% | 0.71% | 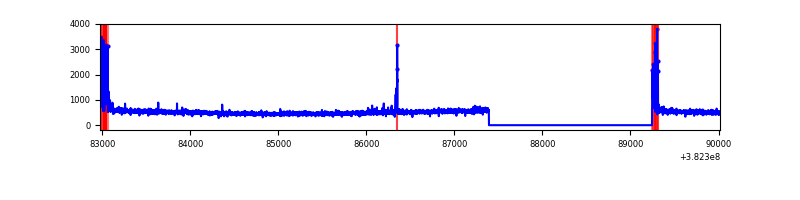 |
| D | 7041 | 5189 | 343 | 343 | 4.87% | 6.61% | 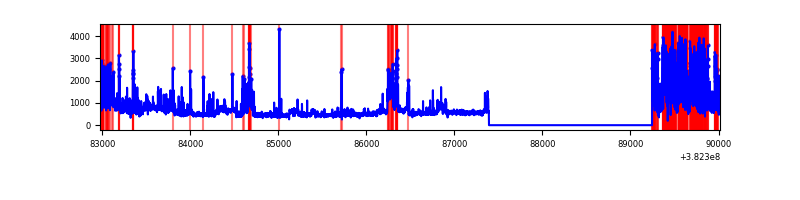 |
Top three noisy pixels from each quadrant. If the there are fewer than three noisy pixels in the level2.evt file, extra rows are filled as -1
| Pixel properties | Quadrant properties | ||||||
|---|---|---|---|---|---|---|---|
| Quadrant | DetID | PixID | Counts | Sigma | Mean | Median | Sigma |
| A | 15 | 169 | 841240 | 6819.68 | 608 | 597 | 123.3 |
| A | 10 | 83 | 36567 | 291.81 | 608 | 597 | 123.3 |
| A | 9 | 143 | 15716 | 122.65 | 608 | 597 | 123.3 |
| B | 5 | 172 | 293557 | 2489.82 | 608 | 593 | 117.7 |
| B | 4 | 232 | 60966 | 513.09 | 608 | 593 | 117.7 |
| B | 0 | 229 | 56478 | 474.95 | 608 | 593 | 117.7 |
| C | 15 | 214 | 222342 | 1585.19 | 603 | 609 | 139.9 |
| C | 0 | 10 | 147767 | 1052.04 | 603 | 609 | 139.9 |
| C | 15 | 208 | 22876 | 159.19 | 603 | 609 | 139.9 |
| D | 7 | 223 | 827718 | 5366.15 | 582 | 571 | 154.1 |
| D | 8 | 195 | 458075 | 2968.07 | 582 | 571 | 154.1 |
| D | 2 | 250 | 187891 | 1215.25 | 582 | 571 | 154.1 |
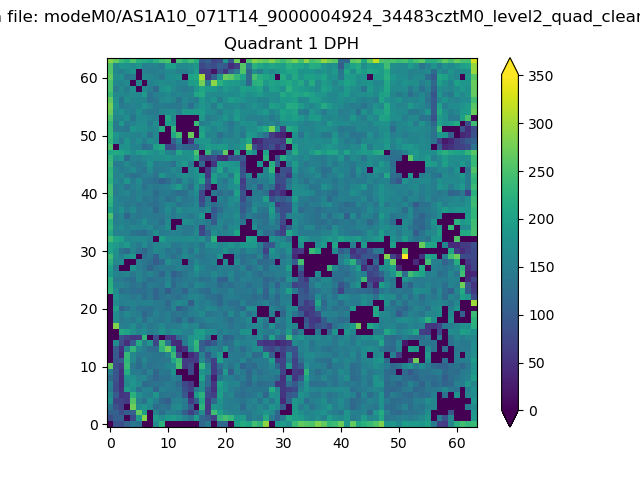
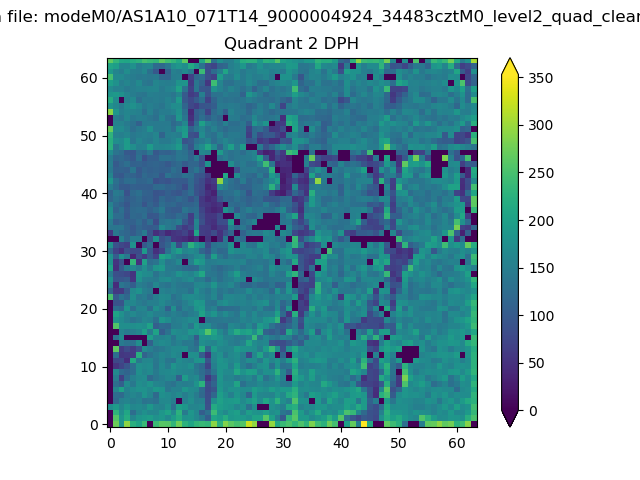
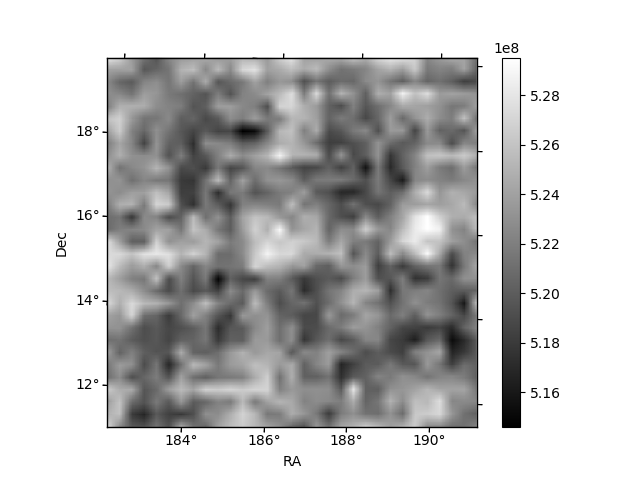
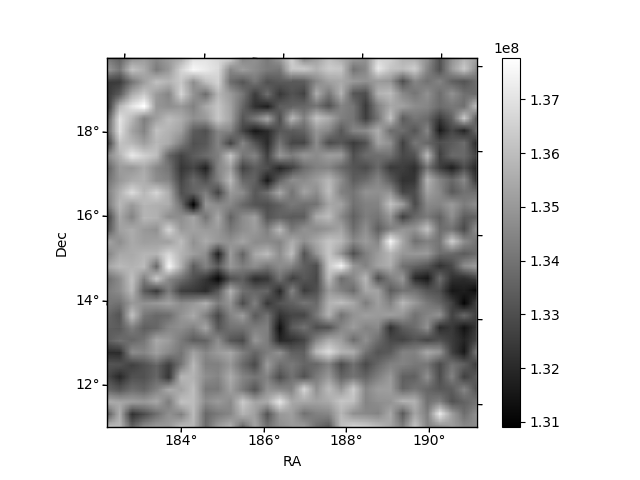
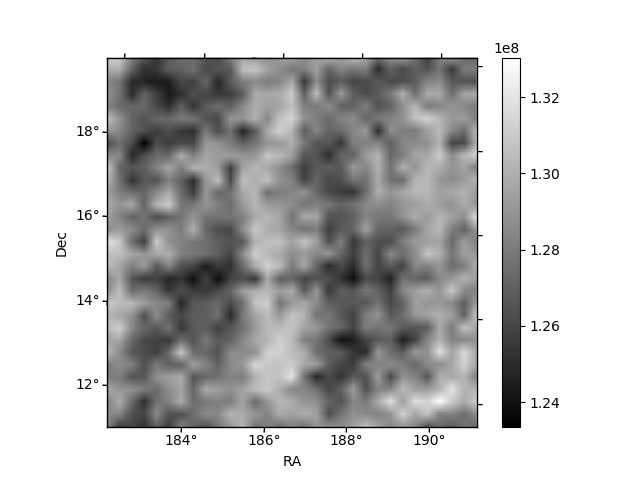
Histogram calculated using DETX and DETY for each event in the final _common_clean file
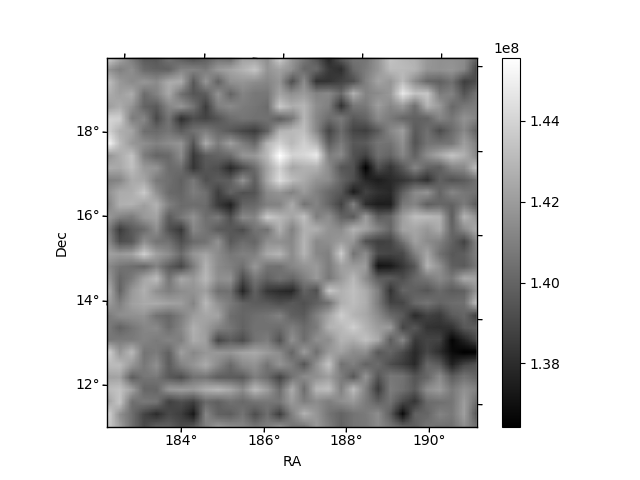
| Quadrant A |  |
 |
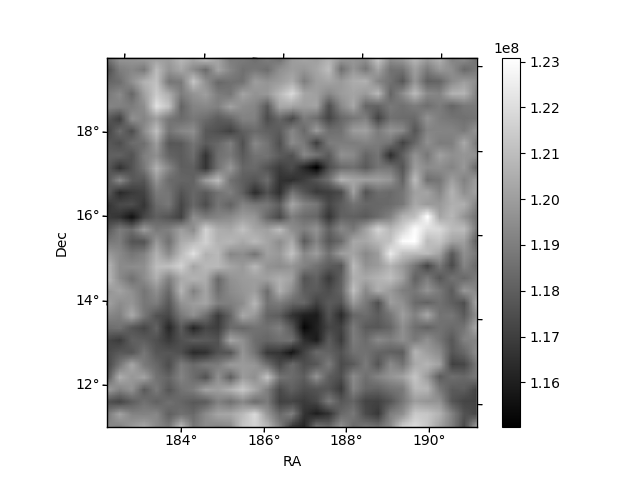
Quadrant B |
|---|---|---|---|
| Quadrant D | 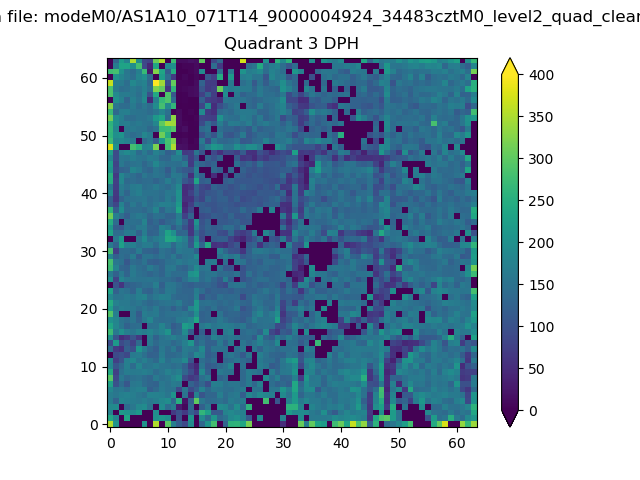 |
 |
Quadrant C |
| Plot type | Count rate plots | Images |
|---|---|---|
| Comparison with Poisson distribution Blue bars denote a histogram of data divided into 1 sec bins. Red curve is a Poisson curve with rate = median count rate of data. |
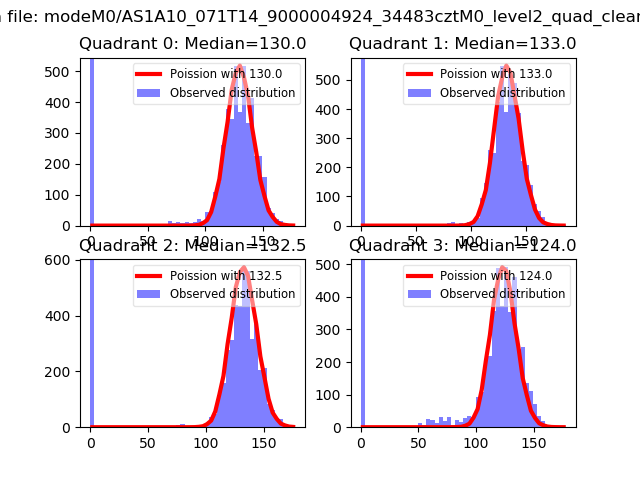 |
 |
| Quadrant-wise count rates Data is divided into 100 sec bins |
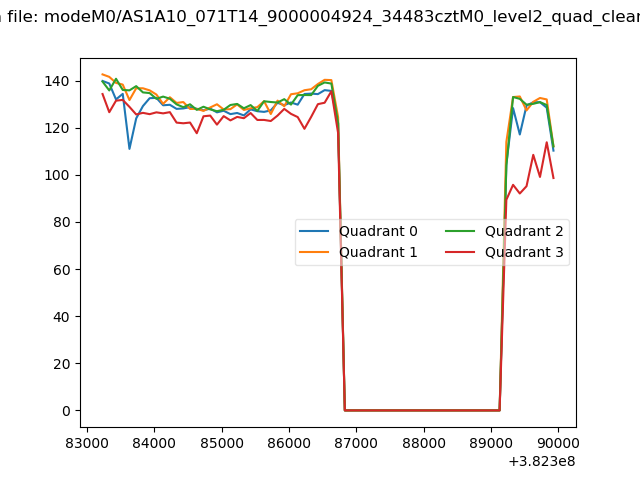 |
|
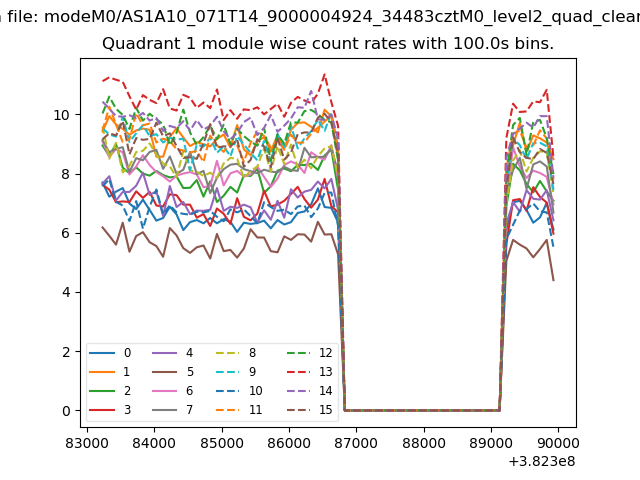
| Module-wise count rates for Quadrant A Data is divided into 100 sec bins |
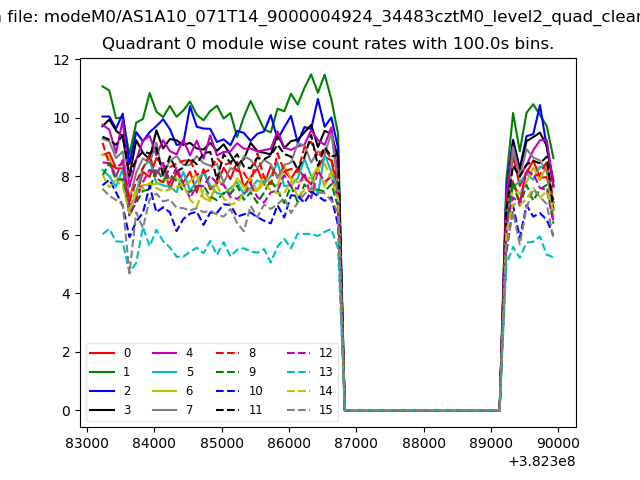 |
 |
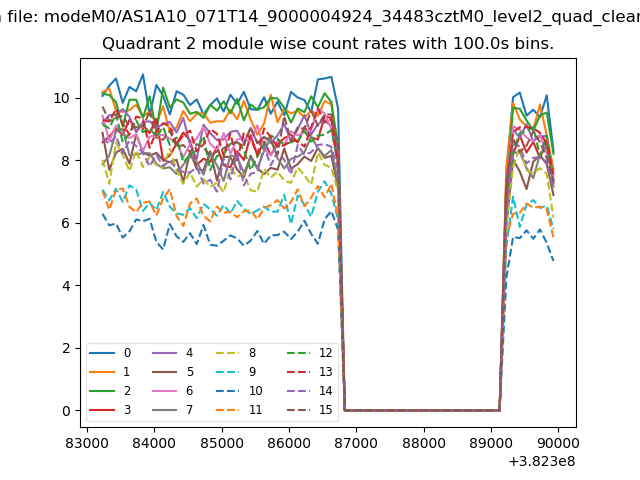
| Module-wise count rates for Quadrant B Data is divided into 100 sec bins |
 |
 |
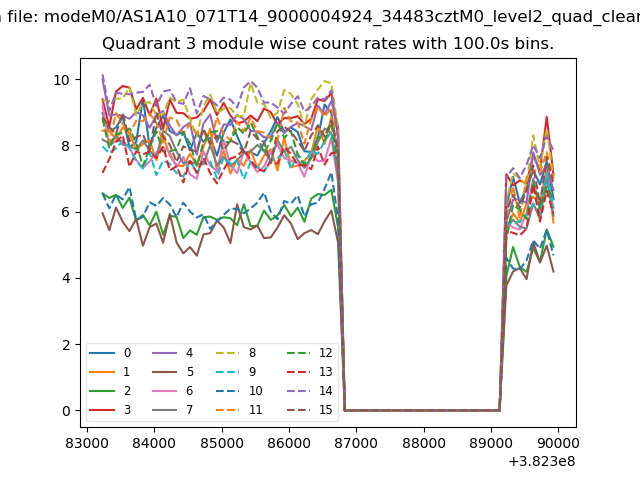
| Module-wise count rates for Quadrant C Data is divided into 100 sec bins |
 |
 |
| Module-wise count rates for Quadrant D Data is divided into 100 sec bins |
 |
 |
| Parameter | Plot |
|---|---|
| CZT HV Monitor | 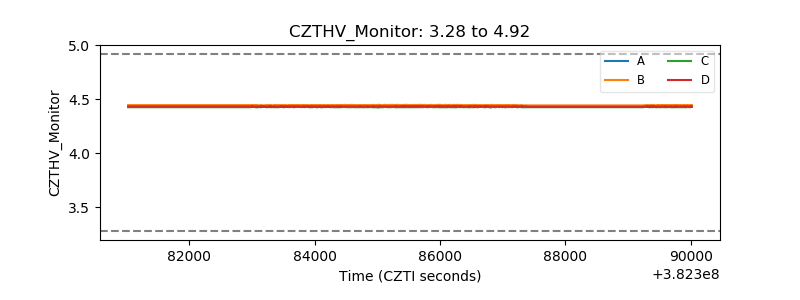 |
| D_VDD | 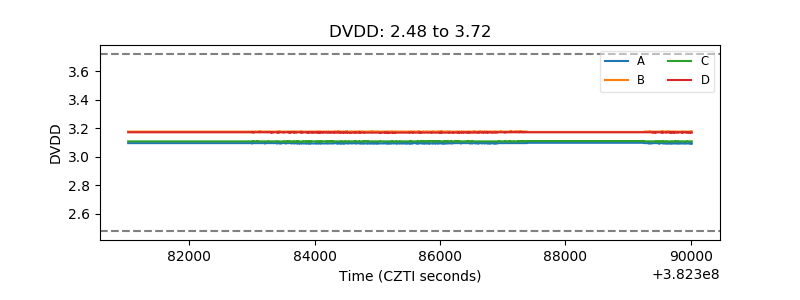 |
| Temperature 1 | 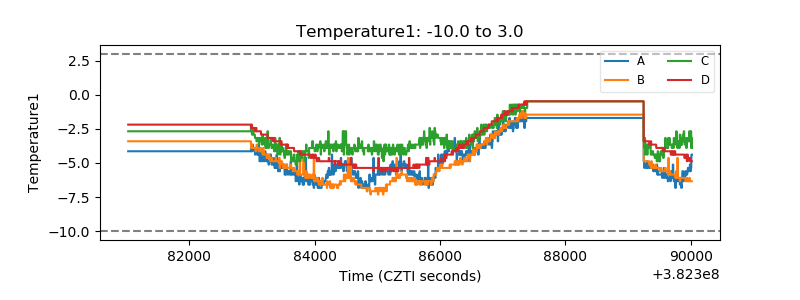 |
| Veto HV Monitor | 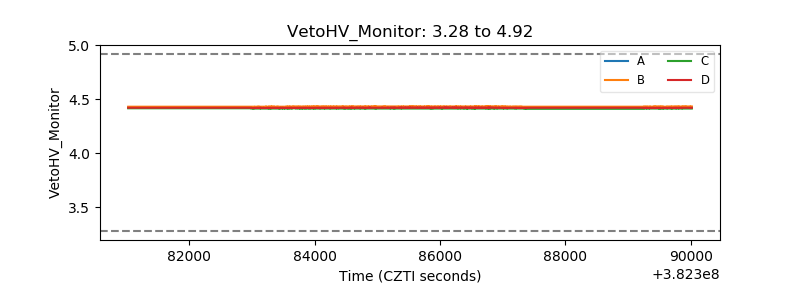 |
| Veto LLD | 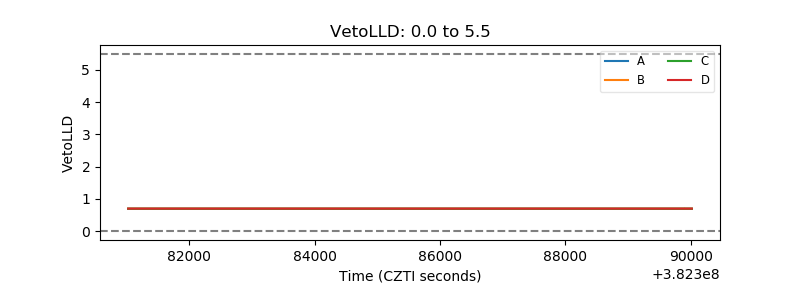 |
| Alpha Counter | 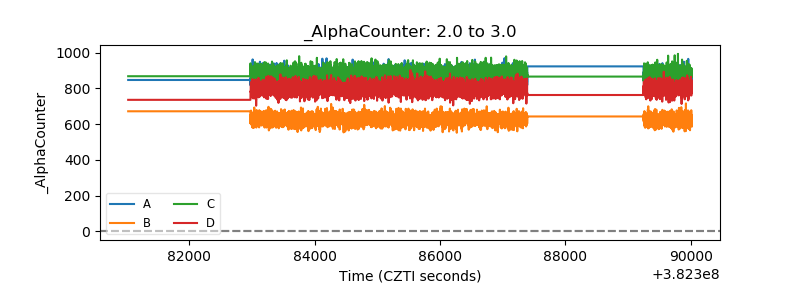 |
| _CPM_Rate | 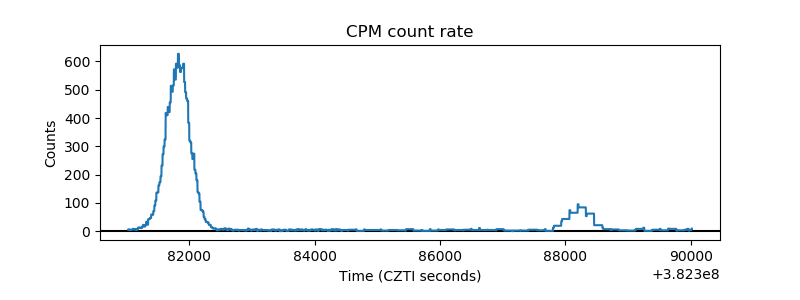 |
| CZT Counter | 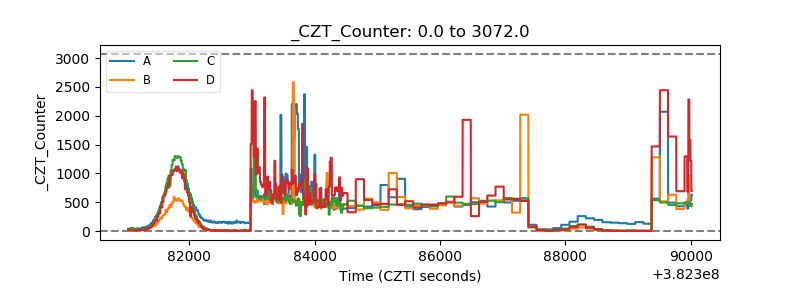 |
| +2.5 Volts monitor | 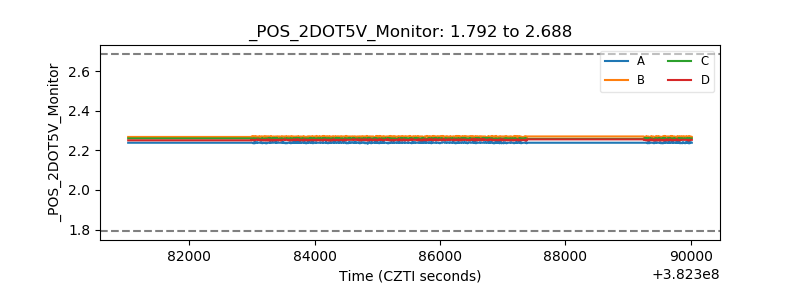 |
| +5 Volts monitor | 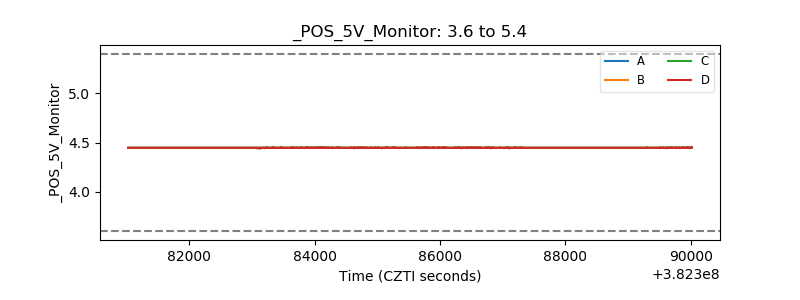 |
| _ROLL_ROT | 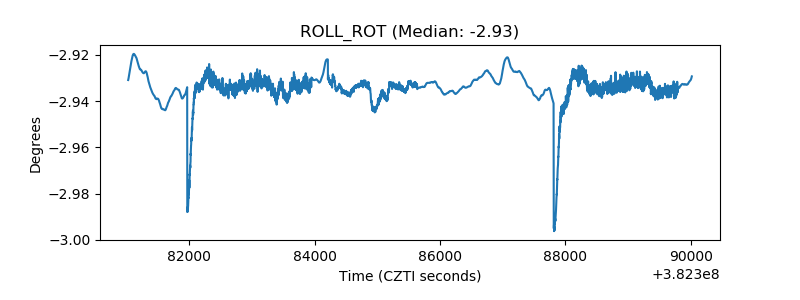 |
| _Roll_DEC | 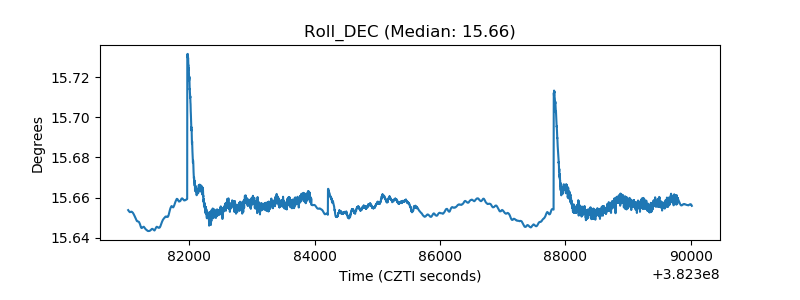 |
| _Roll_RA | 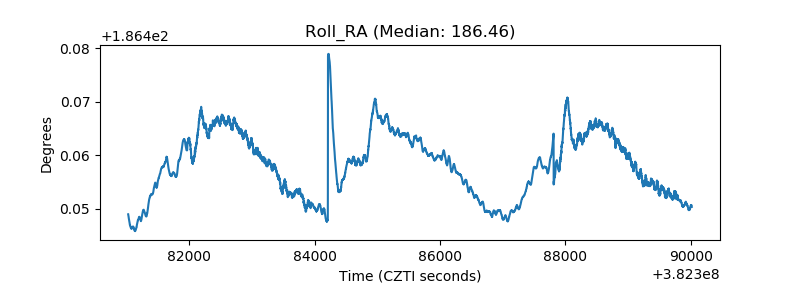 |
| Veto Counter | 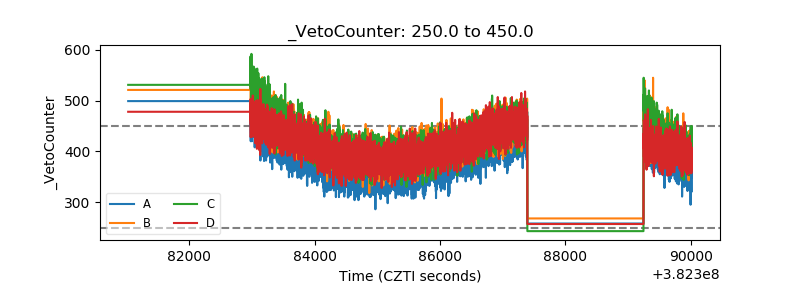 |