| Param | Original file | Final file |
|---|---|---|
| Filename | modeM0/AS1A10_071T14_9000004924_34480cztM0_level2.evt | modeM0/AS1A10_071T14_9000004924_34480cztM0_level2_quad_clean.evt |
| Size (bytes) | 481,366,080 | 62,023,680 |
| Size | 459.1 MB | 59.2 MB |
| Events in quadrant A | 3,062,638 | 385,067 |
| Events in quadrant B | 4,062,970 | 387,105 |
| Events in quadrant C | 3,015,955 | 386,706 |
| Events in quadrant D | 4,094,704 | 365,211 |
| Mode M0 | |||
|---|---|---|---|
| Quadrant | BADHDUFLAG | Total packets | Discarded packets |
| A | 0 | 12462 | 3 |
| B | 0 | 15249 | 2 |
| C | 0 | 12111 | 2 |
| D | 0 | 15929 | 2 |
| Mode SS | |||
|---|---|---|---|
| Quadrant | BADHDUFLAG | Total packets | Discarded packets |
| A | 0 | 102 | 0 |
| B | 0 | 102 | 0 |
| C | 0 | 102 | 0 |
| D | 0 | 102 | 0 |
| Mode M9 | |||
|---|---|---|---|
| Quadrant | BADHDUFLAG | Total packets | Discarded packets |
| A | 0 | 29 | 0 |
| B | 0 | 29 | 0 |
| C | 0 | 29 | 0 |
| D | 0 | 30 | 0 |
| Quadrant | Total seconds | Saturated seconds | Saturation percentage |
|---|---|---|---|
| A | 5049 | 31 | 0.613983% |
| B | 5049 | 565 | 11.190335% |
| C | 5049 | 47 | 0.930877% |
| D | 5049 | 209 | 4.139434% |
Noise dominated data is calculated using 1-second bins in cleaned event files. If a bin has >2000 counts, and if more than 50% of those come from <1% of pixels, then it is considered to be noise-dominated and hence unusable.
| Quadrant | # 1 sec bins | Bins with >0 counts | Bins with >2000 counts | High rate bins dominated by noise | Noise dominated (total time) | Noise dominated (detector-on time) | Marked lightcurve |
|---|---|---|---|---|---|---|---|
| A | 7172 | 5050 | 7 | 7 | 0.10% | 0.14% | 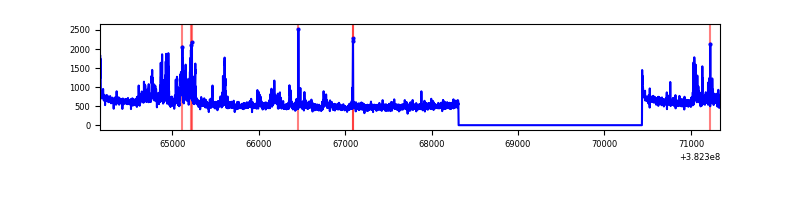 |
| B | 7172 | 5050 | 406 | 406 | 5.66% | 8.04% | 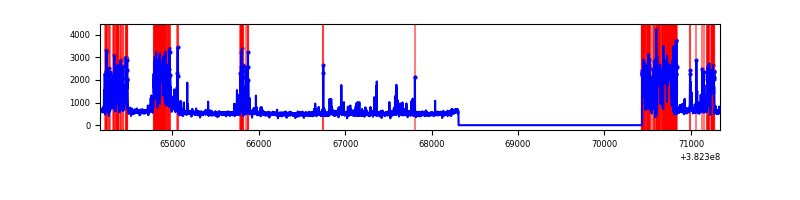 |
| C | 7172 | 5050 | 23 | 23 | 0.32% | 0.46% | 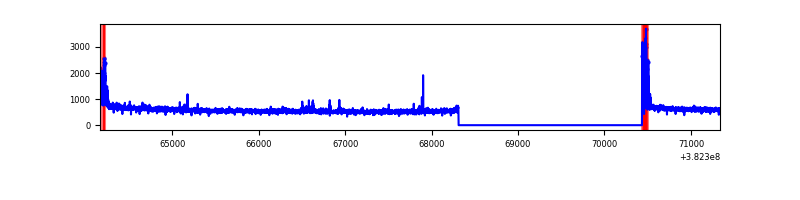 |
| D | 7172 | 5050 | 173 | 173 | 2.41% | 3.43% | 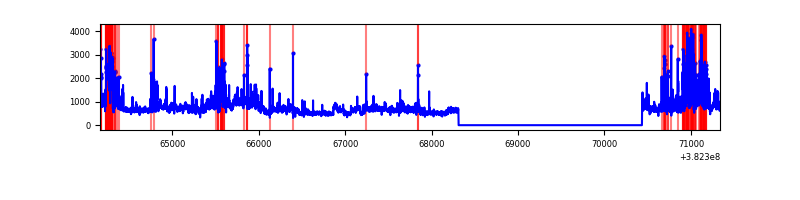 |
Top three noisy pixels from each quadrant. If the there are fewer than three noisy pixels in the level2.evt file, extra rows are filled as -1
| Pixel properties | Quadrant properties | ||||||
|---|---|---|---|---|---|---|---|
| Quadrant | DetID | PixID | Counts | Sigma | Mean | Median | Sigma |
| A | 15 | 169 | 358665 | 2642.56 | 682 | 672 | 135.5 |
| A | 10 | 83 | 38942 | 282.49 | 682 | 672 | 135.5 |
| A | 9 | 143 | 12153 | 84.75 | 682 | 672 | 135.5 |
| B | 5 | 172 | 1413500 | 11788.0 | 643 | 629 | 119.9 |
| B | 0 | 189 | 43693 | 359.3 | 643 | 629 | 119.9 |
| B | 0 | 229 | 31109 | 254.3 | 643 | 629 | 119.9 |
| C | 15 | 214 | 217755 | 1415.81 | 669 | 678 | 153.3 |
| C | 0 | 10 | 136184 | 883.79 | 669 | 678 | 153.3 |
| C | 15 | 208 | 22058 | 139.44 | 669 | 678 | 153.3 |
| D | 8 | 195 | 576652 | 3631.23 | 657 | 642 | 158.6 |
| D | 7 | 223 | 415509 | 2615.36 | 657 | 642 | 158.6 |
| D | 12 | 79 | 168474 | 1058.03 | 657 | 642 | 158.6 |
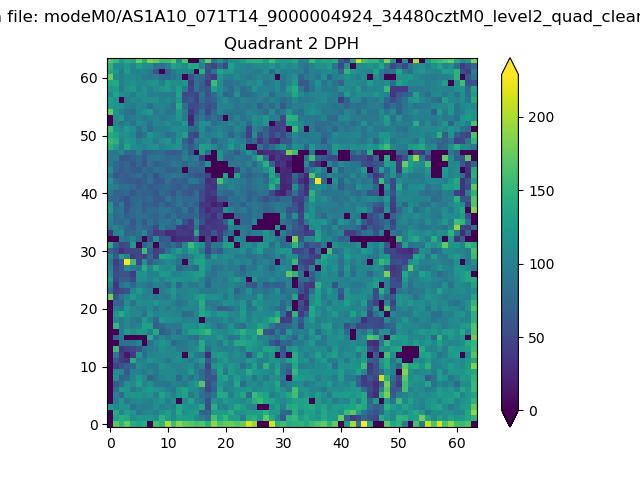
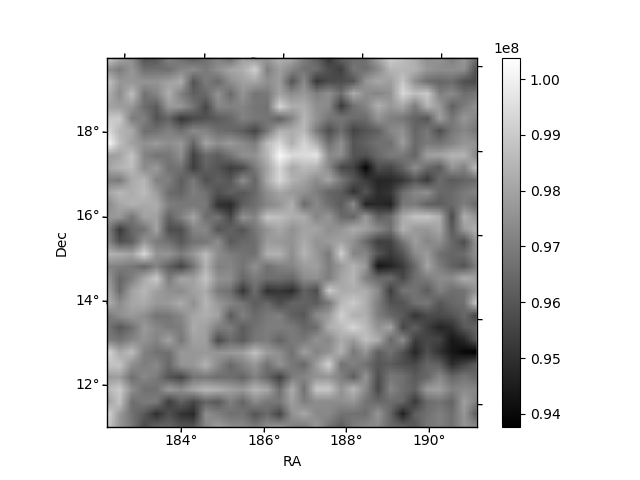
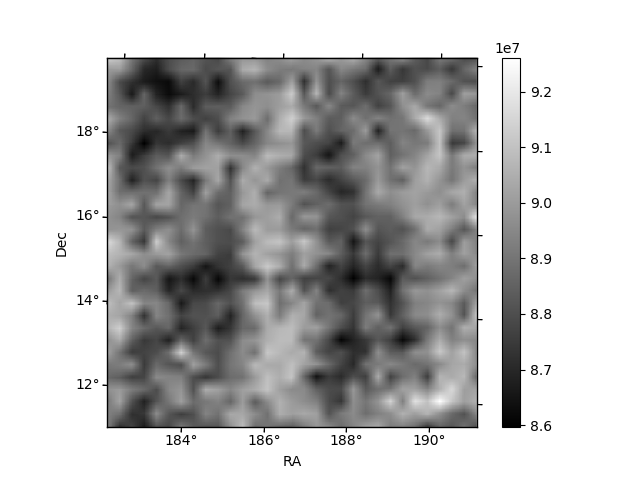
Histogram calculated using DETX and DETY for each event in the final _common_clean file
| Quadrant A | 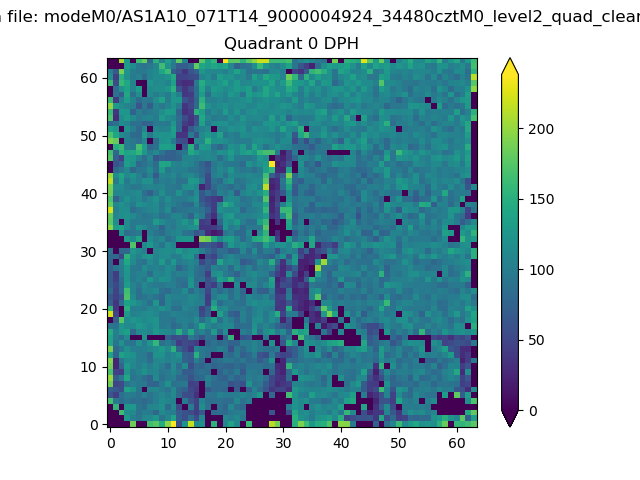 |
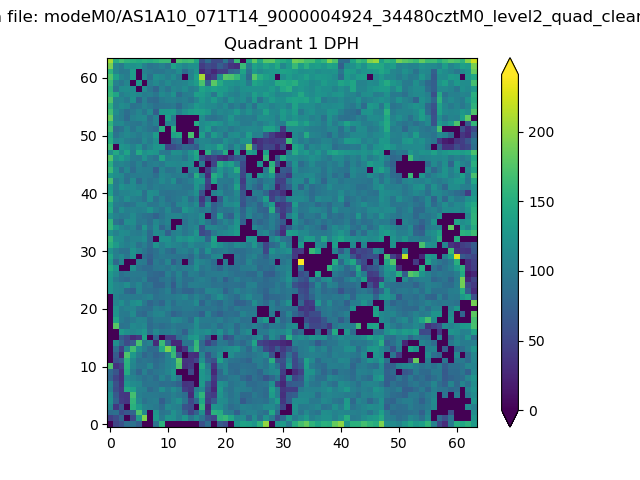 |
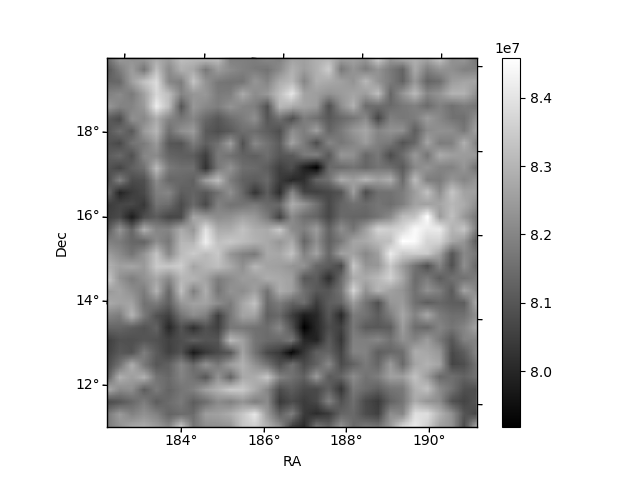
Quadrant B |
|---|---|---|---|
| Quadrant D | 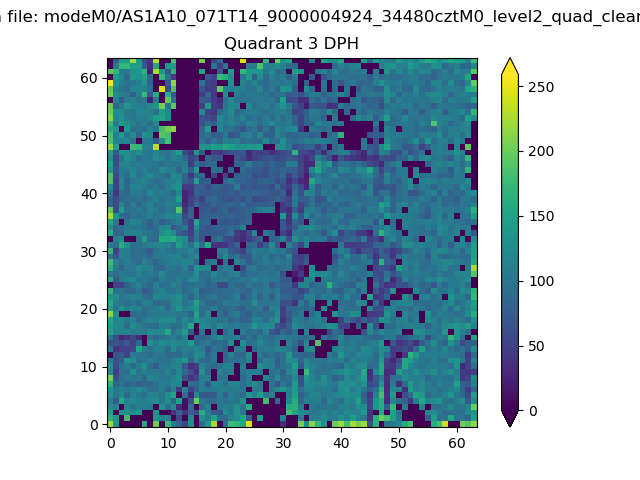 |
 |
Quadrant C |
| Plot type | Count rate plots | Images |
|---|---|---|
| Comparison with Poisson distribution Blue bars denote a histogram of data divided into 1 sec bins. Red curve is a Poisson curve with rate = median count rate of data. |
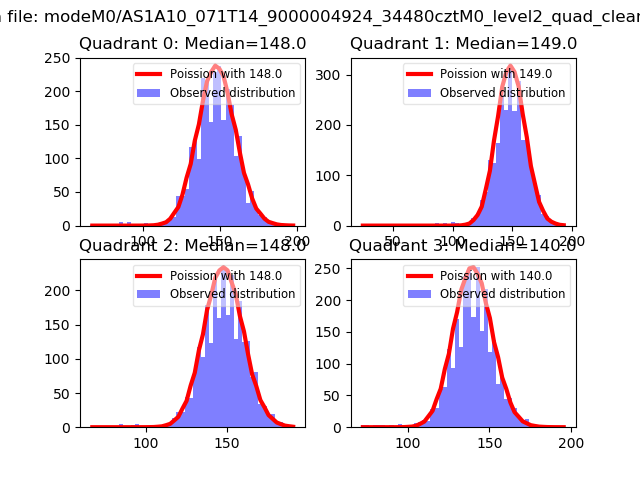 |
 |
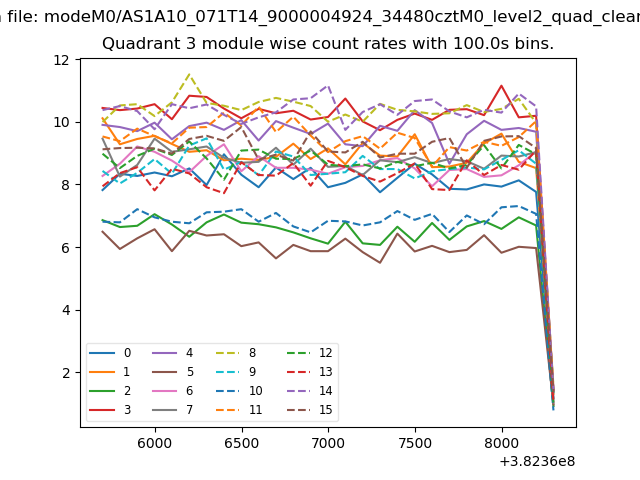
| Quadrant-wise count rates Data is divided into 100 sec bins |
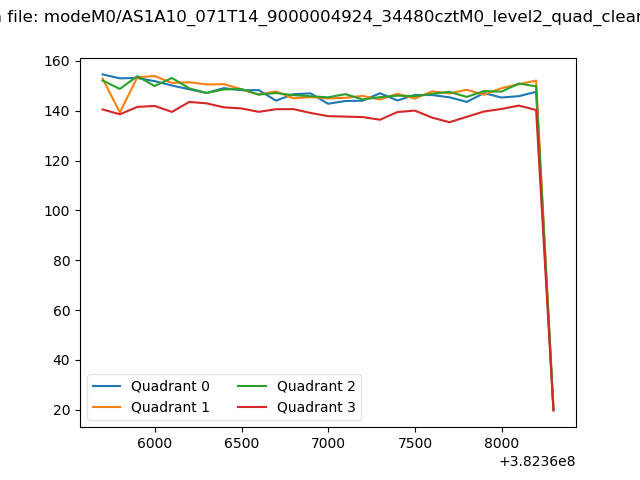 |
|
| Module-wise count rates for Quadrant A Data is divided into 100 sec bins |
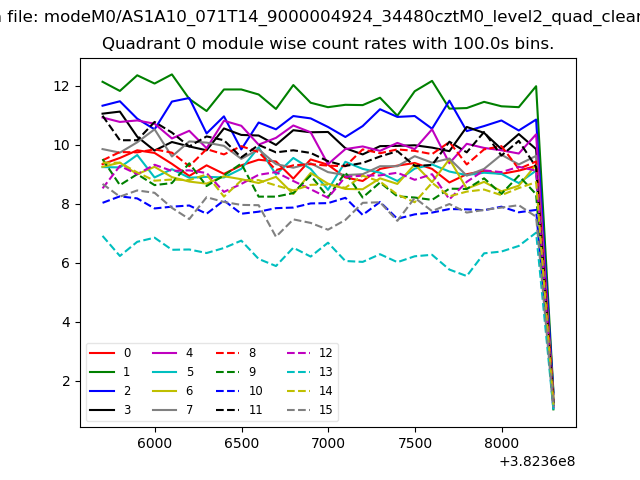 |
 |
| Module-wise count rates for Quadrant B Data is divided into 100 sec bins |
 |
 |
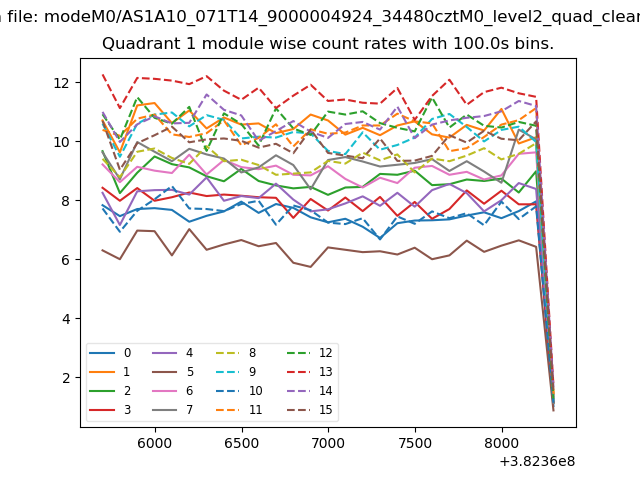
| Module-wise count rates for Quadrant C Data is divided into 100 sec bins |
 |
 |
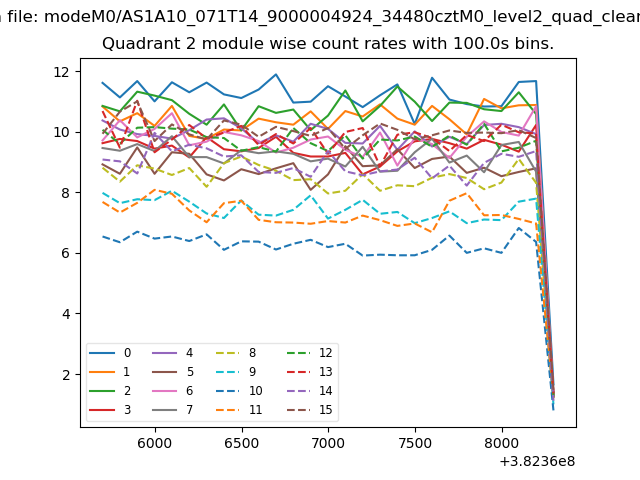
| Module-wise count rates for Quadrant D Data is divided into 100 sec bins |
 |
 |
| Parameter | Plot |
|---|---|
| CZT HV Monitor | 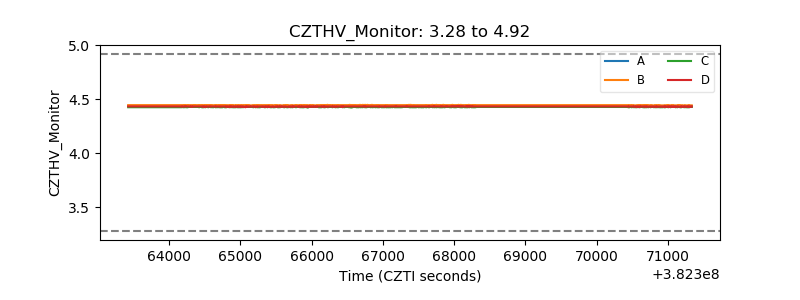 |
| D_VDD | 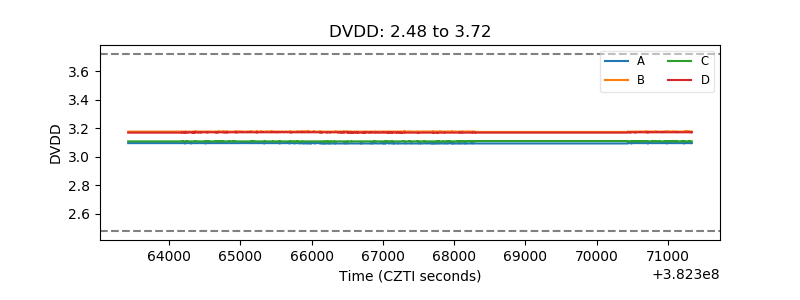 |
| Temperature 1 | 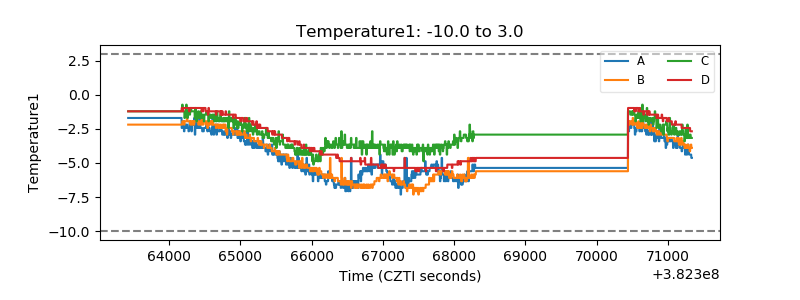 |
| Veto HV Monitor | 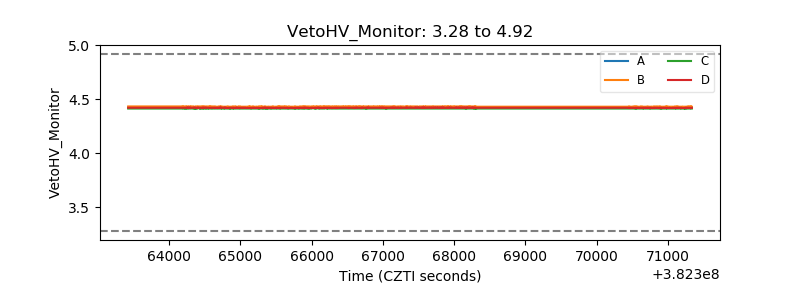 |
| Veto LLD | 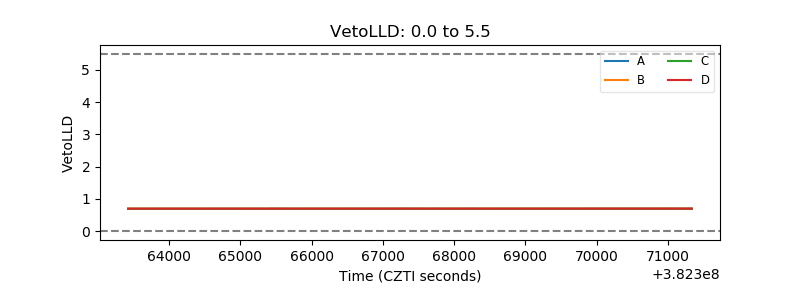 |
| Alpha Counter | 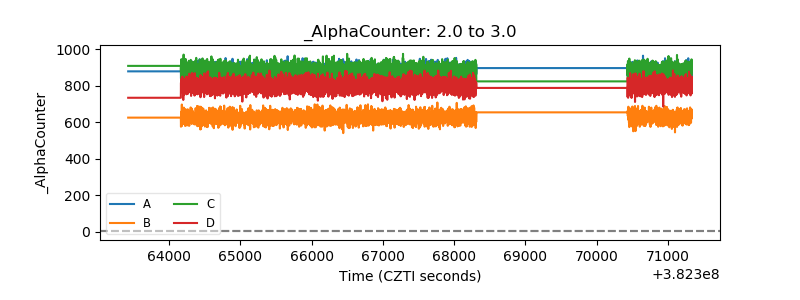 |
| _CPM_Rate | 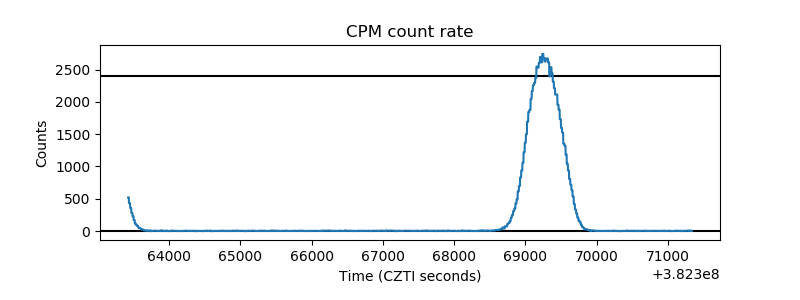 |
| CZT Counter | 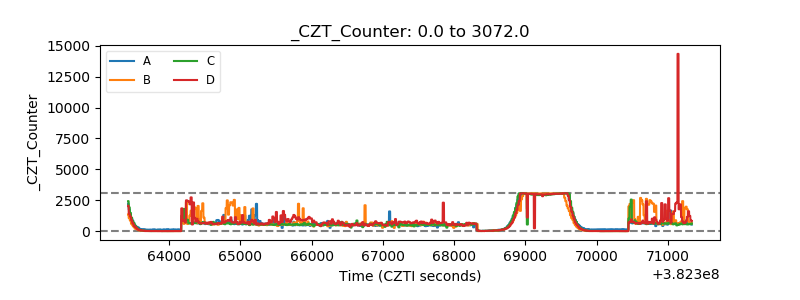 |
| +2.5 Volts monitor | 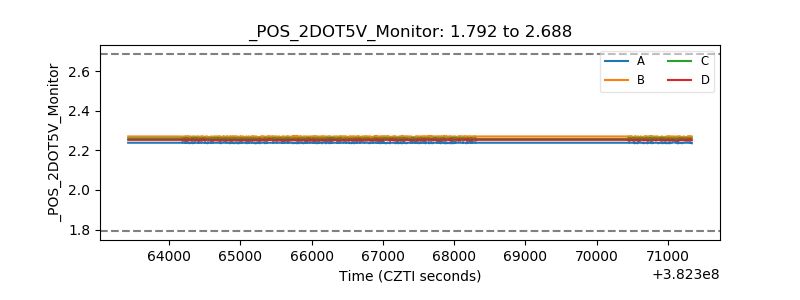 |
| +5 Volts monitor | 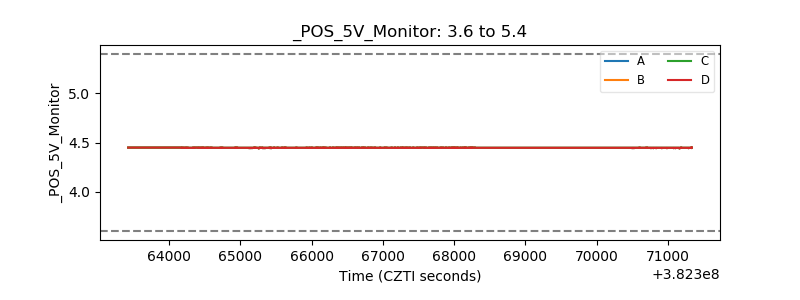 |
| _ROLL_ROT | 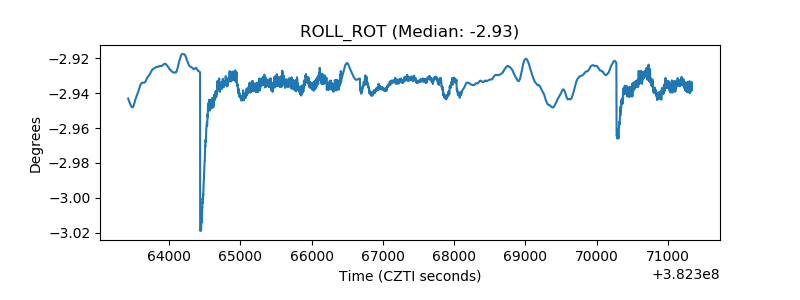 |
| _Roll_DEC | 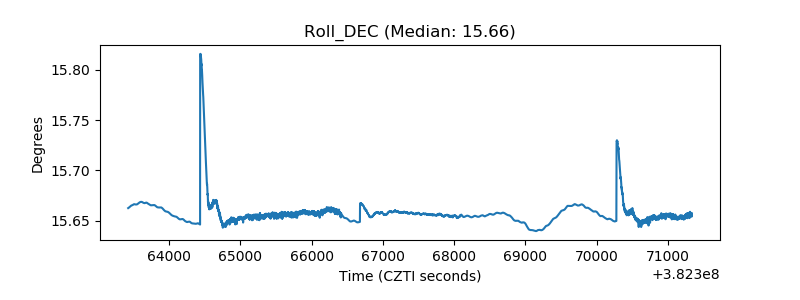 |
| _Roll_RA | 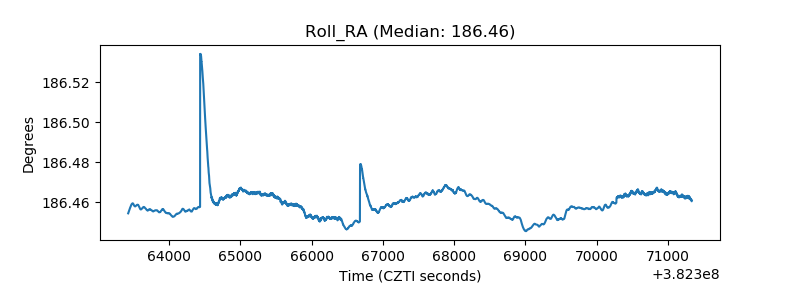 |
| Veto Counter | 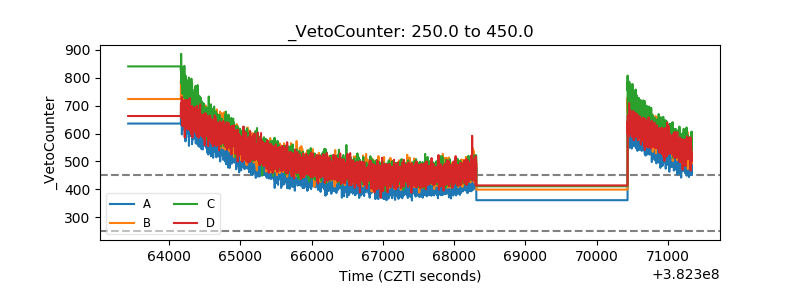 |