| Param | Original file | Final file |
|---|---|---|
| Filename | modeM0/AS1A05_118T04_9000004926_34490cztM0_level2.evt | modeM0/AS1A05_118T04_9000004926_34490cztM0_level2_quad_clean.evt |
| Size (bytes) | 465,960,960 | 59,895,360 |
| Size | 444.4 MB | 57.1 MB |
| Events in quadrant A | 3,014,541 | 363,611 |
| Events in quadrant B | 2,836,140 | 373,286 |
| Events in quadrant C | 2,799,088 | 364,790 |
| Events in quadrant D | 5,095,268 | 333,273 |
| Mode M9 | |||
|---|---|---|---|
| Quadrant | BADHDUFLAG | Total packets | Discarded packets |
| A | 0 | 17 | 0 |
| B | 0 | 17 | 0 |
| C | 0 | 17 | 0 |
| D | 0 | 17 | 0 |
| Mode SS | |||
|---|---|---|---|
| Quadrant | BADHDUFLAG | Total packets | Discarded packets |
| A | 0 | 110 | 0 |
| B | 0 | 110 | 0 |
| C | 0 | 110 | 0 |
| D | 0 | 110 | 0 |
| Mode M0 | |||
|---|---|---|---|
| Quadrant | BADHDUFLAG | Total packets | Discarded packets |
| A | 0 | 12342 | 2 |
| B | 0 | 11725 | 1 |
| C | 0 | 11409 | 1 |
| D | 0 | 18783 | 1 |
| Quadrant | Total seconds | Saturated seconds | Saturation percentage |
|---|---|---|---|
| A | 5404 | 93 | 1.720947% |
| B | 5404 | 44 | 0.814212% |
| C | 5404 | 22 | 0.407106% |
| D | 5404 | 363 | 6.717246% |
Noise dominated data is calculated using 1-second bins in cleaned event files. If a bin has >2000 counts, and if more than 50% of those come from <1% of pixels, then it is considered to be noise-dominated and hence unusable.
| Quadrant | # 1 sec bins | Bins with >0 counts | Bins with >2000 counts | High rate bins dominated by noise | Noise dominated (total time) | Noise dominated (detector-on time) | Marked lightcurve |
|---|---|---|---|---|---|---|---|
| A | 7106 | 5405 | 47 | 47 | 0.66% | 0.87% | 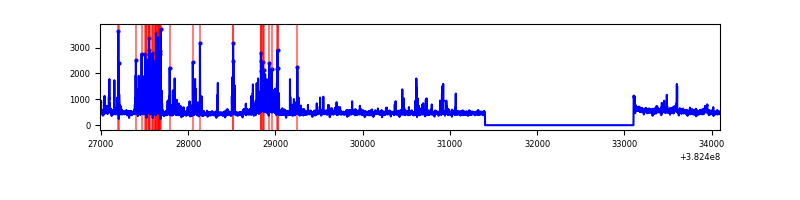 |
| B | 7106 | 5405 | 23 | 23 | 0.32% | 0.43% |  |
| C | 7106 | 5405 | 17 | 17 | 0.24% | 0.31% | 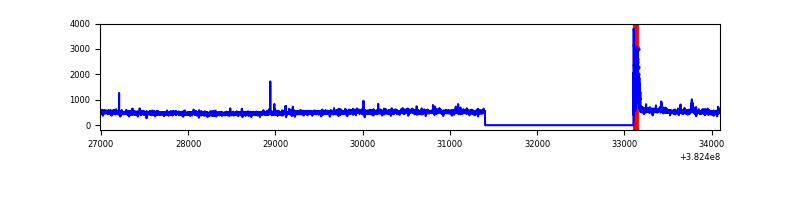 |
| D | 7106 | 5405 | 310 | 310 | 4.36% | 5.74% | 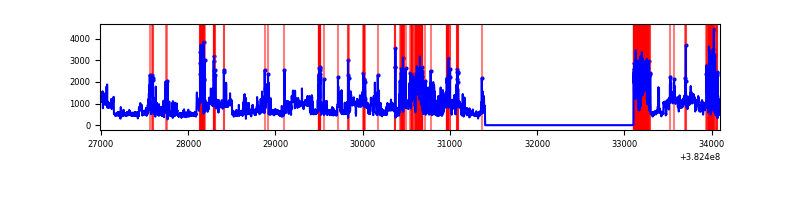 |
Top three noisy pixels from each quadrant. If the there are fewer than three noisy pixels in the level2.evt file, extra rows are filled as -1
| Pixel properties | Quadrant properties | ||||||
|---|---|---|---|---|---|---|---|
| Quadrant | DetID | PixID | Counts | Sigma | Mean | Median | Sigma |
| A | 15 | 169 | 482440 | 3722.75 | 644 | 630 | 129.4 |
| A | 10 | 83 | 24630 | 185.44 | 644 | 630 | 129.4 |
| A | 13 | 6 | 9344 | 67.33 | 644 | 630 | 129.4 |
| B | 5 | 172 | 165764 | 1333.46 | 639 | 621 | 123.8 |
| B | 0 | 189 | 100488 | 806.39 | 639 | 621 | 123.8 |
| B | 5 | 255 | 46739 | 372.38 | 639 | 621 | 123.8 |
| C | 15 | 214 | 227747 | 1575.74 | 622 | 628 | 144.1 |
| C | 0 | 10 | 83641 | 575.94 | 622 | 628 | 144.1 |
| C | 14 | 67 | 28347 | 192.31 | 622 | 628 | 144.1 |
| D | 8 | 195 | 1295257 | 8472.35 | 615 | 599 | 152.8 |
| D | 14 | 52 | 440320 | 2877.57 | 615 | 599 | 152.8 |
| D | 2 | 249 | 311885 | 2037.08 | 615 | 599 | 152.8 |
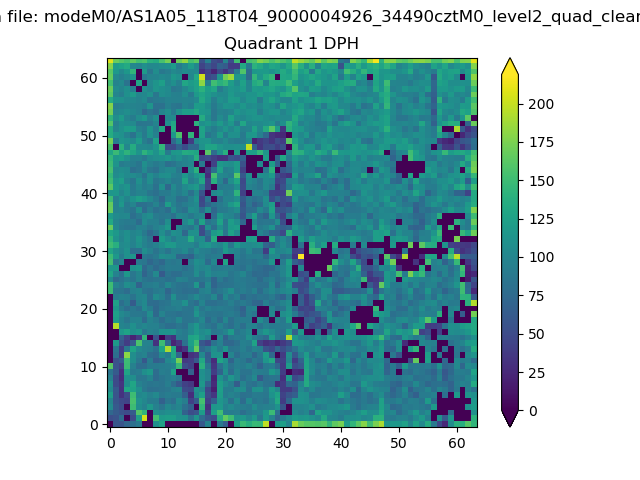
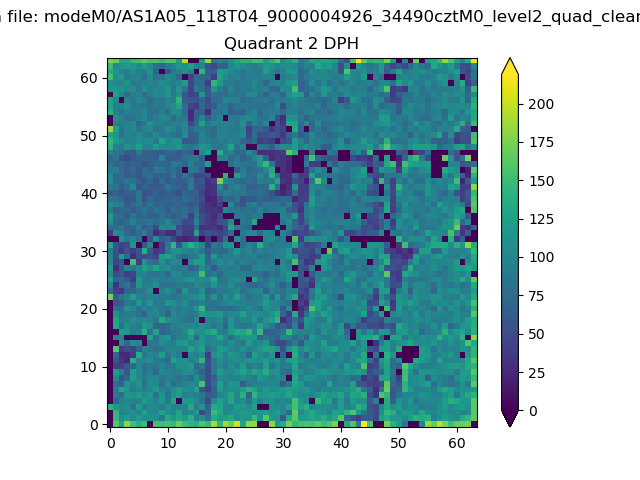
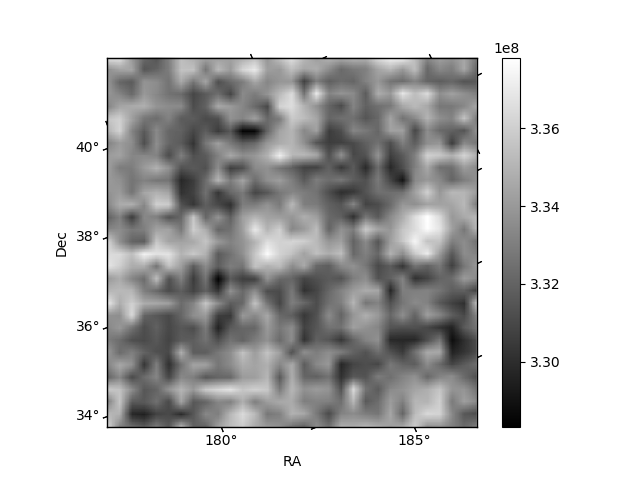
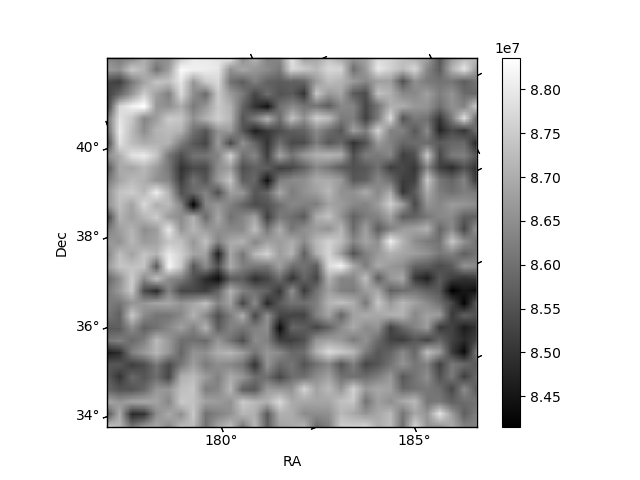
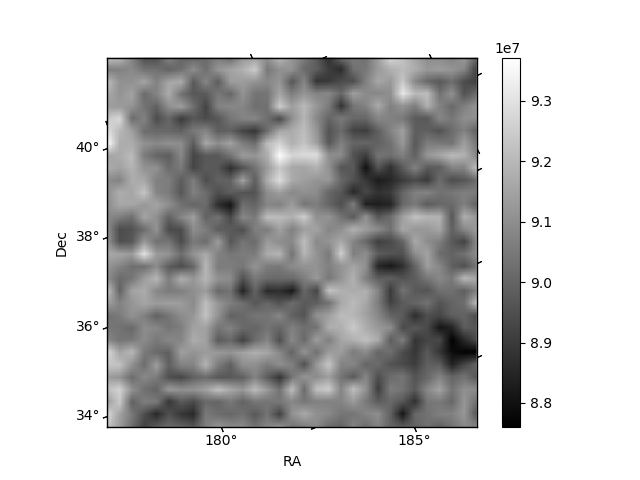
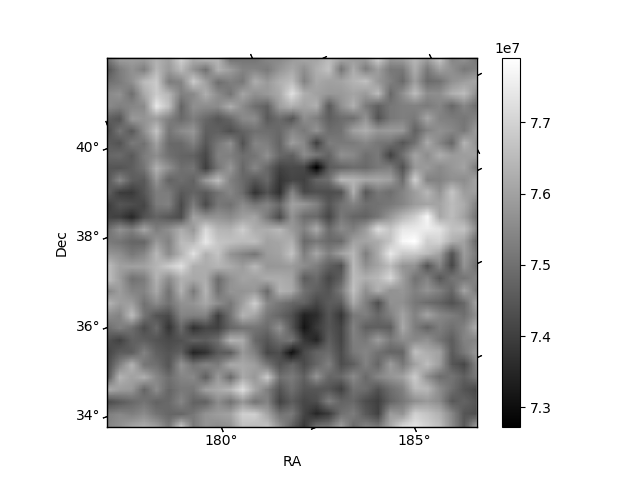
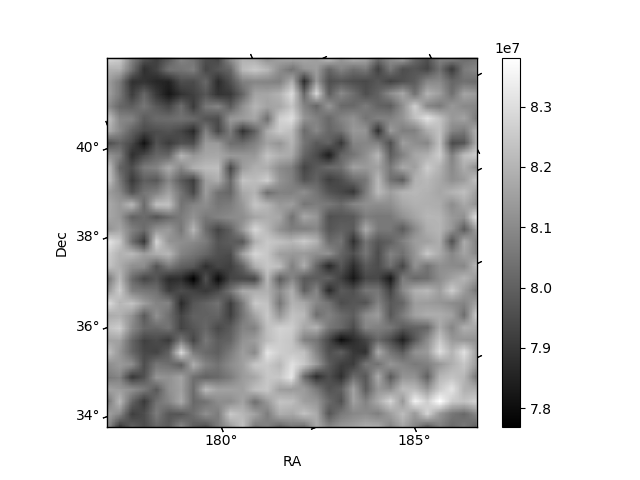
Histogram calculated using DETX and DETY for each event in the final _common_clean file
| Quadrant A | 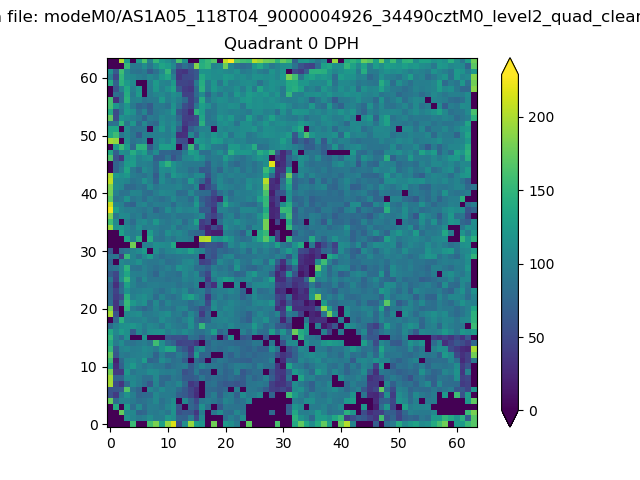 |
 |
Quadrant B |
|---|---|---|---|
| Quadrant D | 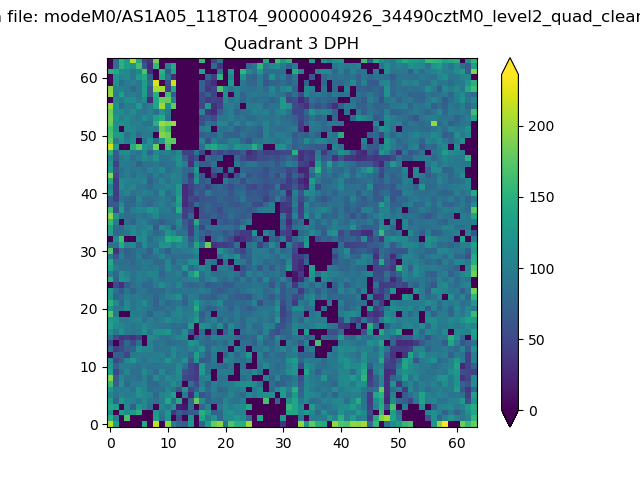 |
 |
Quadrant C |
| Plot type | Count rate plots | Images |
|---|---|---|
| Comparison with Poisson distribution Blue bars denote a histogram of data divided into 1 sec bins. Red curve is a Poisson curve with rate = median count rate of data. |
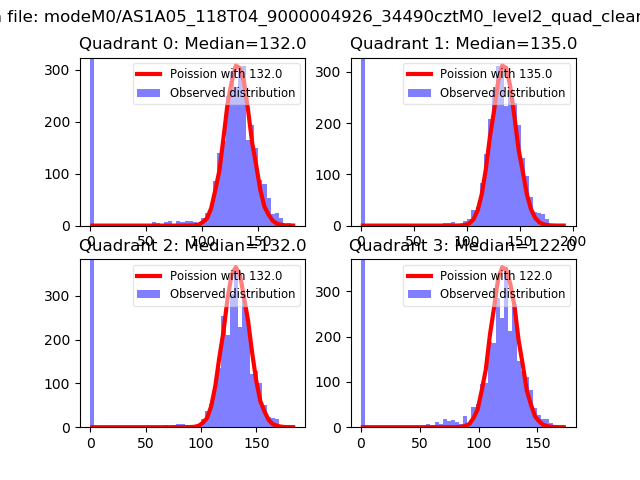 |
 |
| Quadrant-wise count rates Data is divided into 100 sec bins |
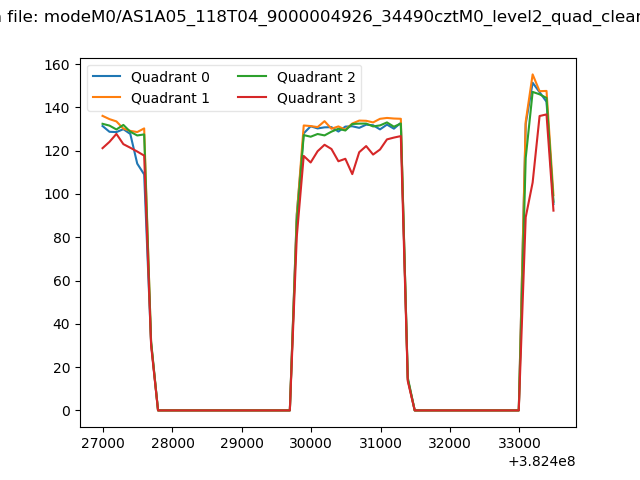 |
|
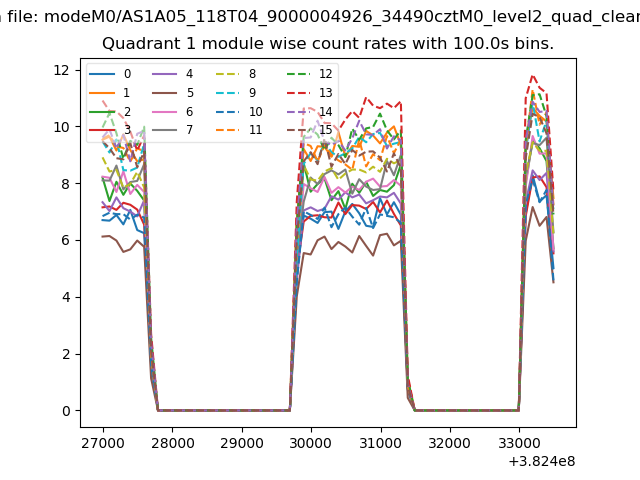
| Module-wise count rates for Quadrant A Data is divided into 100 sec bins |
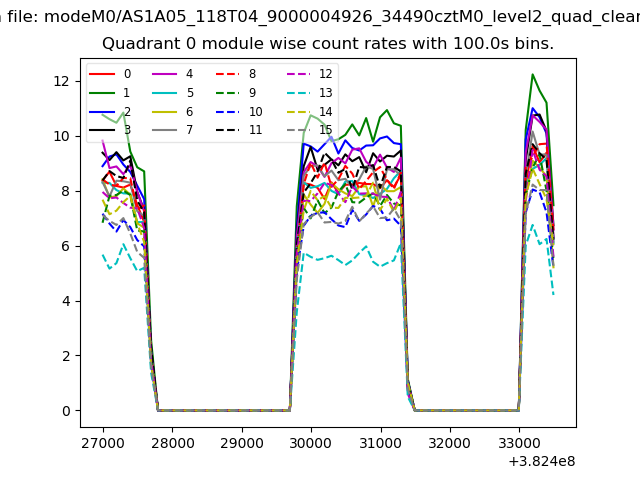 |
 |
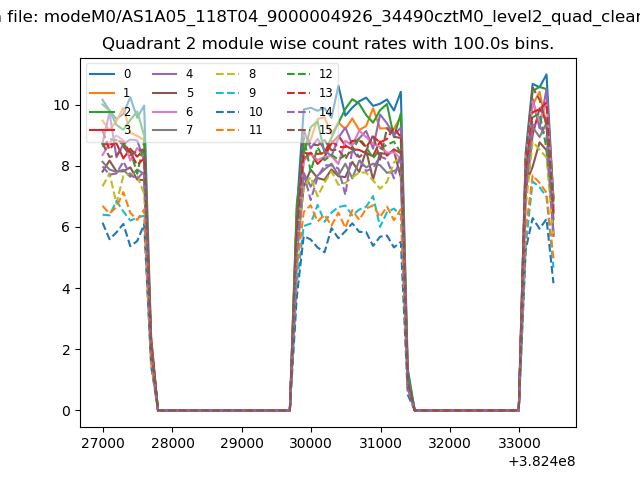
| Module-wise count rates for Quadrant B Data is divided into 100 sec bins |
 |
 |
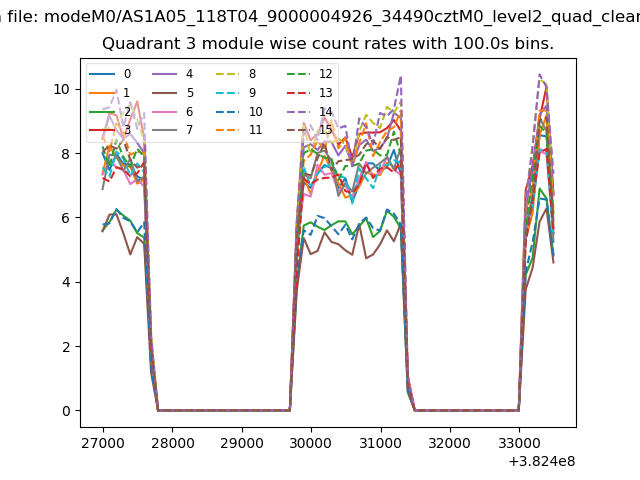
| Module-wise count rates for Quadrant C Data is divided into 100 sec bins |
 |
 |
| Module-wise count rates for Quadrant D Data is divided into 100 sec bins |
 |
 |
| Parameter | Plot |
|---|---|
| CZT HV Monitor |  |
| D_VDD | 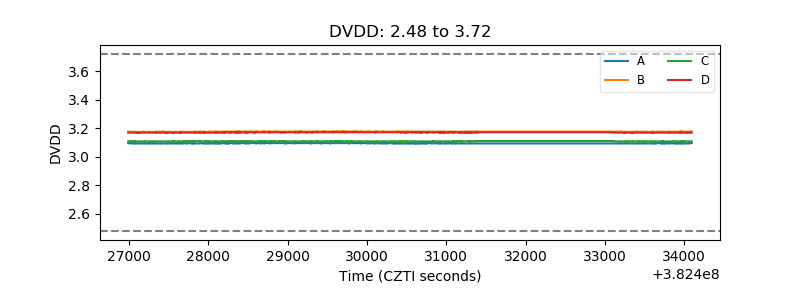 |
| Temperature 1 | 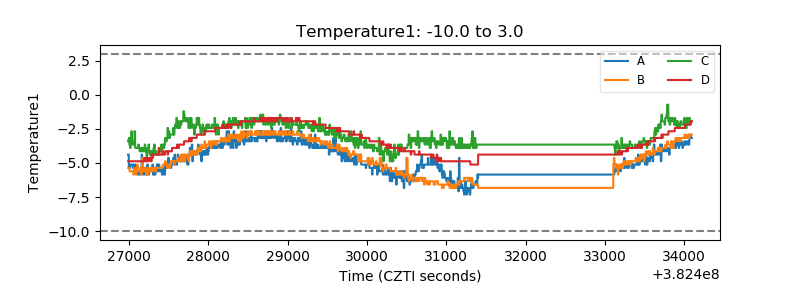 |
| Veto HV Monitor | 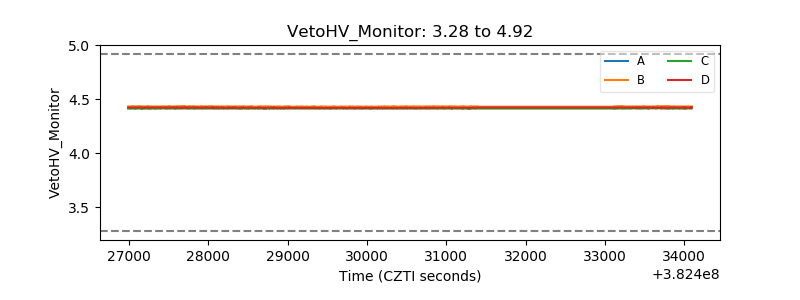 |
| Veto LLD | 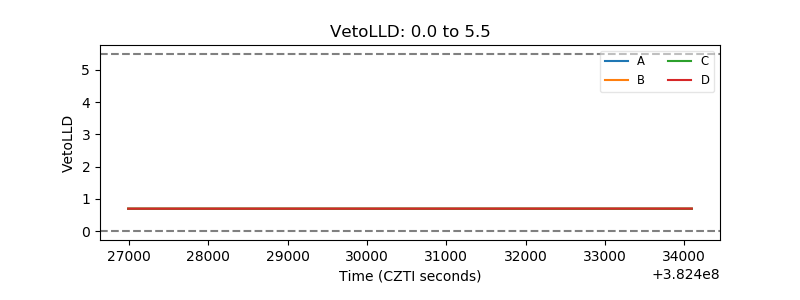 |
| Alpha Counter | 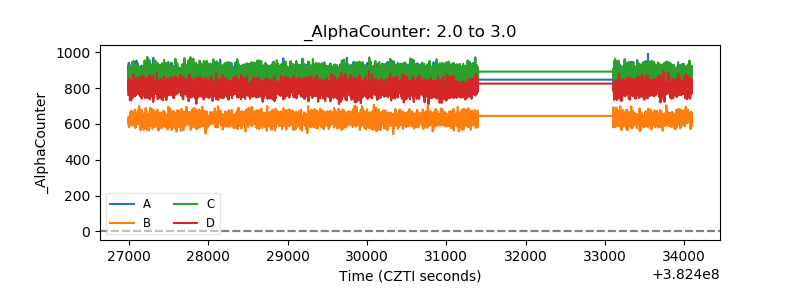 |
| _CPM_Rate | 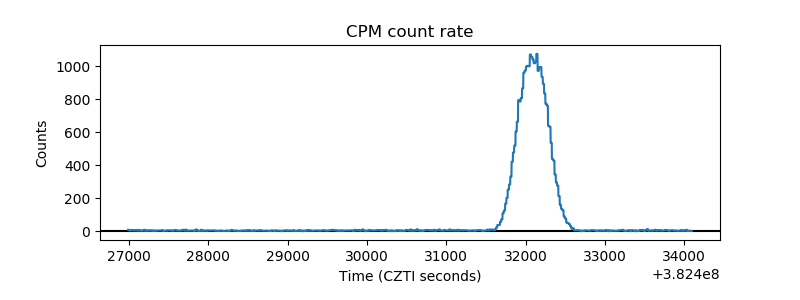 |
| CZT Counter | 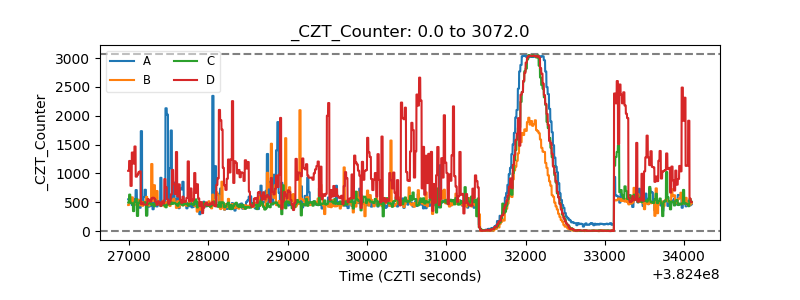 |
| +2.5 Volts monitor | 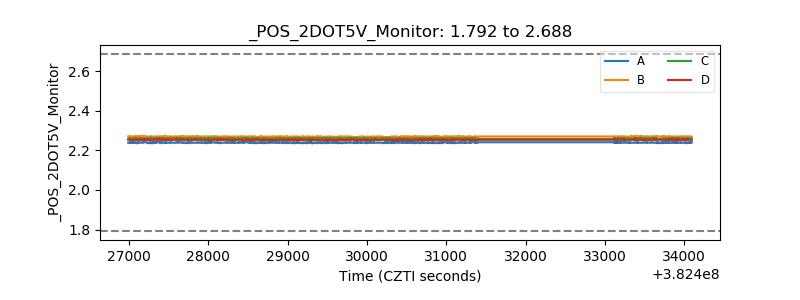 |
| +5 Volts monitor | 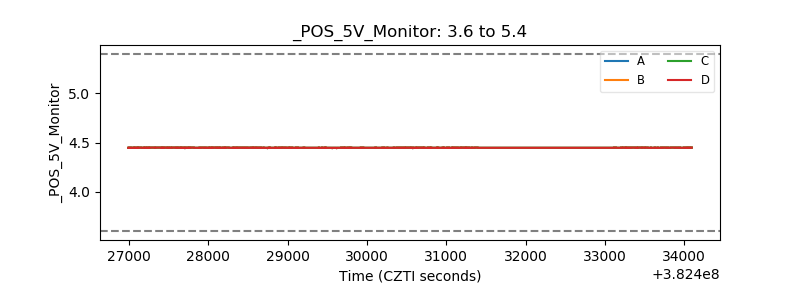 |
| _ROLL_ROT | 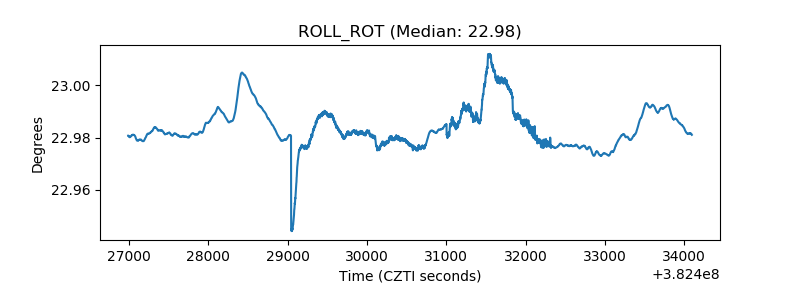 |
| _Roll_DEC | 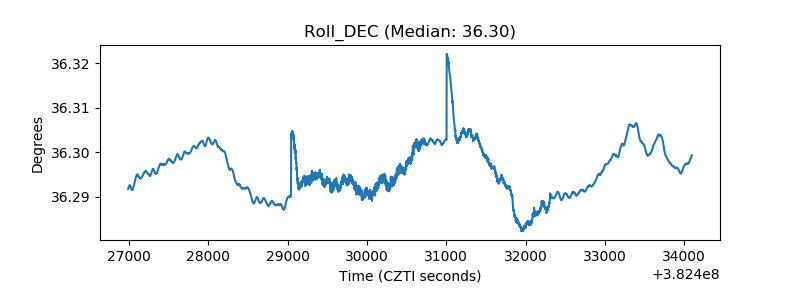 |
| _Roll_RA | 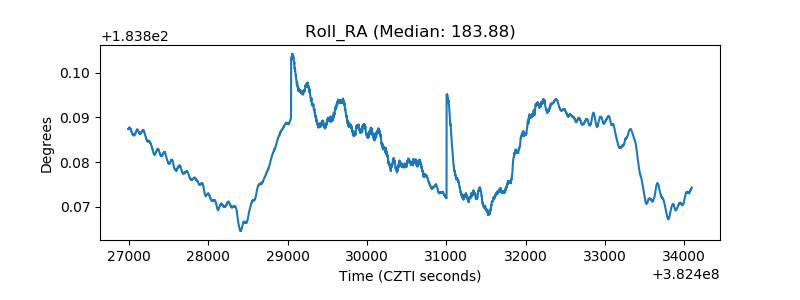 |
| Veto Counter | 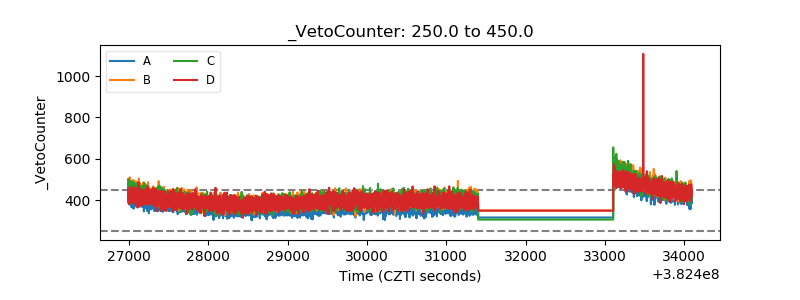 |