| Param | Original file | Final file |
|---|---|---|
| Filename | modeM0/AS1A05_118T04_9000004926cztM0_level2_bc.evt | modeM0/AS1A05_118T04_9000004926cztM0_level2_quad_clean.evt |
| Size (bytes) | 615,084,480 | 144,227,520 |
| Size | 586.6 MB | 137.5 MB |
| Events in quadrant A | 3,030,608 | 880,804 |
| Events in quadrant B | 4,303,514 | 886,204 |
| Events in quadrant C | 3,549,805 | 876,736 |
| Events in quadrant D | 6,849,022 | 821,482 |
| Mode M9 | |||
|---|---|---|---|
| Quadrant | BADHDUFLAG | Total packets | Discarded packets |
| A | 0 | 31 | 0 |
| B | 0 | 31 | 0 |
| C | 0 | 31 | 0 |
| D | 0 | 31 | 0 |
| Mode SS | |||
|---|---|---|---|
| Quadrant | BADHDUFLAG | Total packets | Discarded packets |
| A | 0 | 266 | 0 |
| B | 0 | 266 | 0 |
| C | 0 | 266 | 0 |
| D | 0 | 266 | 0 |
| Mode M0 | |||
|---|---|---|---|
| Quadrant | BADHDUFLAG | Total packets | Discarded packets |
| A | 0 | 27364 | 0 |
| B | 0 | 33352 | 0 |
| C | 0 | 27966 | 0 |
| D | 0 | 40096 | 0 |
| Quadrant | Total seconds | Saturated seconds | Saturation percentage |
|---|---|---|---|
| A | 13062 | 26 | 0.199051% |
| B | 13062 | 738 | 5.649977% |
| C | 13062 | 50 | 0.382790% |
| D | 13062 | 558 | 4.271934% |
Noise dominated data is calculated using 1-second bins in cleaned event files. If a bin has >2000 counts, and if more than 50% of those come from <1% of pixels, then it is considered to be noise-dominated and hence unusable.
| Quadrant | # 1 sec bins | Bins with >0 counts | Bins with >2000 counts | High rate bins dominated by noise | Noise dominated (total time) | Noise dominated (detector-on time) | Marked lightcurve |
|---|---|---|---|---|---|---|---|
| A | 39680 | 13065 | 4 | 4 | 0.01% | 0.03% | 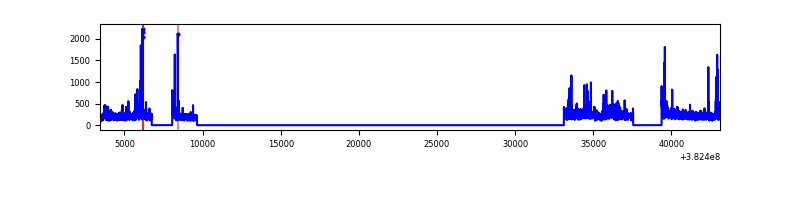 |
| B | 39680 | 13063 | 30 | 30 | 0.08% | 0.23% | 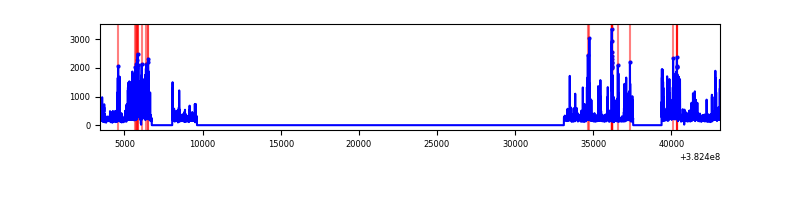 |
| C | 39680 | 13064 | 18 | 18 | 0.05% | 0.14% | 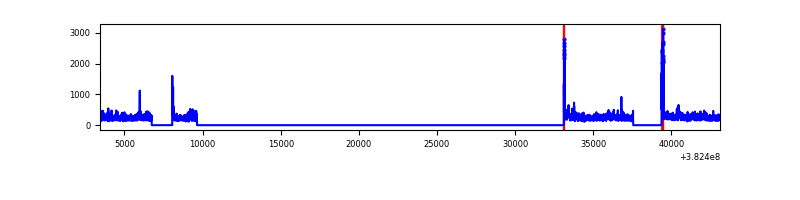 |
| D | 39680 | 13064 | 149 | 149 | 0.38% | 1.14% | 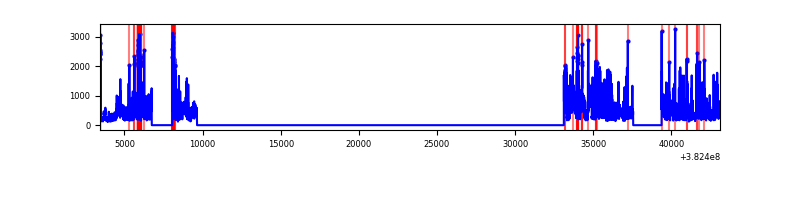 |
Top three noisy pixels from each quadrant. If the there are fewer than three noisy pixels in the level2.evt file, extra rows are filled as -1
| Pixel properties | Quadrant properties | ||||||
|---|---|---|---|---|---|---|---|
| Quadrant | DetID | PixID | Counts | Sigma | Mean | Median | Sigma |
| A | 15 | 169 | 192182 | 1222.02 | 703 | 691 | 156.7 |
| A | 10 | 83 | 55981 | 352.84 | 703 | 691 | 156.7 |
| A | 9 | 143 | 37824 | 236.97 | 703 | 691 | 156.7 |
| B | 5 | 172 | 942351 | 6868.95 | 689 | 676 | 137.1 |
| B | 0 | 189 | 334205 | 2432.89 | 689 | 676 | 137.1 |
| B | 5 | 255 | 113177 | 820.63 | 689 | 676 | 137.1 |
| C | 15 | 214 | 523959 | 3379.98 | 682 | 677 | 154.8 |
| C | 0 | 10 | 164778 | 1059.96 | 682 | 677 | 154.8 |
| C | 14 | 67 | 160037 | 1029.34 | 682 | 677 | 154.8 |
| D | 8 | 195 | 2392984 | 14785.7 | 677 | 657 | 161.8 |
| D | 14 | 52 | 313402 | 1932.91 | 677 | 657 | 161.8 |
| D | 12 | 79 | 282046 | 1739.12 | 677 | 657 | 161.8 |
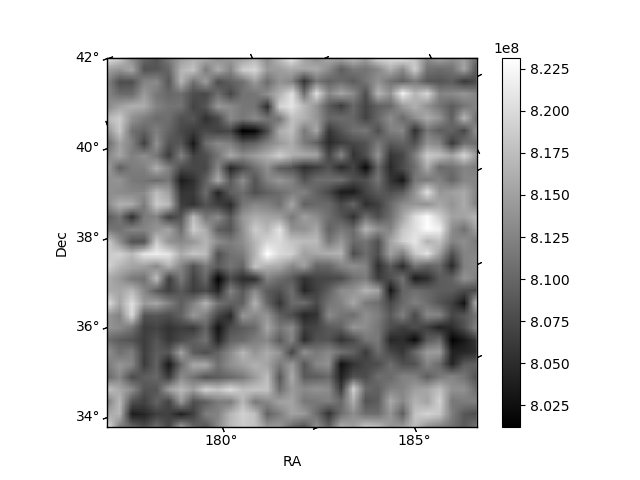
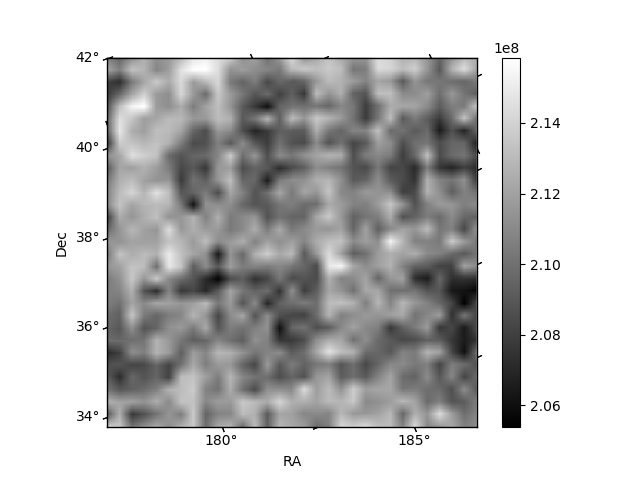
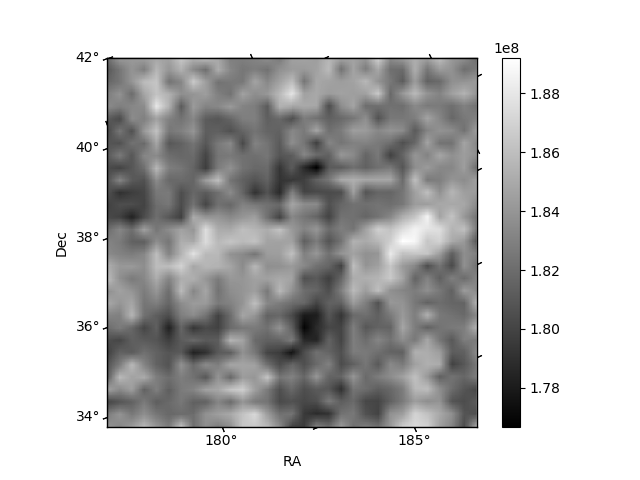
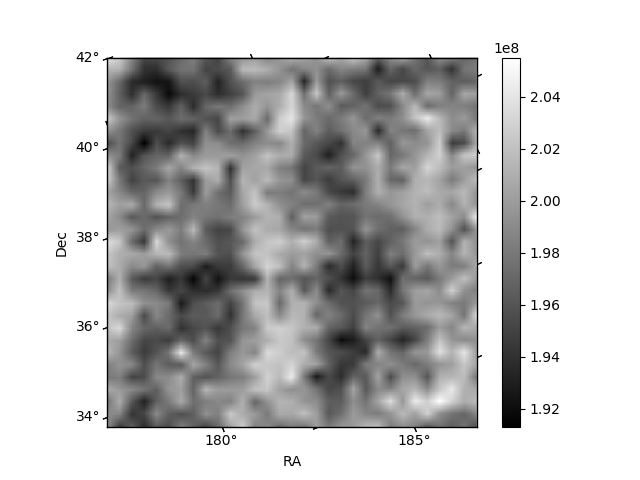
Histogram calculated using DETX and DETY for each event in the final _common_clean file
| Quadrant A | 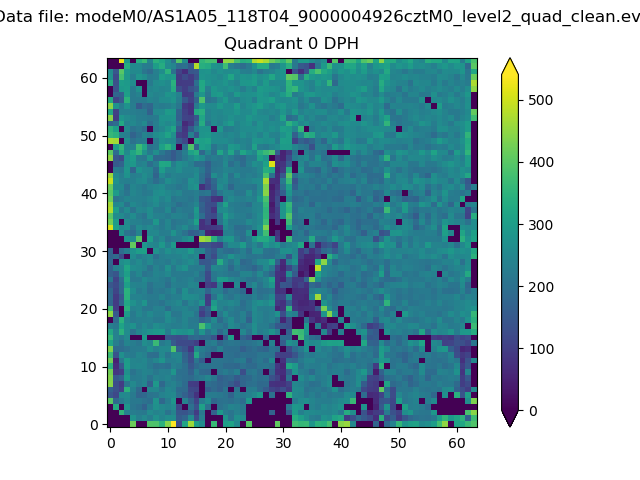 |
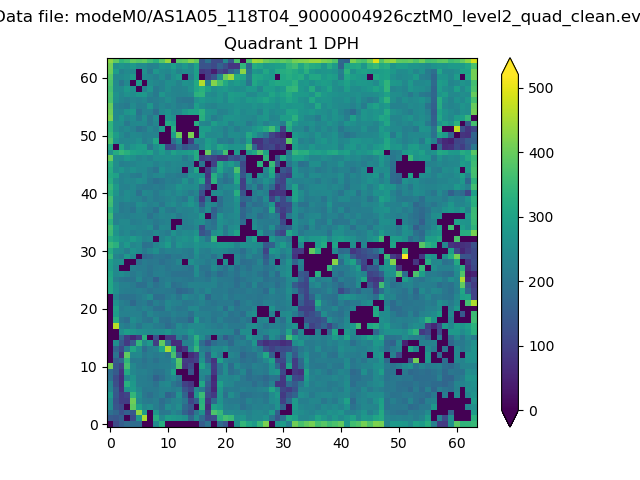 |
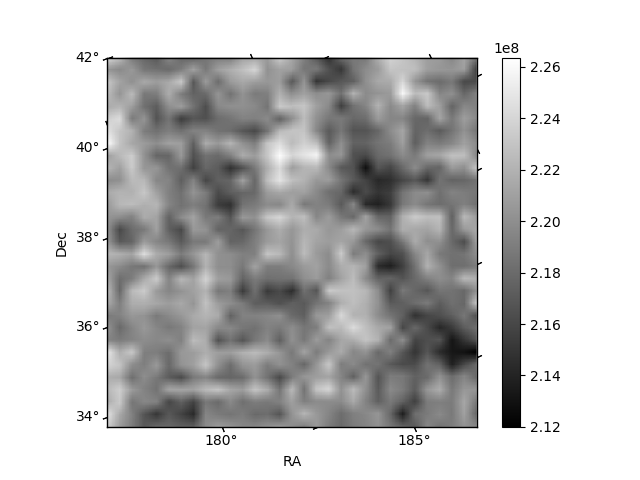
Quadrant B |
|---|---|---|---|
| Quadrant D | 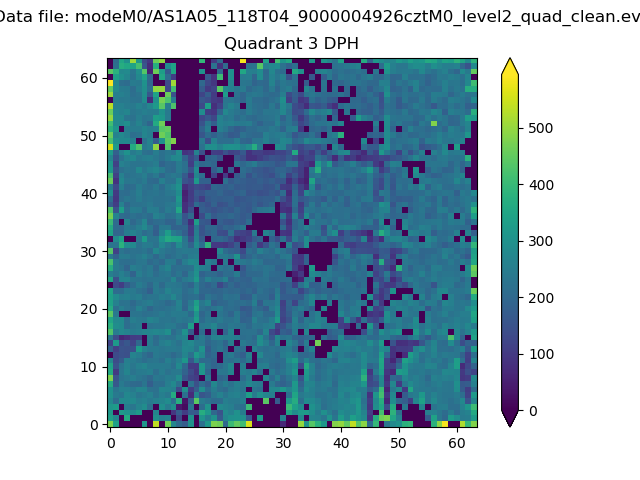 |
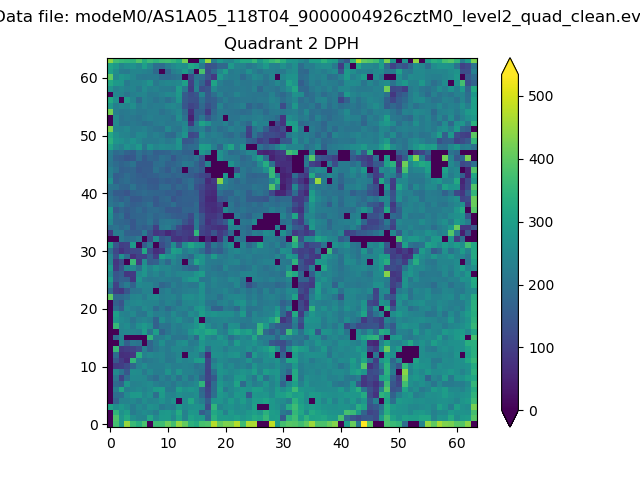 |
Quadrant C |
| Plot type | Count rate plots | Images |
|---|---|---|
| Comparison with Poisson distribution Blue bars denote a histogram of data divided into 1 sec bins. Red curve is a Poisson curve with rate = median count rate of data. |
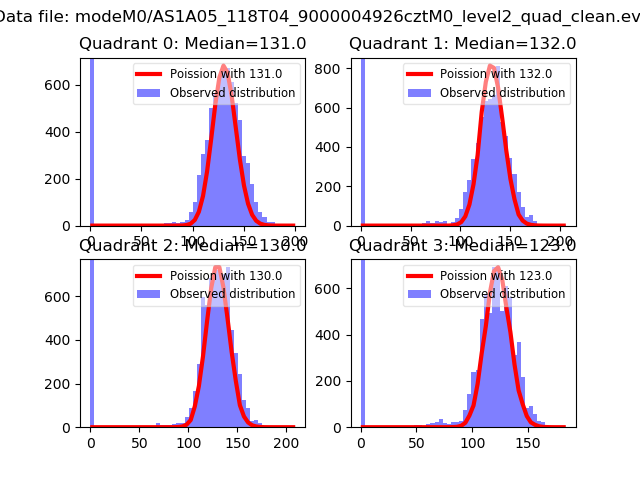 |
 |
| Quadrant-wise count rates Data is divided into 100 sec bins |
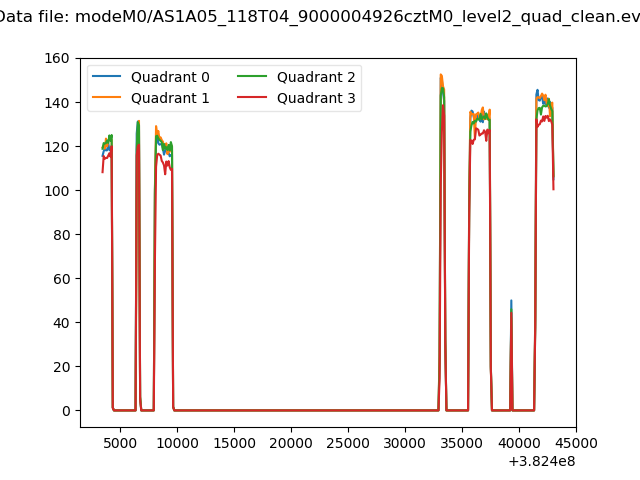 |
|
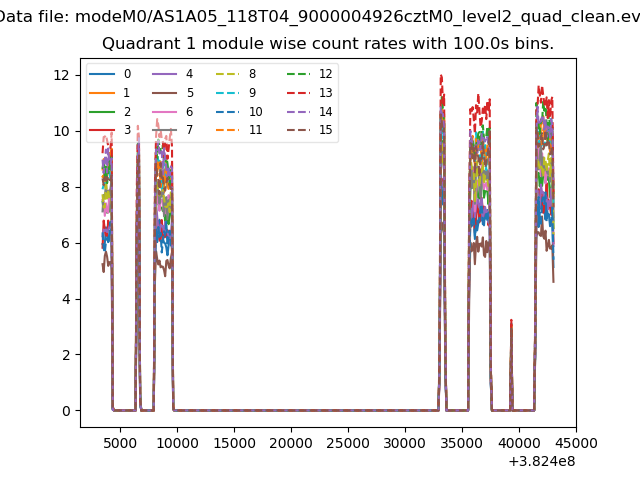
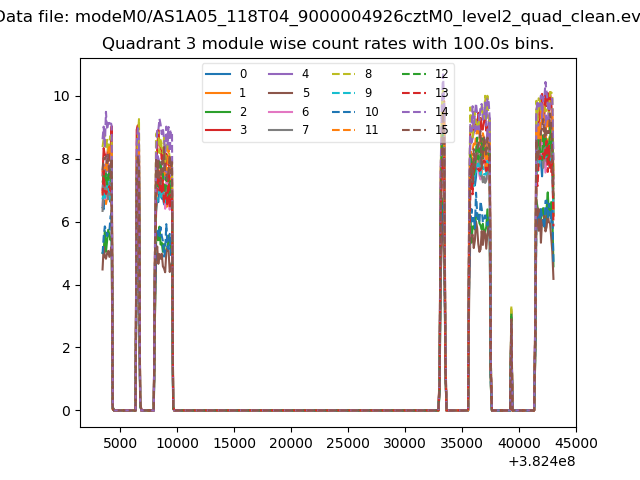
| Module-wise count rates for Quadrant A Data is divided into 100 sec bins |
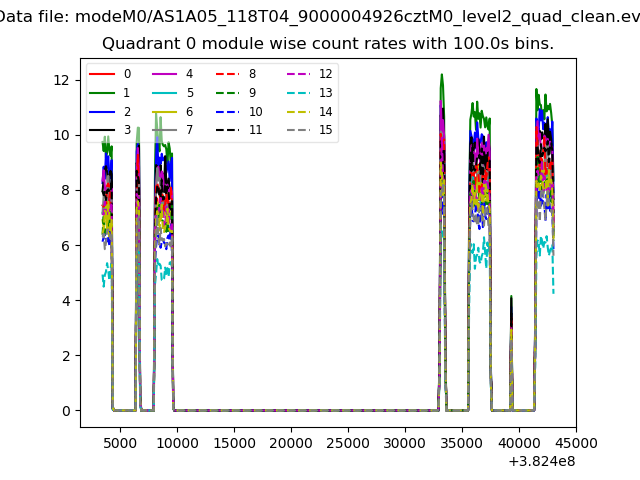 |
 |
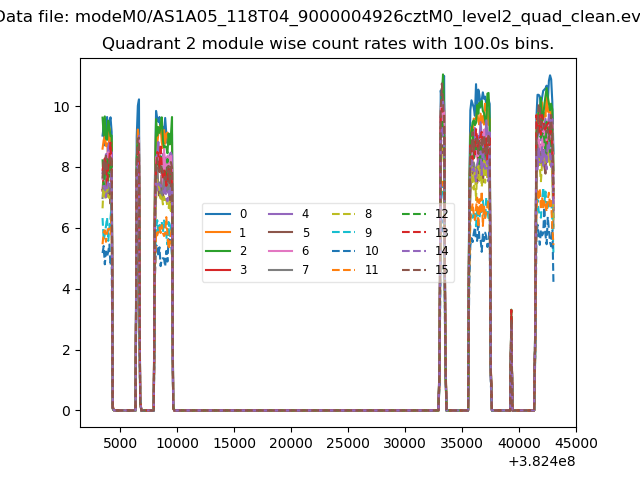
| Module-wise count rates for Quadrant B Data is divided into 100 sec bins |
 |
 |
| Module-wise count rates for Quadrant C Data is divided into 100 sec bins |
 |
 |
| Module-wise count rates for Quadrant D Data is divided into 100 sec bins |
 |
 |
| Parameter | Plot |
|---|---|
| CZT HV Monitor | 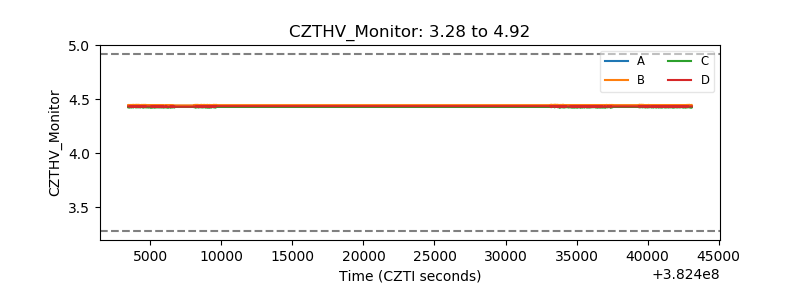 |
| D_VDD | 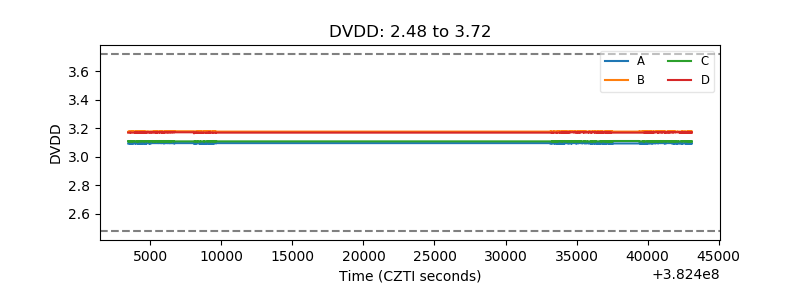 |
| Temperature 1 | 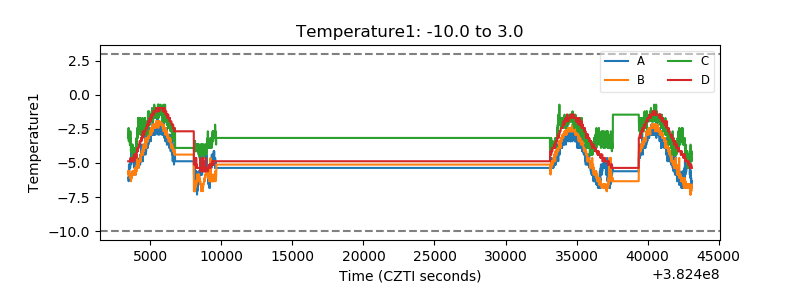 |
| Veto HV Monitor | 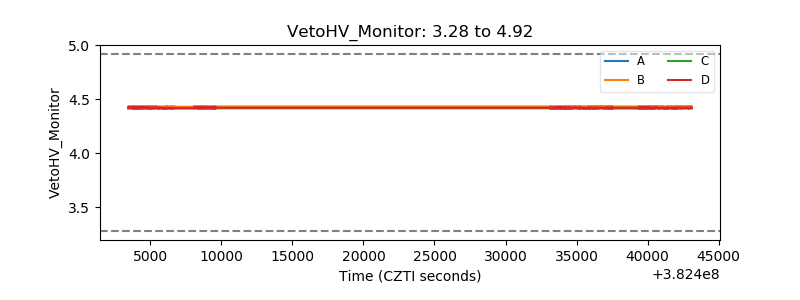 |
| Veto LLD | 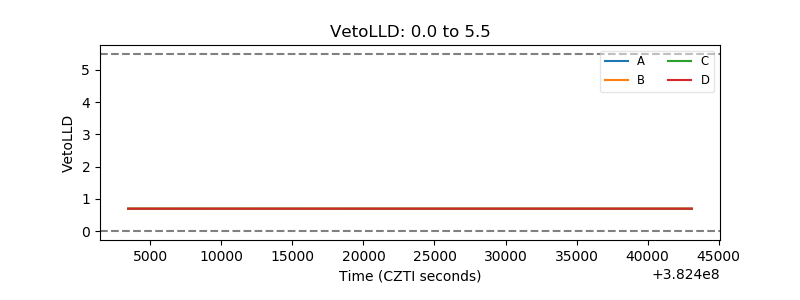 |
| Alpha Counter | 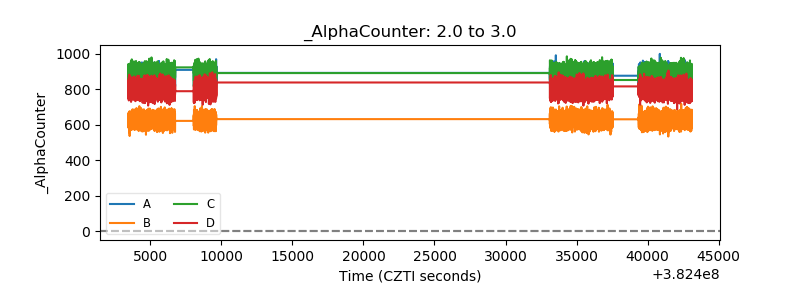 |
| _CPM_Rate | 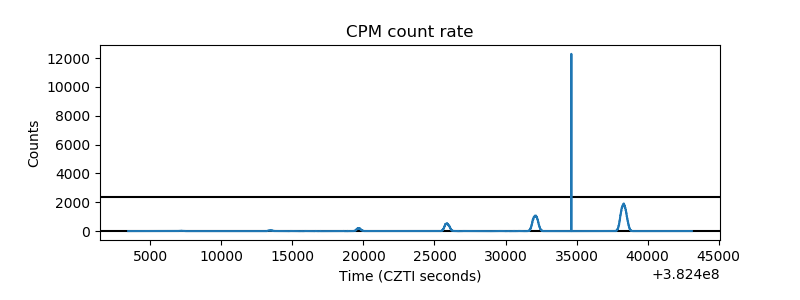 |
| CZT Counter | 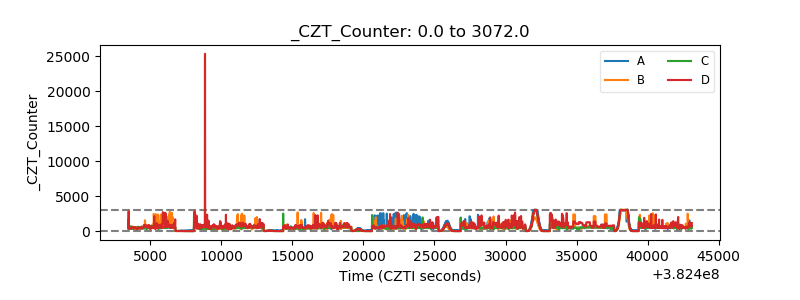 |
| +2.5 Volts monitor | 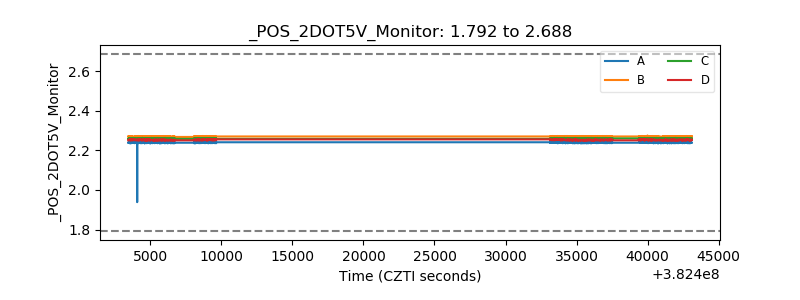 |
| +5 Volts monitor | 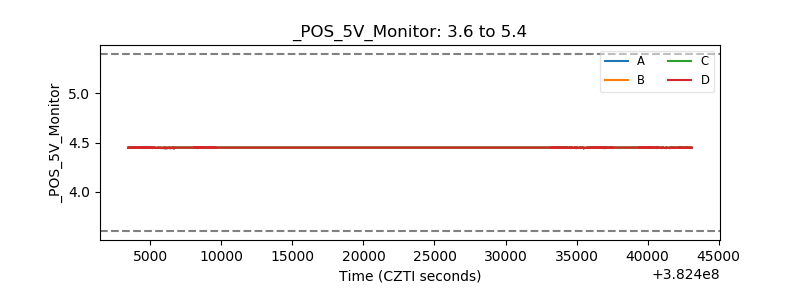 |
| _ROLL_ROT | 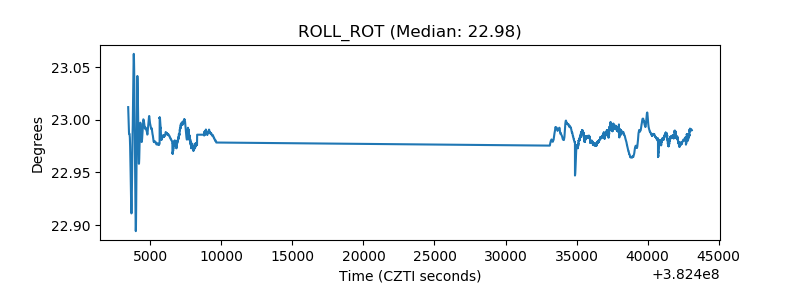 |
| _Roll_DEC | 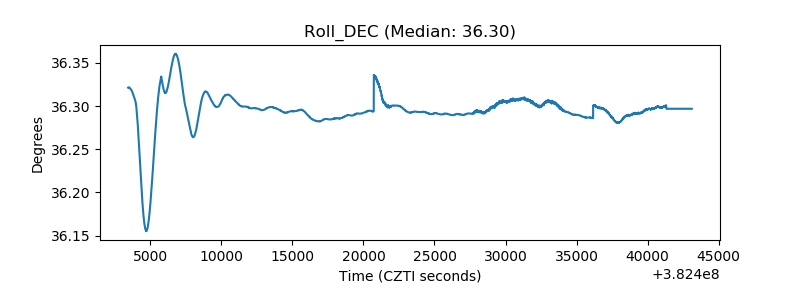 |
| _Roll_RA | 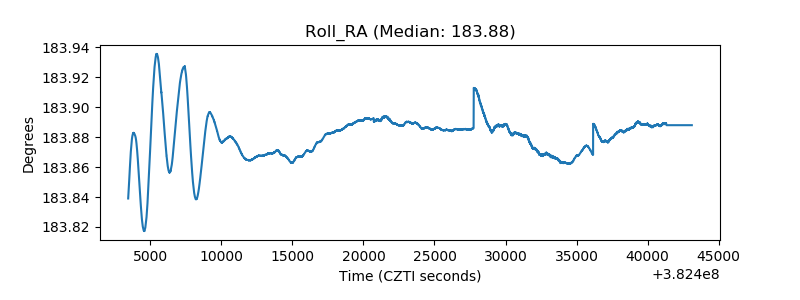 |
| Veto Counter | 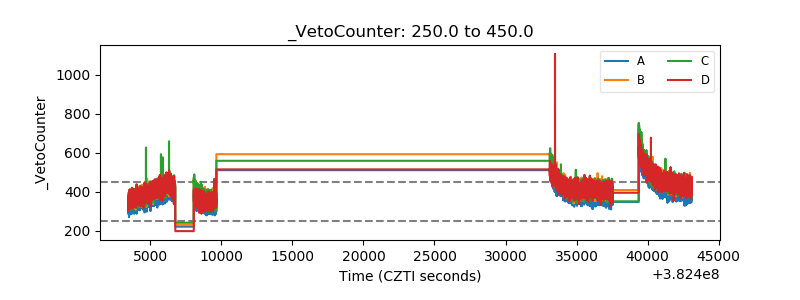 |