| Param | Original file | Final file |
|---|---|---|
| Filename | modeM0/AS1A10_071T13_9000004922_34479cztM0_level2.evt | modeM0/AS1A10_071T13_9000004922_34479cztM0_level2_quad_clean.evt |
| Size (bytes) | 276,638,400 | 25,951,680 |
| Size | 263.8 MB | 24.7 MB |
| Events in quadrant A | 1,577,399 | 146,856 |
| Events in quadrant B | 2,210,482 | 145,116 |
| Events in quadrant C | 1,825,958 | 144,048 |
| Events in quadrant D | 2,561,765 | 137,951 |
| Mode M9 | |||
|---|---|---|---|
| Quadrant | BADHDUFLAG | Total packets | Discarded packets |
| A | 0 | 9 | 0 |
| B | 0 | 9 | 0 |
| C | 0 | 9 | 0 |
| D | 0 | 10 | 0 |
| Mode SS | |||
|---|---|---|---|
| Quadrant | BADHDUFLAG | Total packets | Discarded packets |
| A | 0 | 60 | 0 |
| B | 0 | 60 | 0 |
| C | 0 | 60 | 0 |
| D | 0 | 60 | 0 |
| Mode M0 | |||
|---|---|---|---|
| Quadrant | BADHDUFLAG | Total packets | Discarded packets |
| A | 0 | 6370 | 1 |
| B | 0 | 8371 | 1 |
| C | 0 | 7138 | 1 |
| D | 0 | 9743 | 1 |
| Quadrant | Total seconds | Saturated seconds | Saturation percentage |
|---|---|---|---|
| A | 2960 | 7 | 0.236486% |
| B | 2960 | 277 | 9.358108% |
| C | 2960 | 59 | 1.993243% |
| D | 2960 | 104 | 3.513514% |
Noise dominated data is calculated using 1-second bins in cleaned event files. If a bin has >2000 counts, and if more than 50% of those come from <1% of pixels, then it is considered to be noise-dominated and hence unusable.
| Quadrant | # 1 sec bins | Bins with >0 counts | Bins with >2000 counts | High rate bins dominated by noise | Noise dominated (total time) | Noise dominated (detector-on time) | Marked lightcurve |
|---|---|---|---|---|---|---|---|
| A | 2960 | 2960 | 0 | 0 | 0.00% | 0.00% | 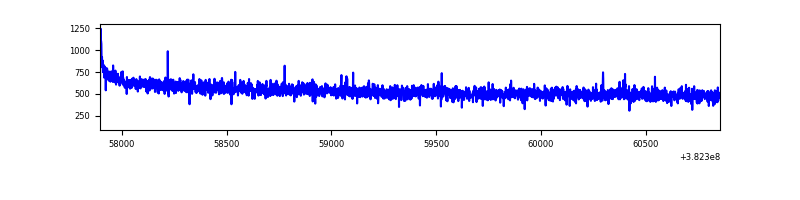 |
| B | 2960 | 2960 | 214 | 214 | 7.23% | 7.23% | 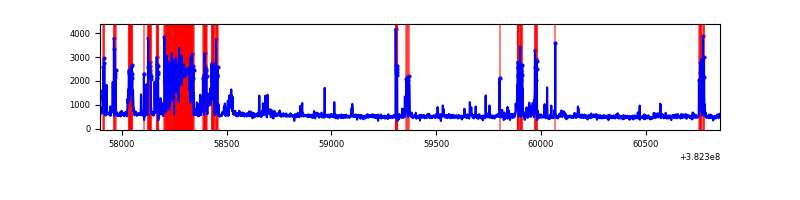 |
| C | 2960 | 2960 | 41 | 41 | 1.39% | 1.39% | 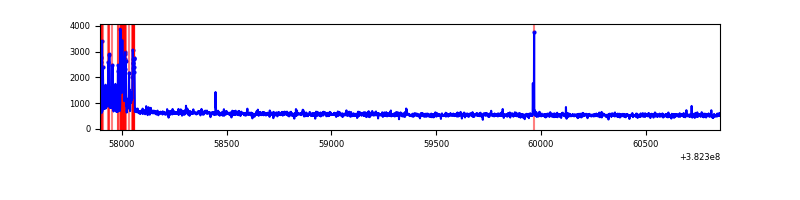 |
| D | 2960 | 2960 | 68 | 68 | 2.30% | 2.30% | 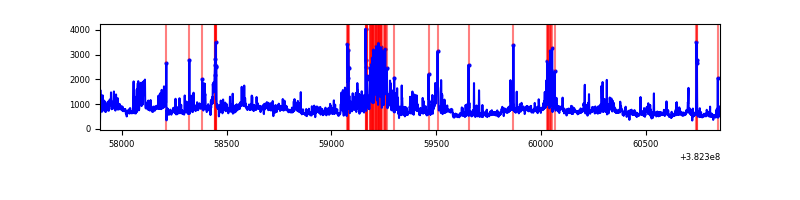 |
Top three noisy pixels from each quadrant. If the there are fewer than three noisy pixels in the level2.evt file, extra rows are filled as -1
| Pixel properties | Quadrant properties | ||||||
|---|---|---|---|---|---|---|---|
| Quadrant | DetID | PixID | Counts | Sigma | Mean | Median | Sigma |
| A | 10 | 83 | 19671 | 238.45 | 399 | 392 | 80.9 |
| A | 13 | 254 | 9013 | 106.63 | 399 | 392 | 80.9 |
| A | 15 | 169 | 6220 | 72.08 | 399 | 392 | 80.9 |
| B | 5 | 172 | 587297 | 8209.55 | 373 | 364 | 71.5 |
| B | 0 | 189 | 66178 | 920.55 | 373 | 364 | 71.5 |
| B | 4 | 232 | 58323 | 810.68 | 373 | 364 | 71.5 |
| C | 15 | 214 | 127502 | 1440.08 | 384 | 388 | 88.3 |
| C | 15 | 208 | 102402 | 1155.73 | 384 | 388 | 88.3 |
| C | 0 | 10 | 65928 | 742.51 | 384 | 388 | 88.3 |
| D | 8 | 195 | 364196 | 3820.02 | 386 | 375 | 95.2 |
| D | 14 | 52 | 304768 | 3196.04 | 386 | 375 | 95.2 |
| D | 7 | 223 | 110577 | 1157.09 | 386 | 375 | 95.2 |
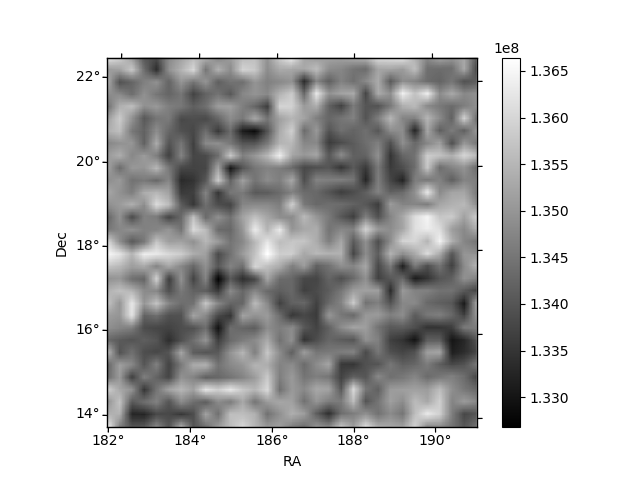
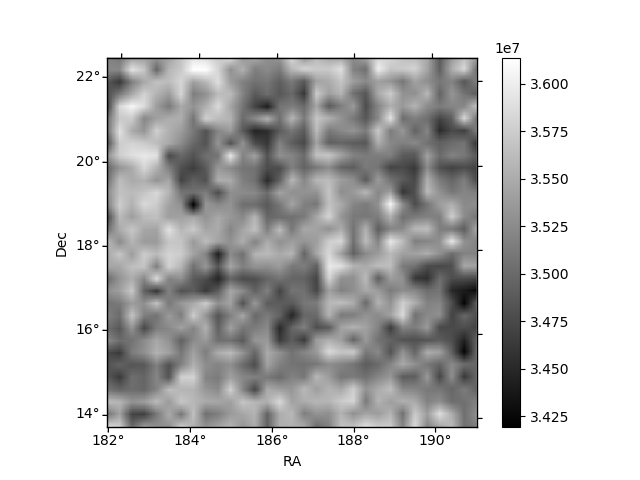
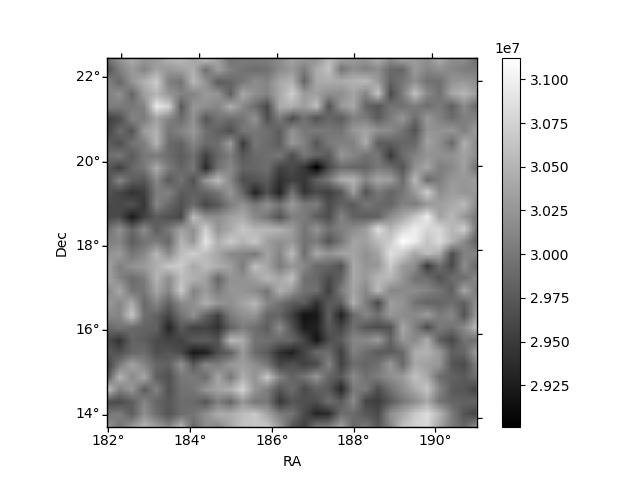
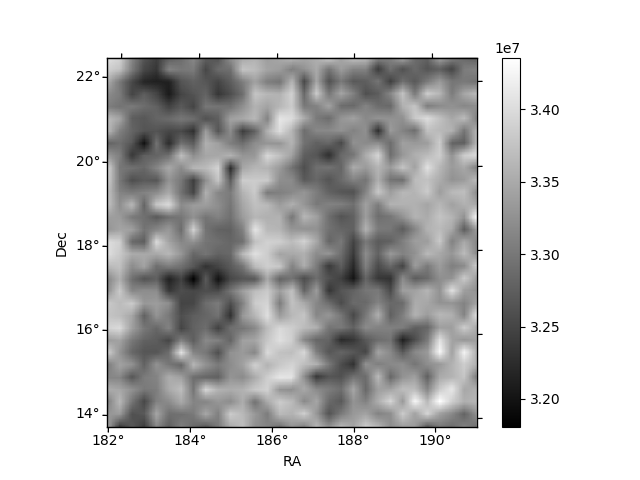
Histogram calculated using DETX and DETY for each event in the final _common_clean file
| Quadrant A | 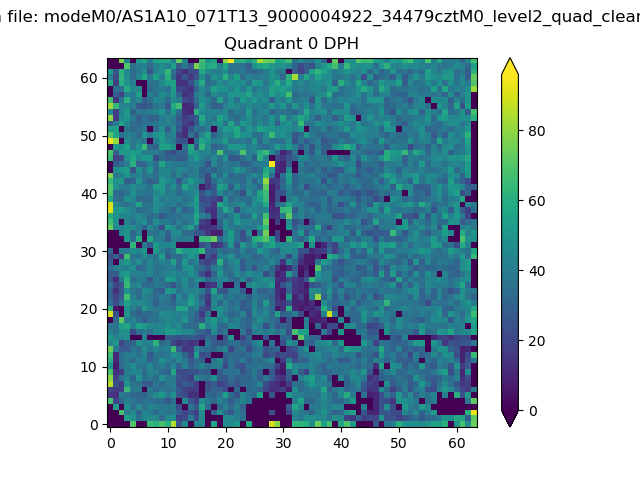 |
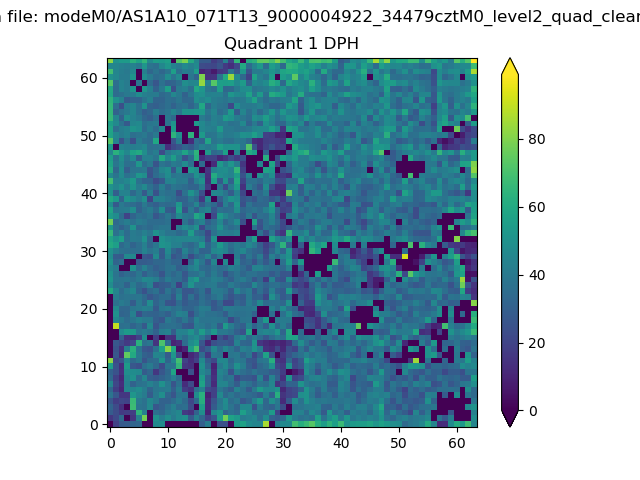 |
Quadrant B |
|---|---|---|---|
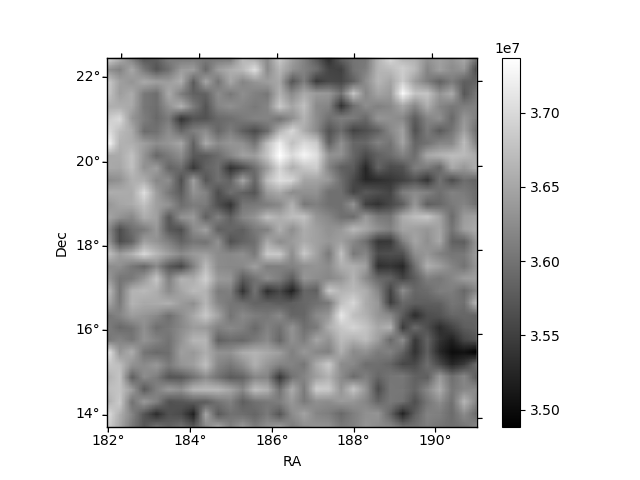
| Quadrant D | 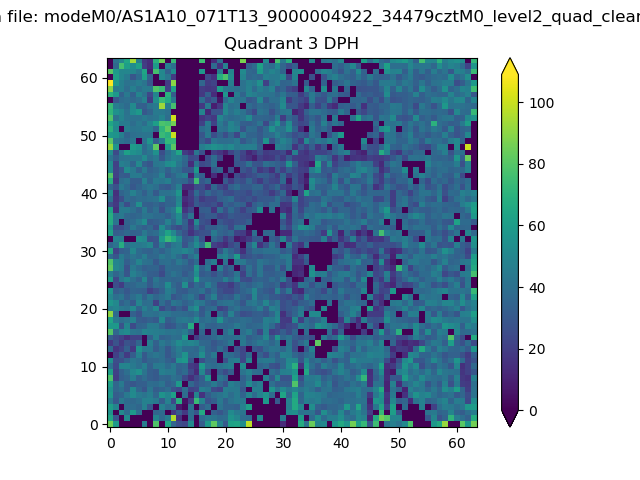 |
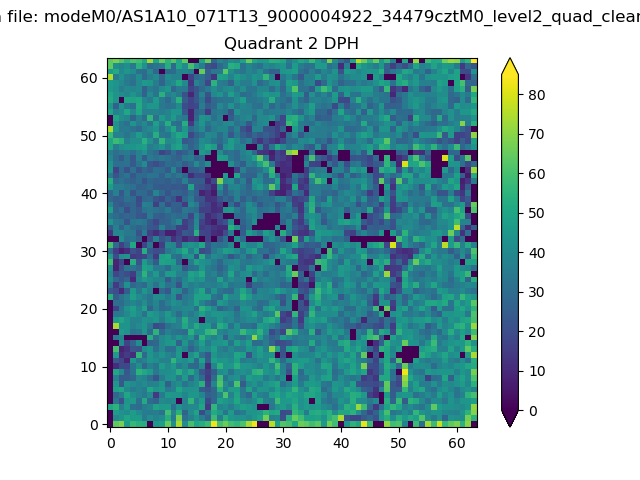 |
Quadrant C |
| Plot type | Count rate plots | Images |
|---|---|---|
| Comparison with Poisson distribution Blue bars denote a histogram of data divided into 1 sec bins. Red curve is a Poisson curve with rate = median count rate of data. |
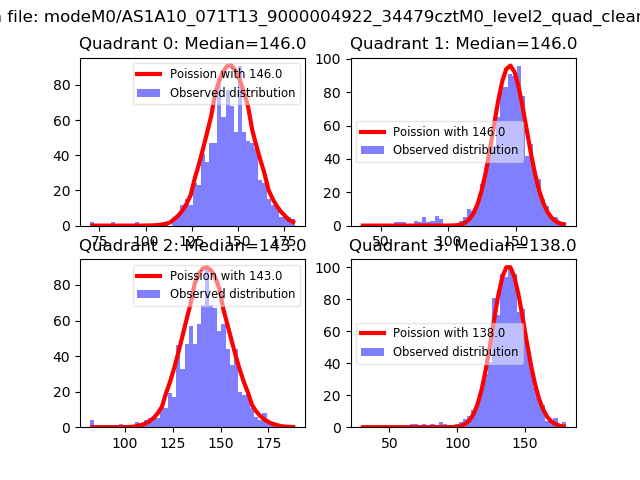 |
 |
| Quadrant-wise count rates Data is divided into 100 sec bins |
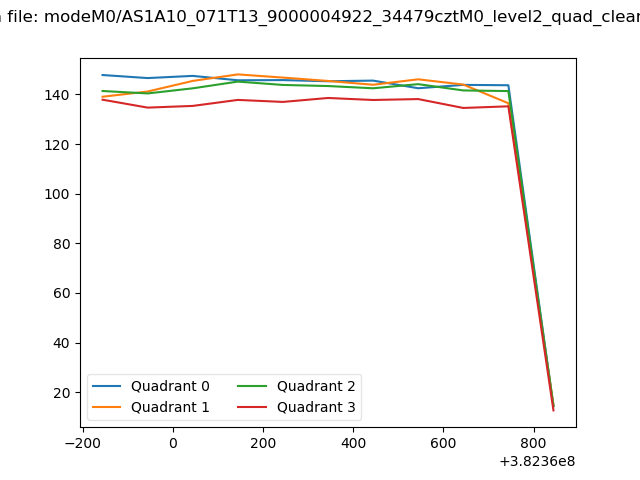 |
|
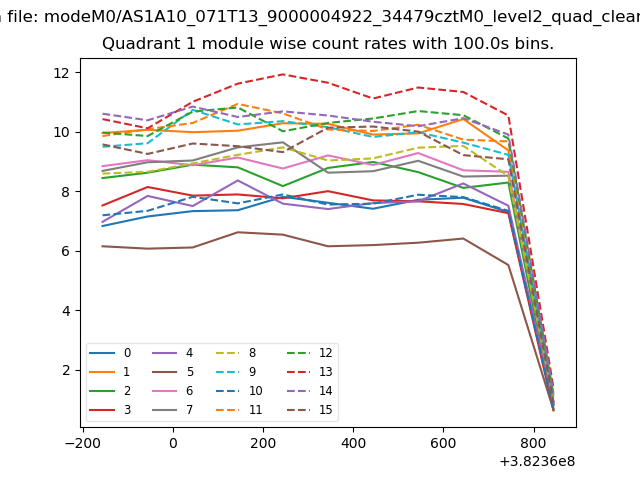
| Module-wise count rates for Quadrant A Data is divided into 100 sec bins |
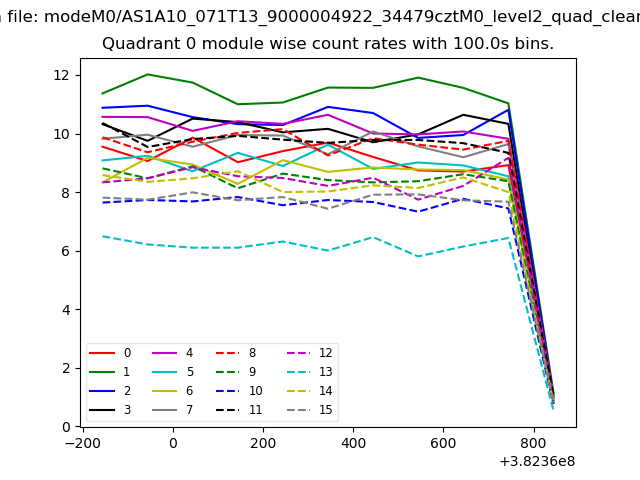 |
 |
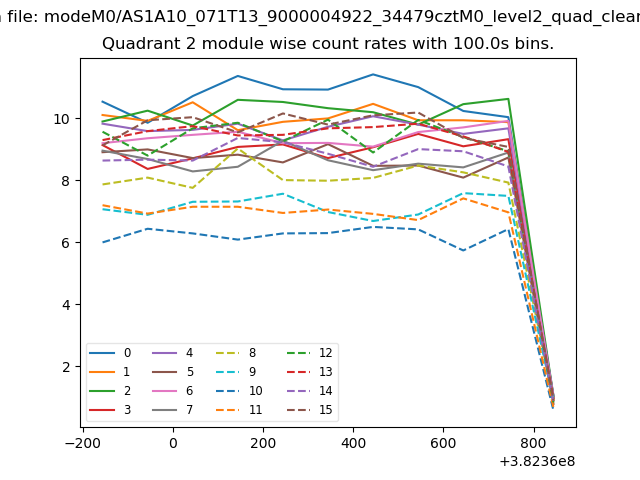
| Module-wise count rates for Quadrant B Data is divided into 100 sec bins |
 |
 |
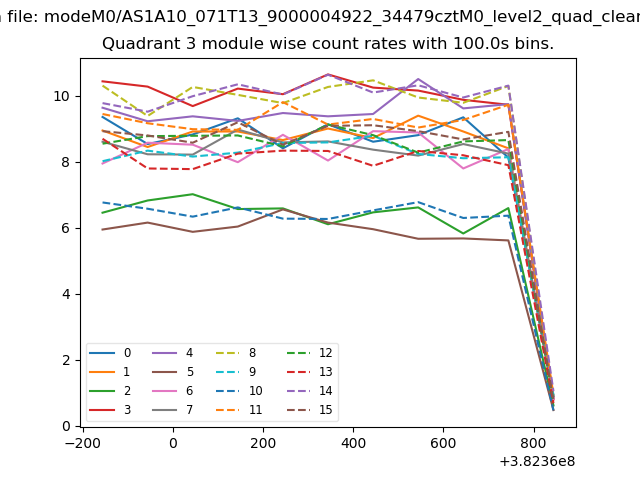
| Module-wise count rates for Quadrant C Data is divided into 100 sec bins |
 |
 |
| Module-wise count rates for Quadrant D Data is divided into 100 sec bins |
 |
 |
| Parameter | Plot |
|---|---|
| CZT HV Monitor | 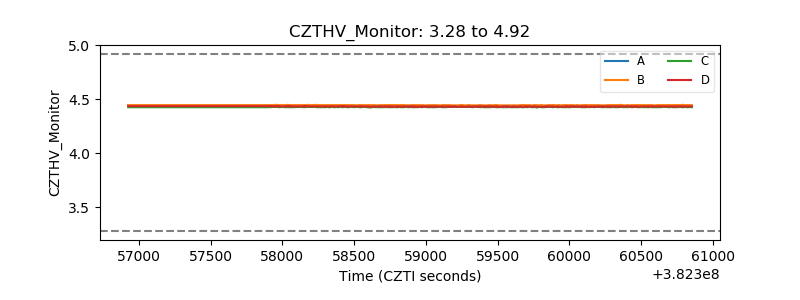 |
| D_VDD | 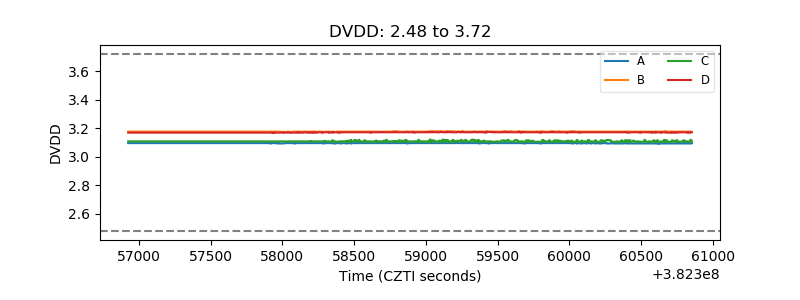 |
| Temperature 1 | 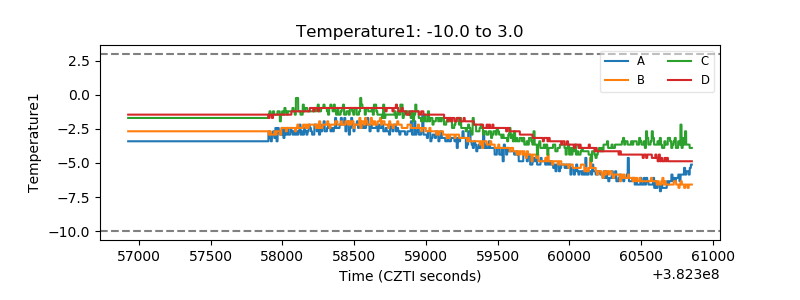 |
| Veto HV Monitor | 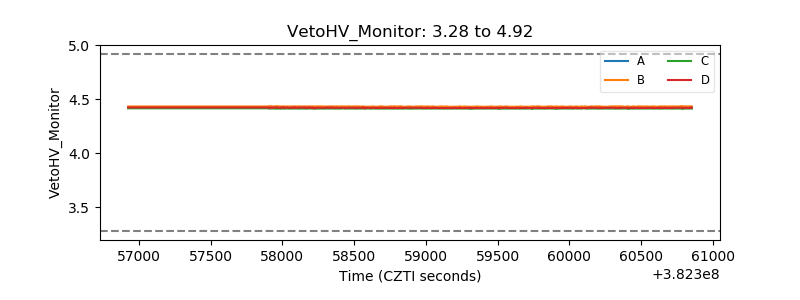 |
| Veto LLD | 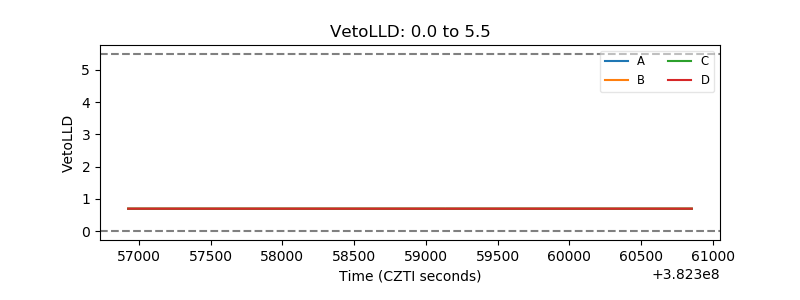 |
| Alpha Counter | 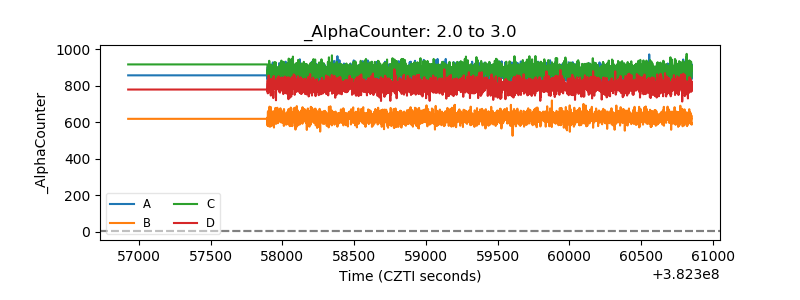 |
| _CPM_Rate | 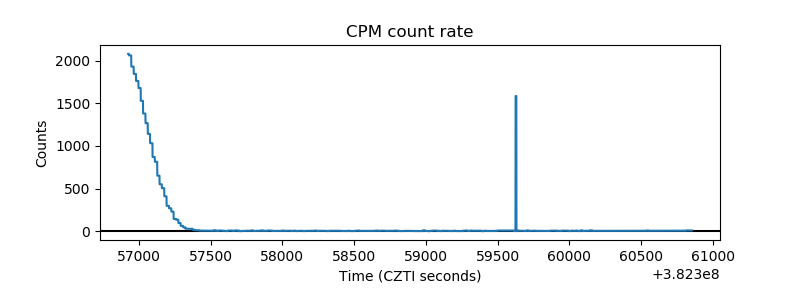 |
| CZT Counter | 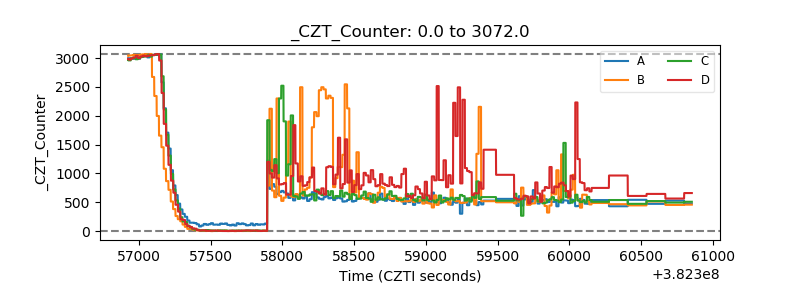 |
| +2.5 Volts monitor | 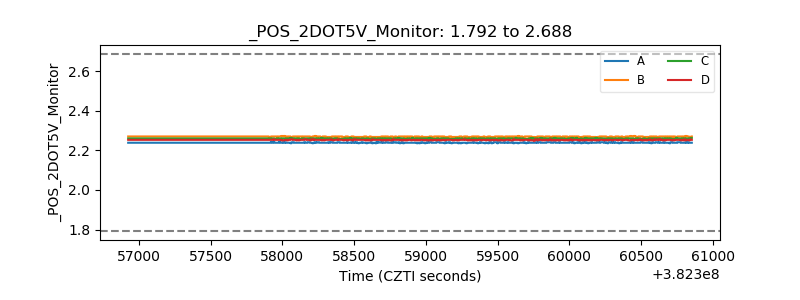 |
| +5 Volts monitor | 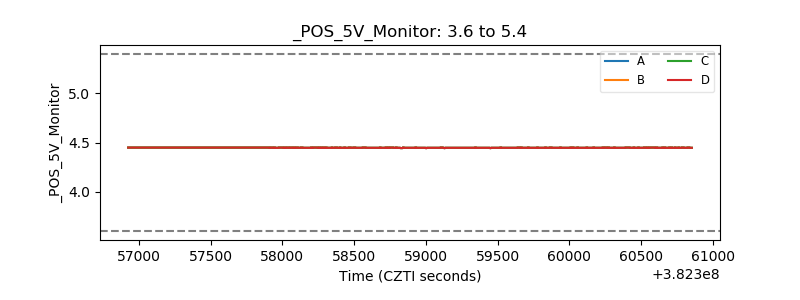 |
| _ROLL_ROT | 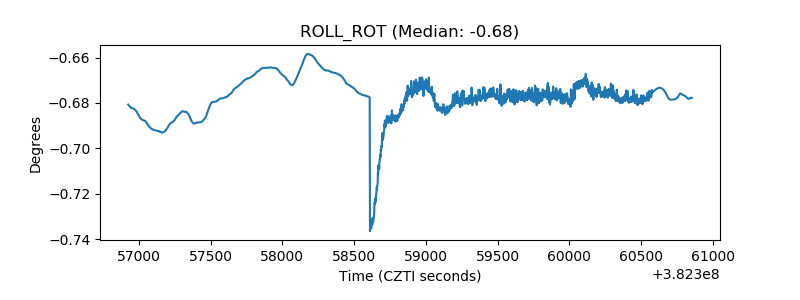 |
| _Roll_DEC | 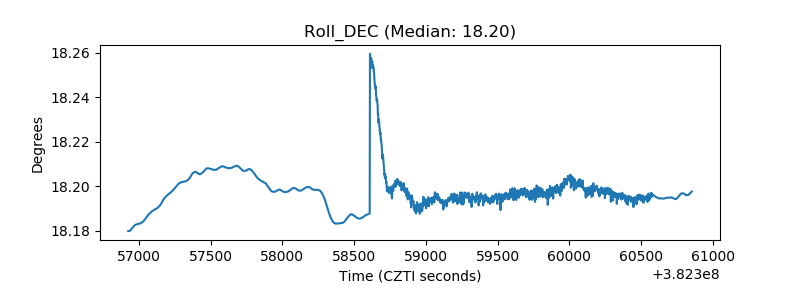 |
| _Roll_RA | 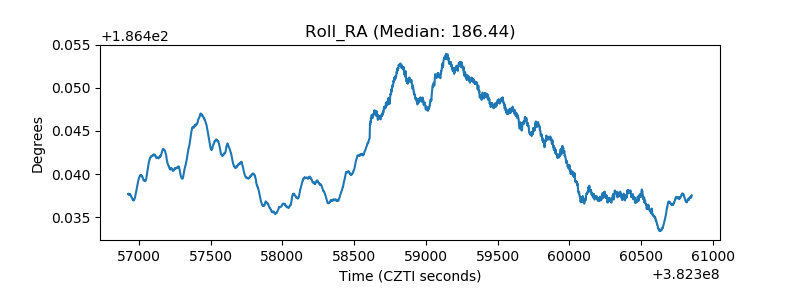 |
| Veto Counter | 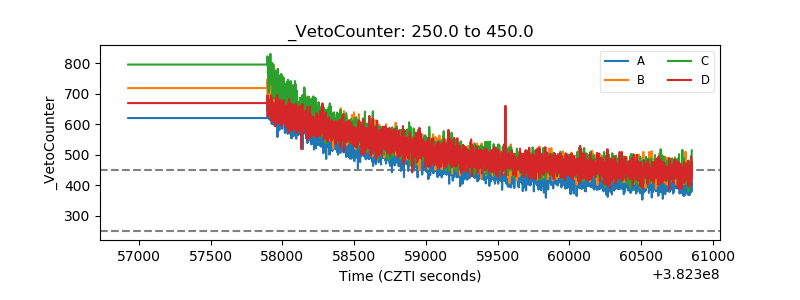 |