| Param | Original file | Final file |
|---|---|---|
| Filename | modeM0/AS1A10_071T13_9000004922_34478cztM0_level2.evt | modeM0/AS1A10_071T13_9000004922_34478cztM0_level2_quad_clean.evt |
| Size (bytes) | 527,212,800 | 50,221,440 |
| Size | 502.8 MB | 47.9 MB |
| Events in quadrant A | 2,854,760 | 293,313 |
| Events in quadrant B | 4,080,504 | 293,997 |
| Events in quadrant C | 3,546,102 | 285,650 |
| Events in quadrant D | 5,115,277 | 264,745 |
| Mode M9 | |||
|---|---|---|---|
| Quadrant | BADHDUFLAG | Total packets | Discarded packets |
| A | 0 | 28 | 0 |
| B | 0 | 28 | 0 |
| C | 0 | 28 | 0 |
| D | 0 | 29 | 0 |
| Mode SS | |||
|---|---|---|---|
| Quadrant | BADHDUFLAG | Total packets | Discarded packets |
| A | 0 | 110 | 0 |
| B | 0 | 110 | 0 |
| C | 0 | 110 | 0 |
| D | 0 | 110 | 0 |
| Mode M0 | |||
|---|---|---|---|
| Quadrant | BADHDUFLAG | Total packets | Discarded packets |
| A | 0 | 11734 | 3 |
| B | 0 | 15535 | 2 |
| C | 0 | 13774 | 2 |
| D | 0 | 19086 | 2 |
| Quadrant | Total seconds | Saturated seconds | Saturation percentage |
|---|---|---|---|
| A | 5468 | 14 | 0.256035% |
| B | 5468 | 467 | 8.540600% |
| C | 5468 | 158 | 2.889539% |
| D | 5468 | 309 | 5.651061% |
Noise dominated data is calculated using 1-second bins in cleaned event files. If a bin has >2000 counts, and if more than 50% of those come from <1% of pixels, then it is considered to be noise-dominated and hence unusable.
| Quadrant | # 1 sec bins | Bins with >0 counts | Bins with >2000 counts | High rate bins dominated by noise | Noise dominated (total time) | Noise dominated (detector-on time) | Marked lightcurve |
|---|---|---|---|---|---|---|---|
| A | 7381 | 5469 | 4 | 4 | 0.05% | 0.07% | 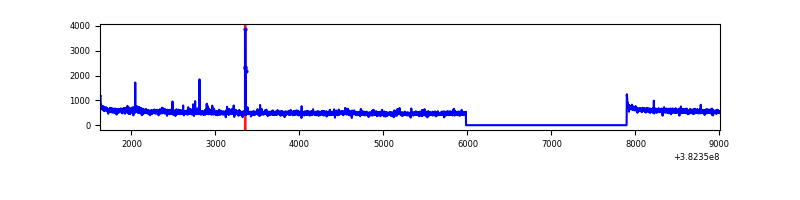 |
| B | 7381 | 5469 | 350 | 350 | 4.74% | 6.40% | 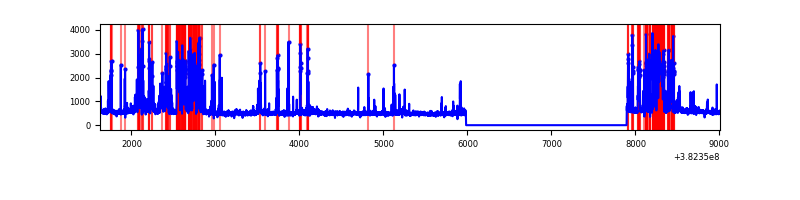 |
| C | 7381 | 5469 | 122 | 122 | 1.65% | 2.23% | 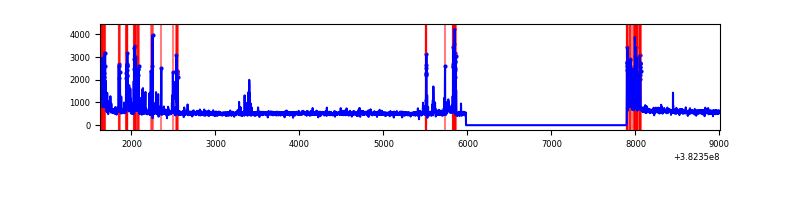 |
| D | 7381 | 5469 | 283 | 283 | 3.83% | 5.17% | 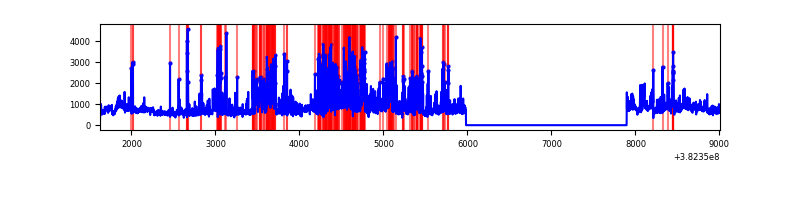 |
Top three noisy pixels from each quadrant. If the there are fewer than three noisy pixels in the level2.evt file, extra rows are filled as -1
| Pixel properties | Quadrant properties | ||||||
|---|---|---|---|---|---|---|---|
| Quadrant | DetID | PixID | Counts | Sigma | Mean | Median | Sigma |
| A | 10 | 83 | 38849 | 268.07 | 713 | 700 | 142.3 |
| A | 9 | 143 | 29846 | 204.8 | 713 | 700 | 142.3 |
| A | 10 | 255 | 12524 | 83.09 | 713 | 700 | 142.3 |
| B | 5 | 172 | 1068060 | 8271.58 | 674 | 659 | 129.0 |
| B | 0 | 189 | 127609 | 983.77 | 674 | 659 | 129.0 |
| B | 4 | 232 | 85351 | 656.3 | 674 | 659 | 129.0 |
| C | 15 | 208 | 360431 | 2298.82 | 681 | 686 | 156.5 |
| C | 15 | 214 | 232320 | 1480.17 | 681 | 686 | 156.5 |
| C | 4 | 254 | 171415 | 1090.98 | 681 | 686 | 156.5 |
| D | 12 | 79 | 943795 | 5608.09 | 682 | 665 | 168.2 |
| D | 8 | 195 | 673794 | 4002.6 | 682 | 665 | 168.2 |
| D | 14 | 52 | 222611 | 1319.75 | 682 | 665 | 168.2 |
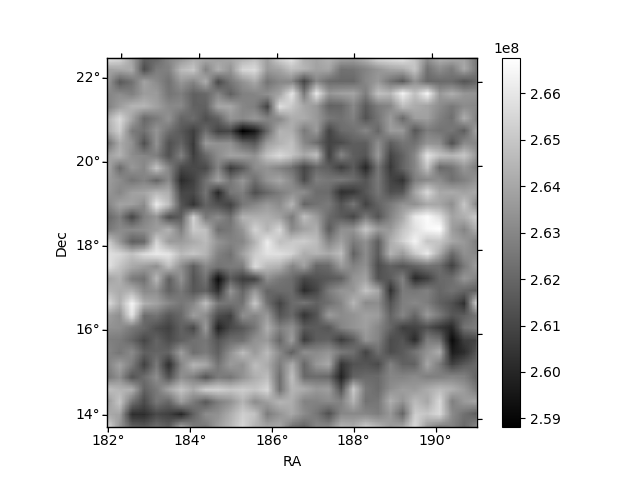
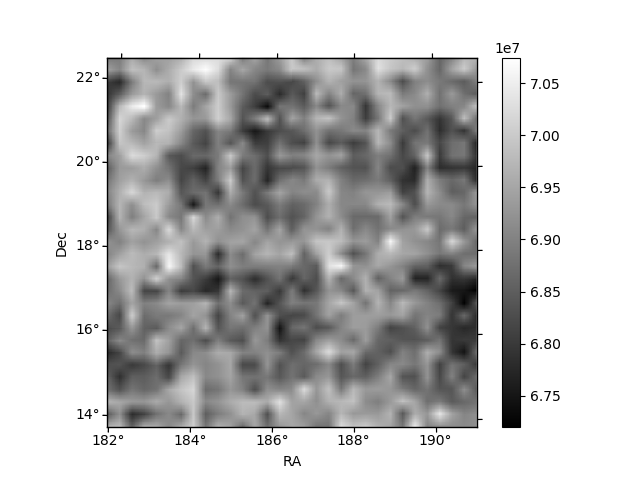
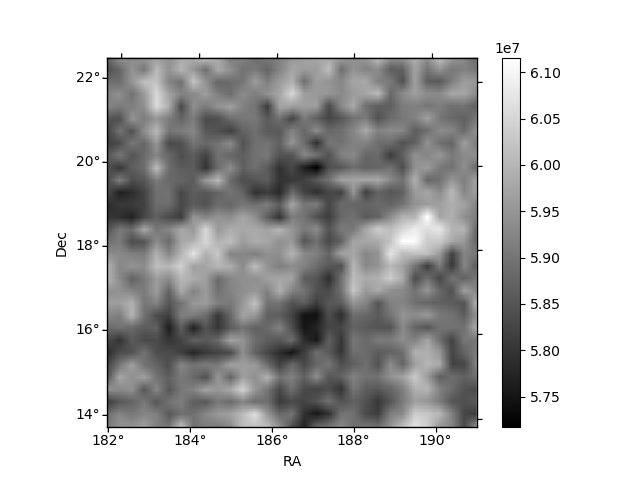
Histogram calculated using DETX and DETY for each event in the final _common_clean file
| Quadrant A | 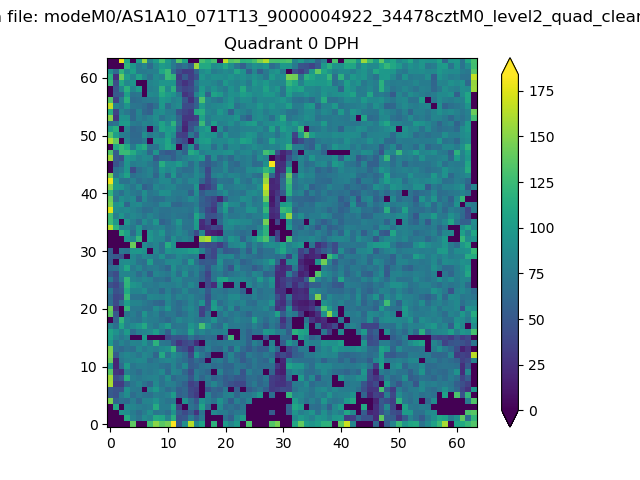 |
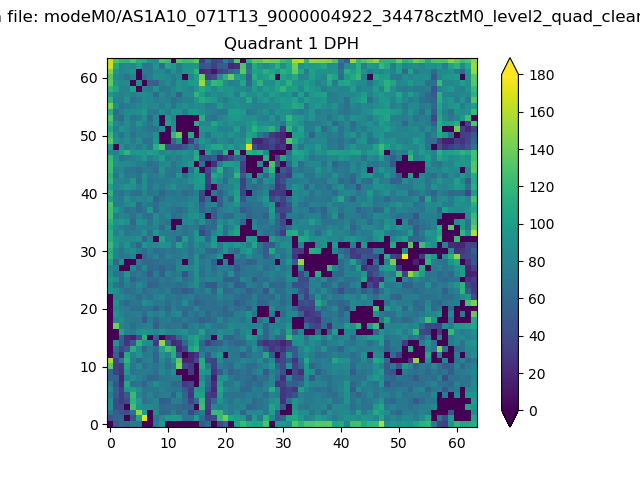 |
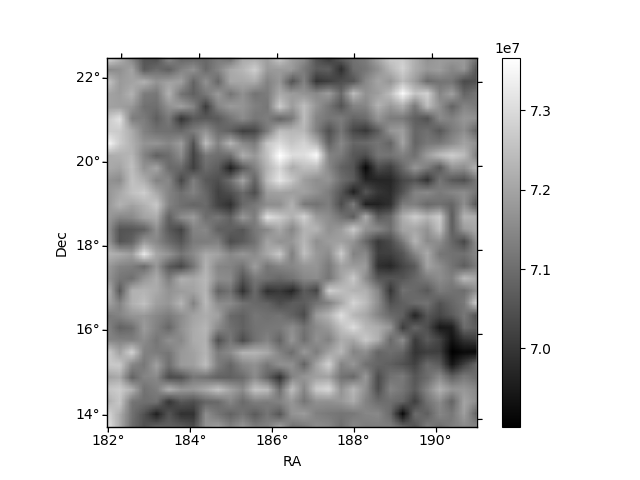
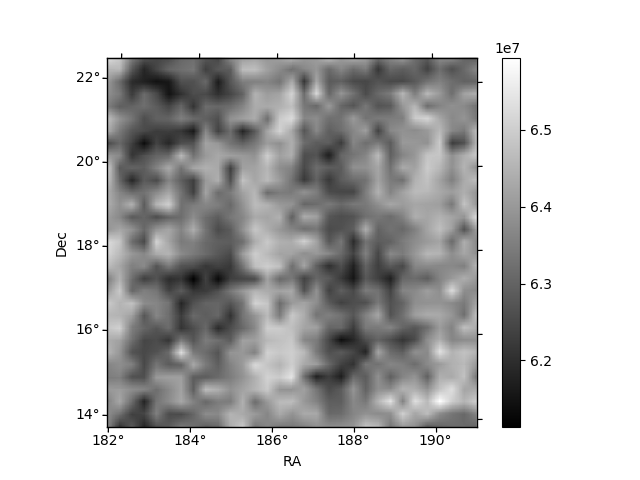
Quadrant B |
|---|---|---|---|
| Quadrant D | 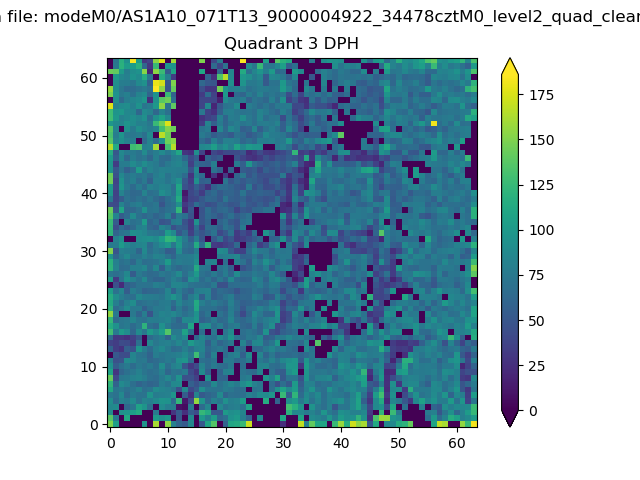 |
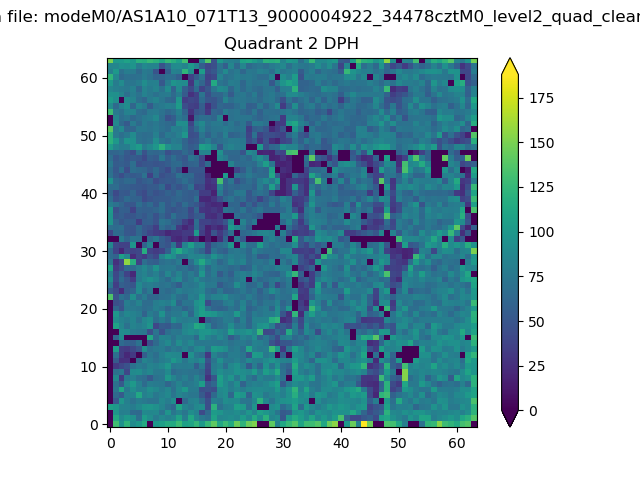 |
Quadrant C |
| Plot type | Count rate plots | Images |
|---|---|---|
| Comparison with Poisson distribution Blue bars denote a histogram of data divided into 1 sec bins. Red curve is a Poisson curve with rate = median count rate of data. |
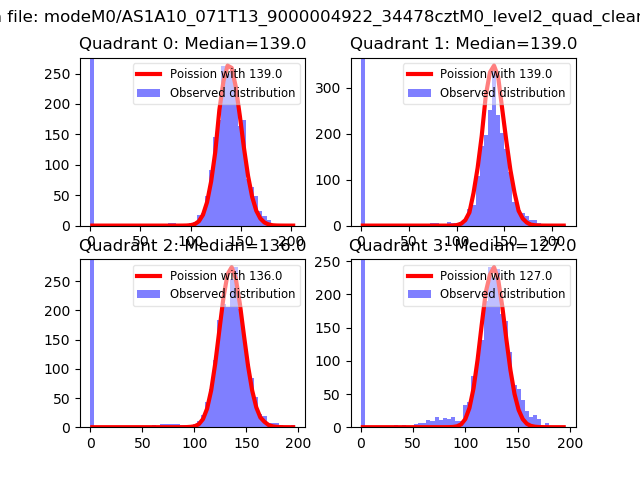 |
 |
| Quadrant-wise count rates Data is divided into 100 sec bins |
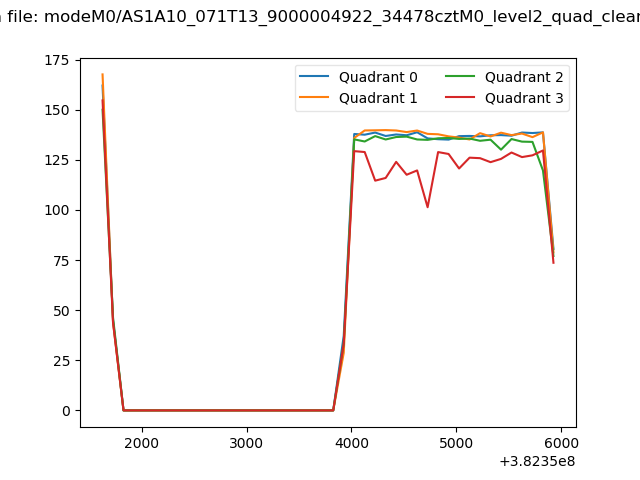 |
|
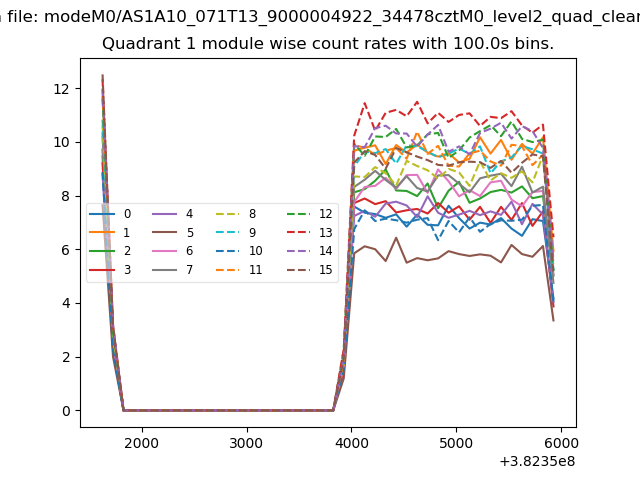
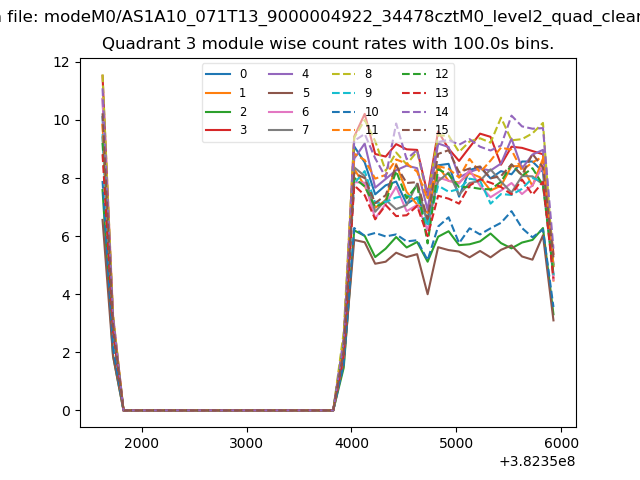
| Module-wise count rates for Quadrant A Data is divided into 100 sec bins |
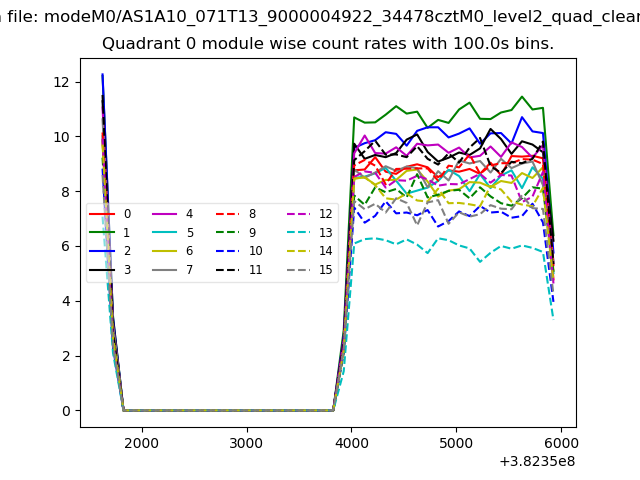 |
 |
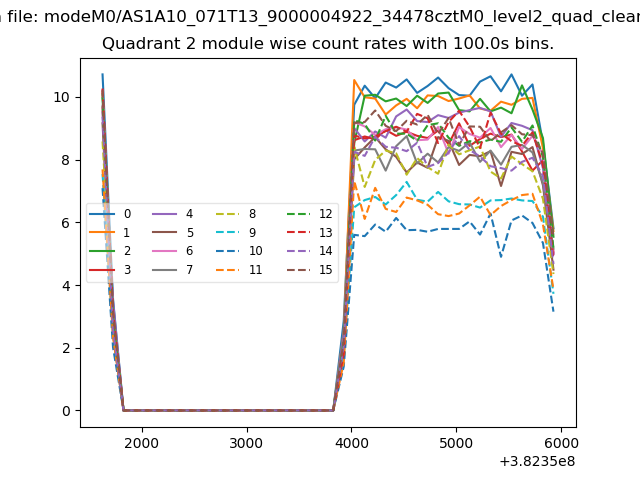
| Module-wise count rates for Quadrant B Data is divided into 100 sec bins |
 |
 |
| Module-wise count rates for Quadrant C Data is divided into 100 sec bins |
 |
 |
| Module-wise count rates for Quadrant D Data is divided into 100 sec bins |
 |
 |
| Parameter | Plot |
|---|---|
| CZT HV Monitor | 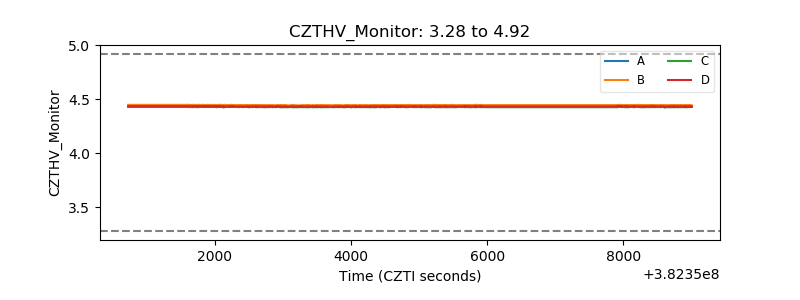 |
| D_VDD | 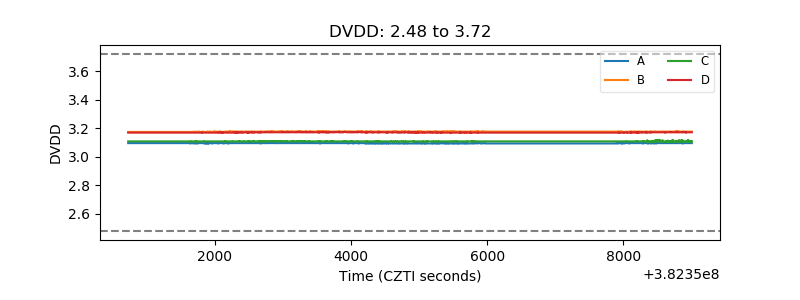 |
| Temperature 1 | 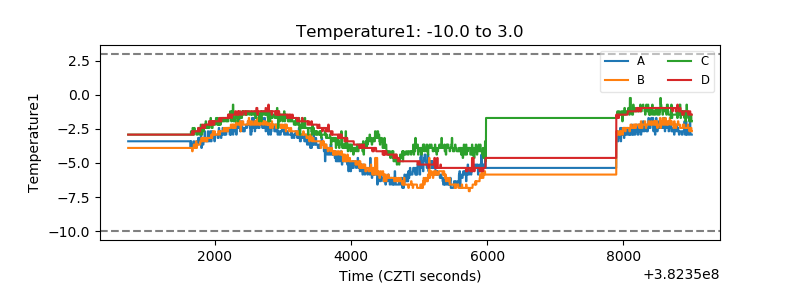 |
| Veto HV Monitor | 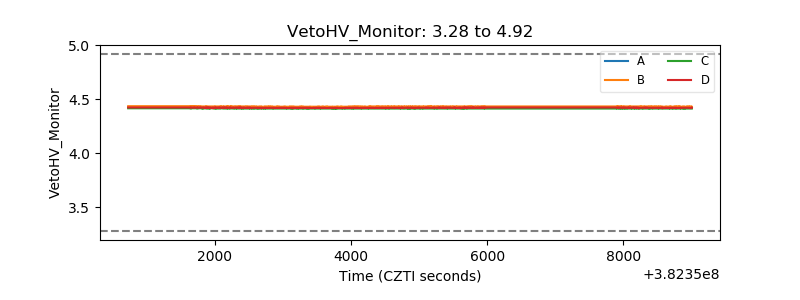 |
| Veto LLD | 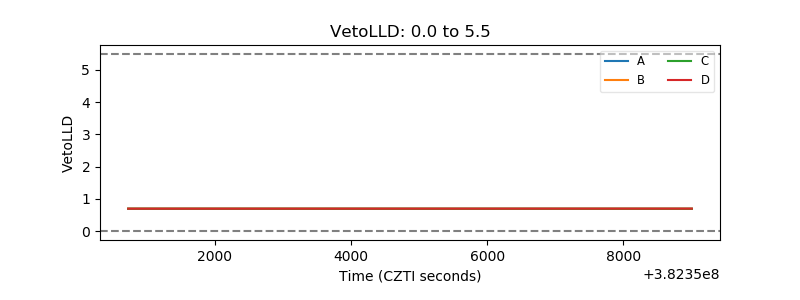 |
| Alpha Counter | 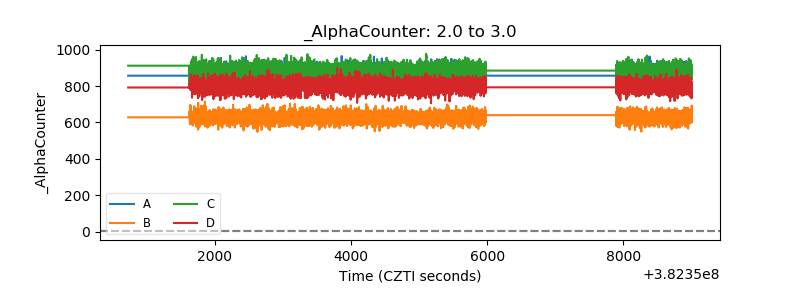 |
| _CPM_Rate | 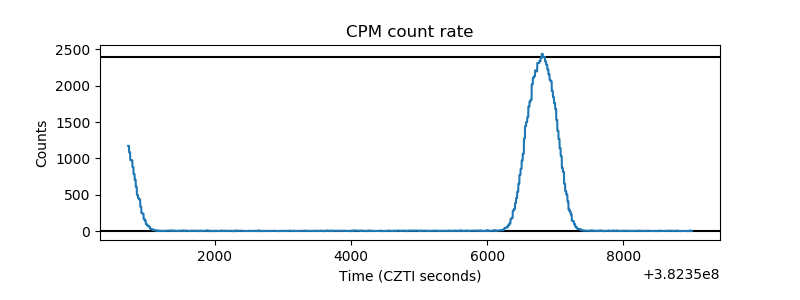 |
| CZT Counter | 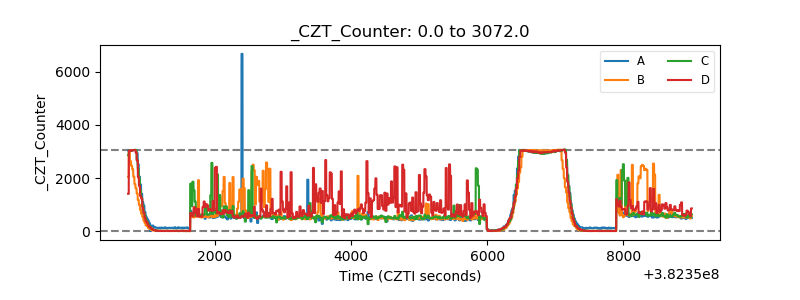 |
| +2.5 Volts monitor | 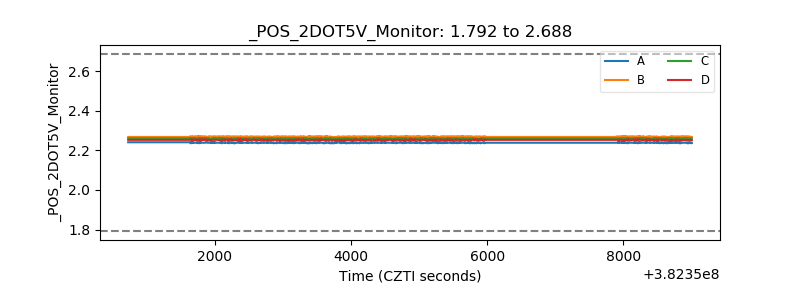 |
| +5 Volts monitor | 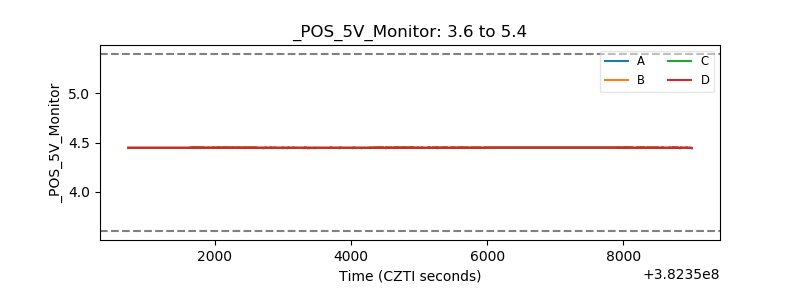 |
| _ROLL_ROT | 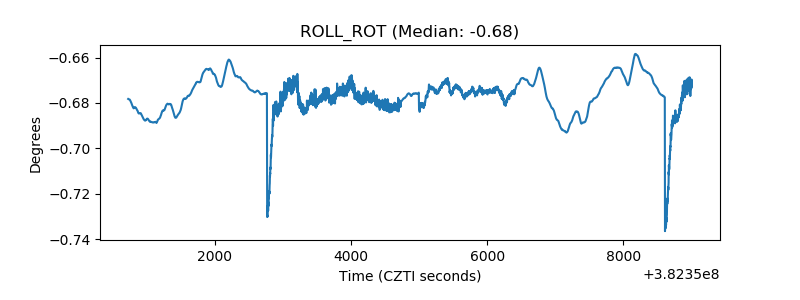 |
| _Roll_DEC | 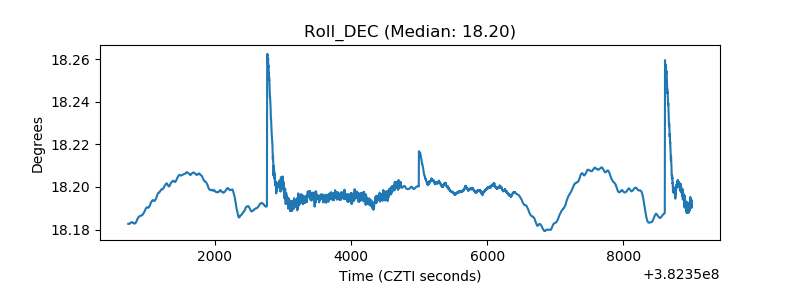 |
| _Roll_RA | 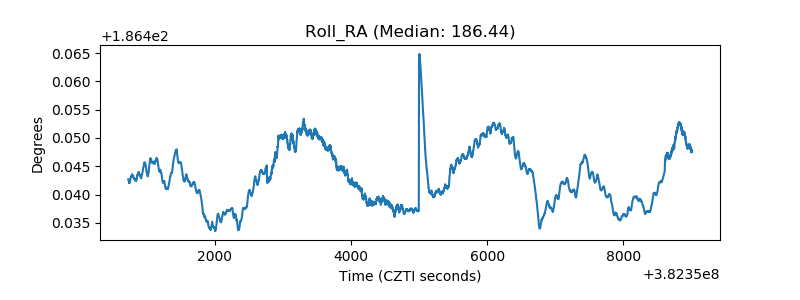 |
| Veto Counter | 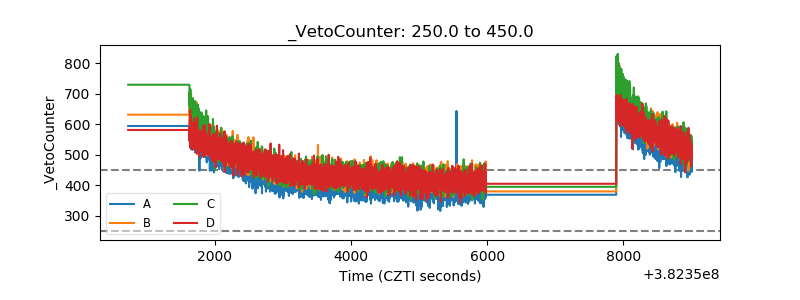 |