| Param | Original file | Final file |
|---|---|---|
| Filename | modeM0/AS1A10_071T13_9000004922_34477cztM0_level2.evt | modeM0/AS1A10_071T13_9000004922_34477cztM0_level2_quad_clean.evt |
| Size (bytes) | 516,395,520 | 54,547,200 |
| Size | 492.5 MB | 52.0 MB |
| Events in quadrant A | 3,306,511 | 321,657 |
| Events in quadrant B | 3,885,475 | 325,404 |
| Events in quadrant C | 3,460,385 | 318,517 |
| Events in quadrant D | 4,614,979 | 301,511 |
| Mode M9 | |||
|---|---|---|---|
| Quadrant | BADHDUFLAG | Total packets | Discarded packets |
| A | 0 | 26 | 0 |
| B | 0 | 26 | 0 |
| C | 0 | 26 | 0 |
| D | 0 | 27 | 0 |
| Mode SS | |||
|---|---|---|---|
| Quadrant | BADHDUFLAG | Total packets | Discarded packets |
| A | 0 | 110 | 0 |
| B | 0 | 110 | 0 |
| C | 0 | 110 | 0 |
| D | 0 | 110 | 0 |
| Mode M0 | |||
|---|---|---|---|
| Quadrant | BADHDUFLAG | Total packets | Discarded packets |
| A | 0 | 13340 | 3 |
| B | 0 | 14986 | 2 |
| C | 0 | 13588 | 2 |
| D | 0 | 17531 | 2 |
| Quadrant | Total seconds | Saturated seconds | Saturation percentage |
|---|---|---|---|
| A | 5497 | 24 | 0.436602% |
| B | 5497 | 271 | 4.929962% |
| C | 5497 | 101 | 1.837366% |
| D | 5497 | 228 | 4.147717% |
Noise dominated data is calculated using 1-second bins in cleaned event files. If a bin has >2000 counts, and if more than 50% of those come from <1% of pixels, then it is considered to be noise-dominated and hence unusable.
| Quadrant | # 1 sec bins | Bins with >0 counts | Bins with >2000 counts | High rate bins dominated by noise | Noise dominated (total time) | Noise dominated (detector-on time) | Marked lightcurve |
|---|---|---|---|---|---|---|---|
| A | 7260 | 5498 | 10 | 10 | 0.14% | 0.18% | 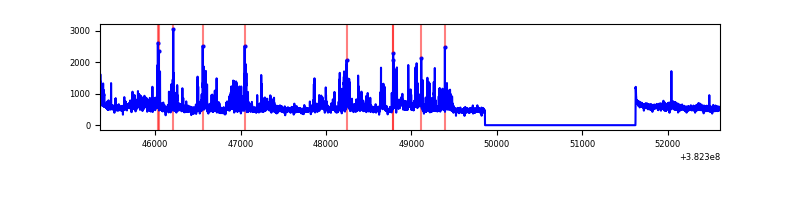 |
| B | 7259 | 5497 | 188 | 188 | 2.59% | 3.42% | 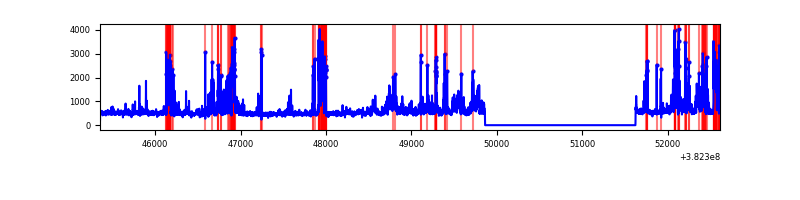 |
| C | 7260 | 5498 | 80 | 80 | 1.10% | 1.46% | 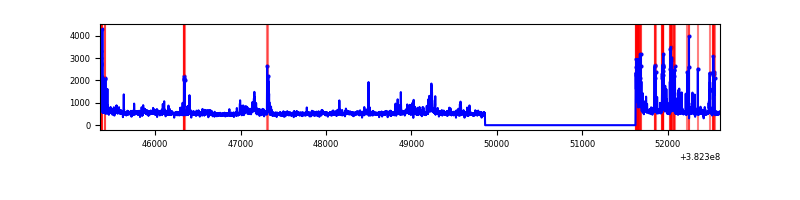 |
| D | 7260 | 5498 | 197 | 197 | 2.71% | 3.58% | 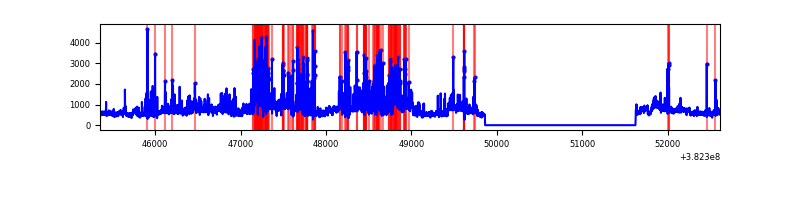 |
Top three noisy pixels from each quadrant. If the there are fewer than three noisy pixels in the level2.evt file, extra rows are filled as -1
| Pixel properties | Quadrant properties | ||||||
|---|---|---|---|---|---|---|---|
| Quadrant | DetID | PixID | Counts | Sigma | Mean | Median | Sigma |
| A | 15 | 169 | 596865 | 4357.05 | 684 | 671 | 136.8 |
| A | 10 | 83 | 37573 | 269.68 | 684 | 671 | 136.8 |
| A | 10 | 255 | 11220 | 77.09 | 684 | 671 | 136.8 |
| B | 5 | 172 | 727290 | 5694.86 | 662 | 645 | 127.6 |
| B | 5 | 31 | 289006 | 2259.94 | 662 | 645 | 127.6 |
| B | 0 | 189 | 152606 | 1190.95 | 662 | 645 | 127.6 |
| C | 15 | 208 | 306321 | 2007.09 | 655 | 660 | 152.3 |
| C | 15 | 214 | 233390 | 1528.19 | 655 | 660 | 152.3 |
| C | 4 | 254 | 171987 | 1125.0 | 655 | 660 | 152.3 |
| D | 12 | 79 | 830804 | 5102.26 | 659 | 640 | 162.7 |
| D | 8 | 195 | 814901 | 5004.52 | 659 | 640 | 162.7 |
| D | 2 | 250 | 129715 | 793.31 | 659 | 640 | 162.7 |
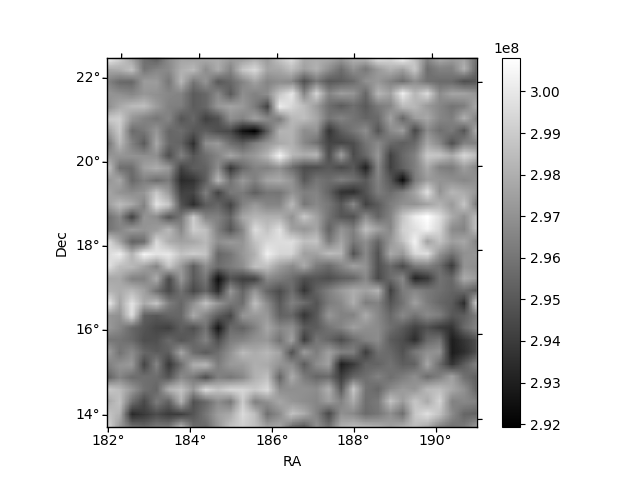
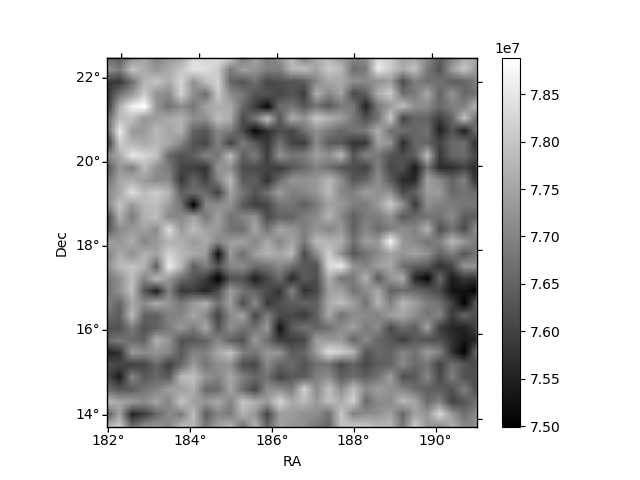
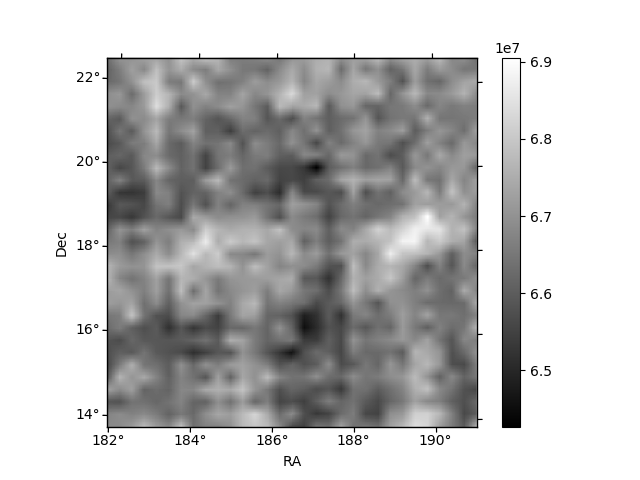
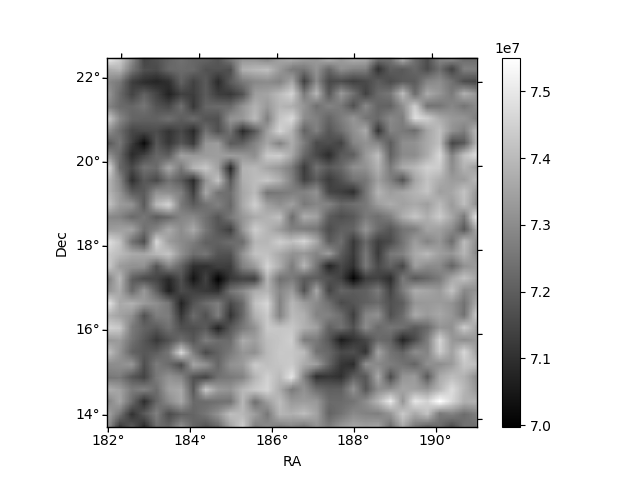
Histogram calculated using DETX and DETY for each event in the final _common_clean file
| Quadrant A | 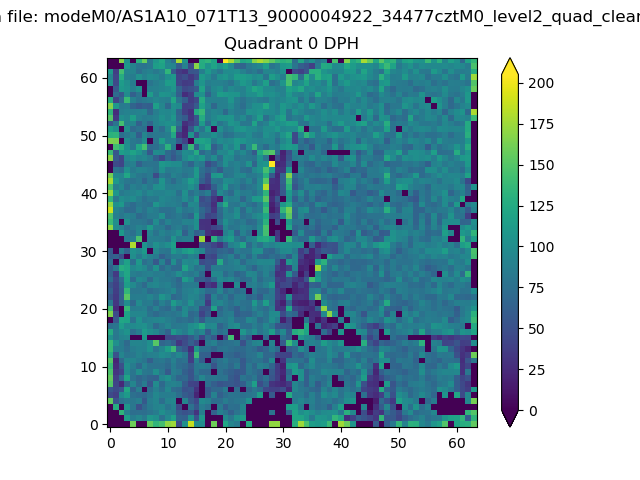 |
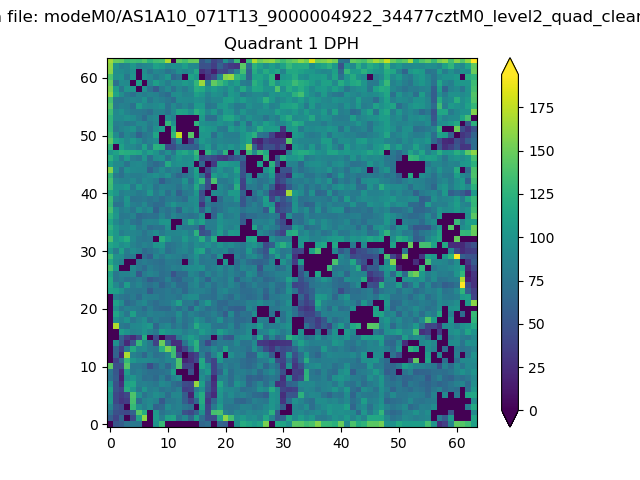 |
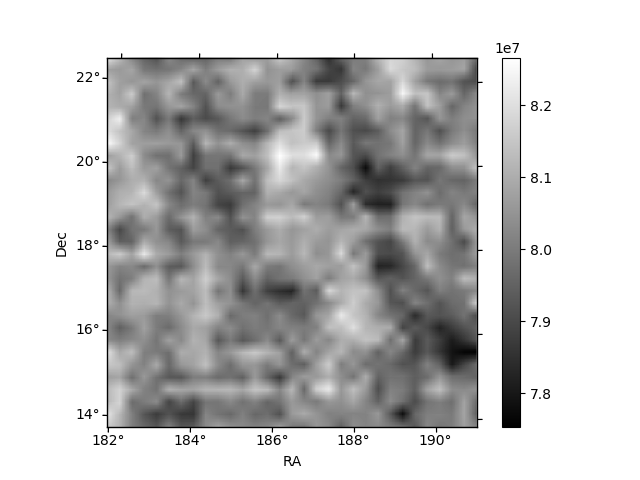
Quadrant B |
|---|---|---|---|
| Quadrant D | 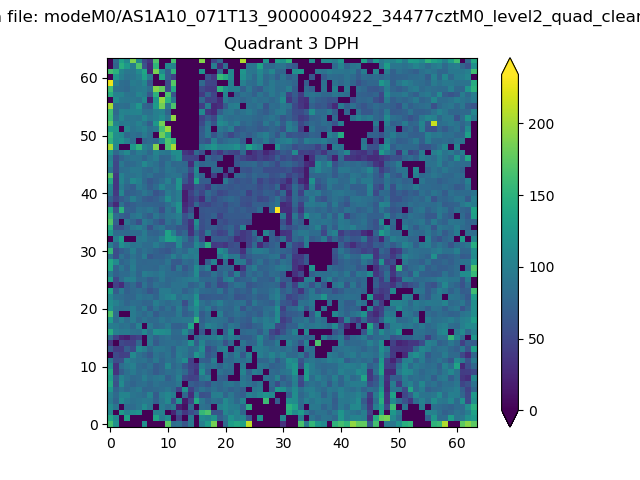 |
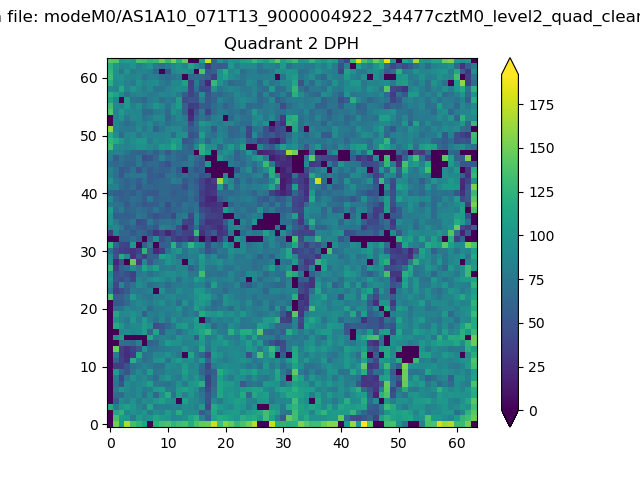 |
Quadrant C |
| Plot type | Count rate plots | Images |
|---|---|---|
| Comparison with Poisson distribution Blue bars denote a histogram of data divided into 1 sec bins. Red curve is a Poisson curve with rate = median count rate of data. |
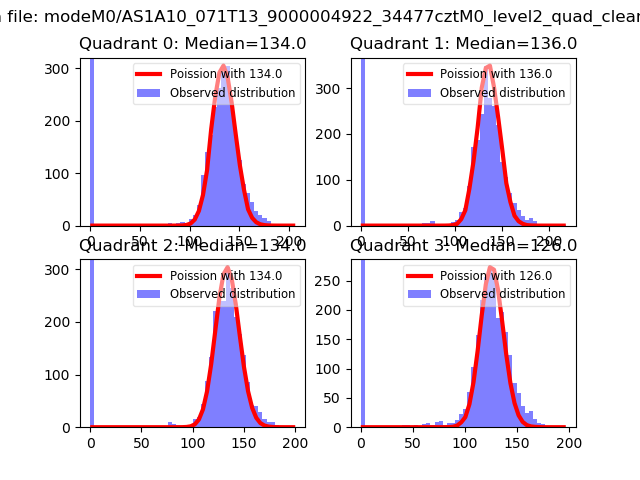 |
 |
| Quadrant-wise count rates Data is divided into 100 sec bins |
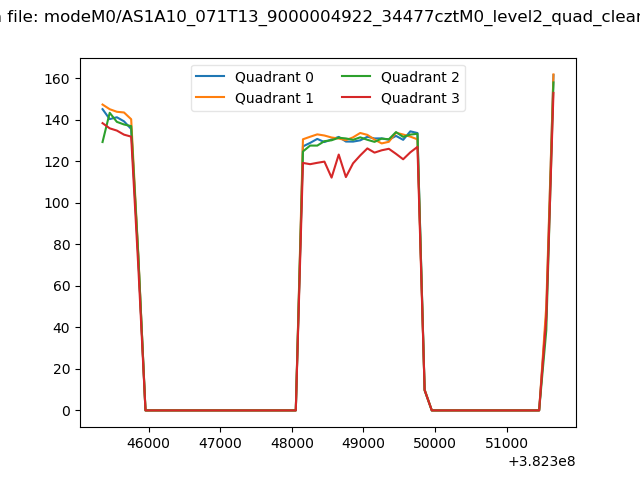 |
|
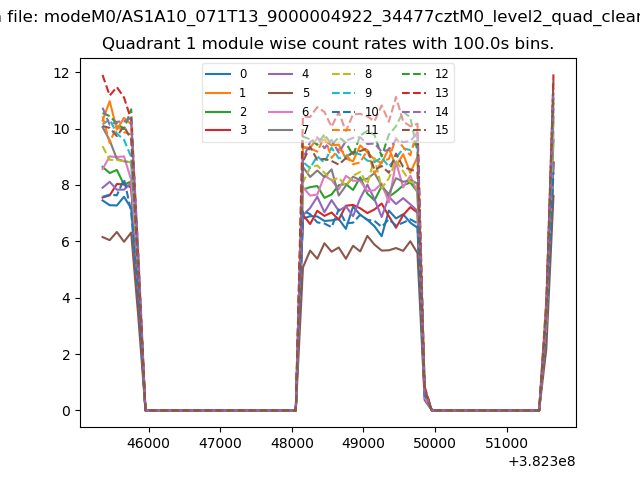
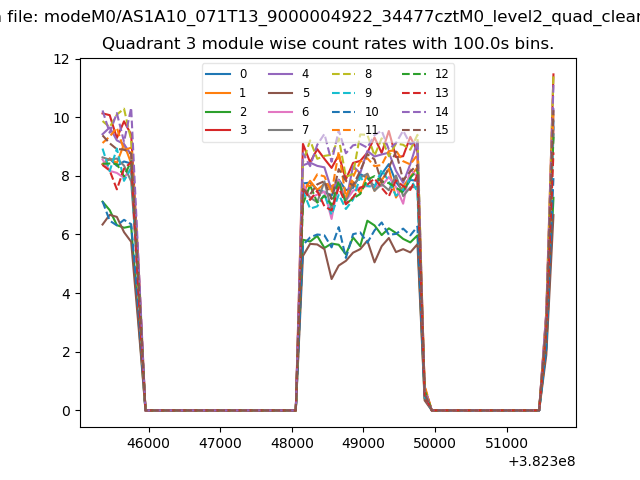
| Module-wise count rates for Quadrant A Data is divided into 100 sec bins |
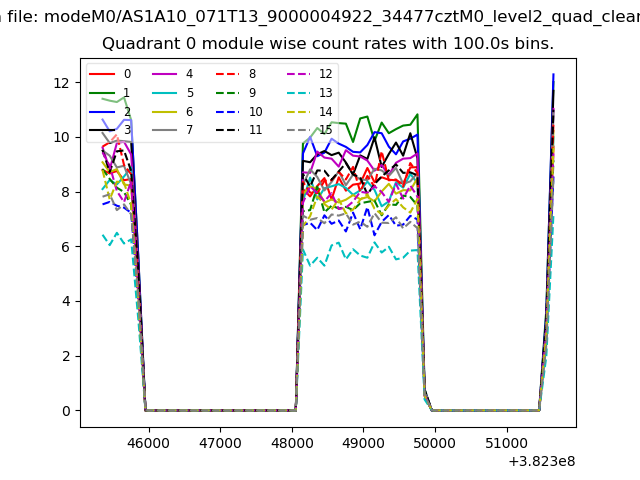 |
 |
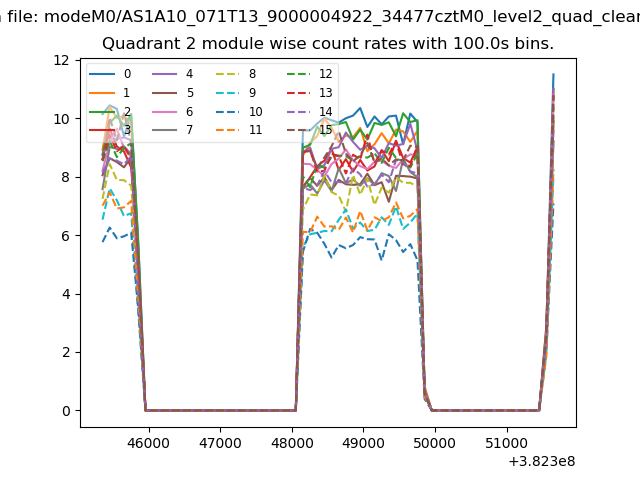
| Module-wise count rates for Quadrant B Data is divided into 100 sec bins |
 |
 |
| Module-wise count rates for Quadrant C Data is divided into 100 sec bins |
 |
 |
| Module-wise count rates for Quadrant D Data is divided into 100 sec bins |
 |
 |
| Parameter | Plot |
|---|---|
| CZT HV Monitor | 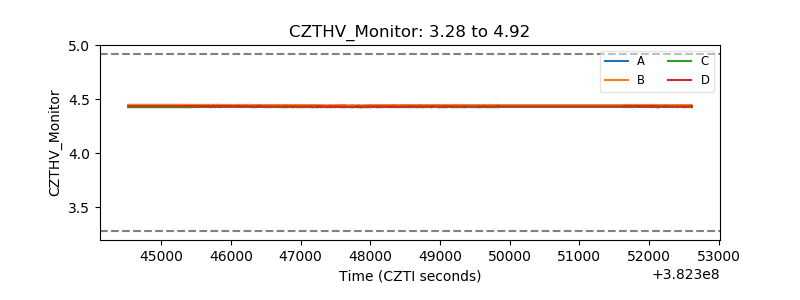 |
| D_VDD | 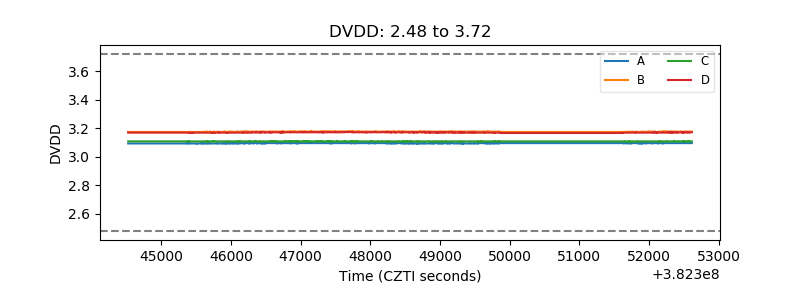 |
| Temperature 1 | 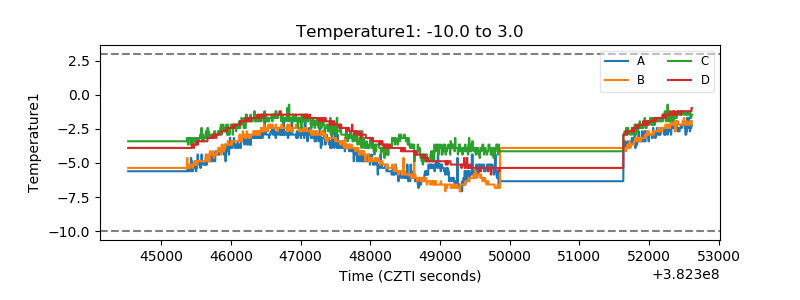 |
| Veto HV Monitor | 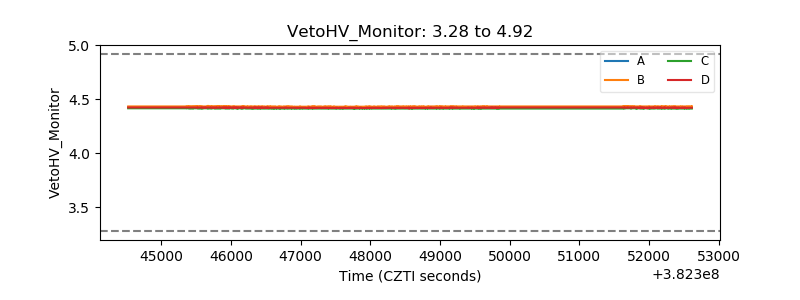 |
| Veto LLD | 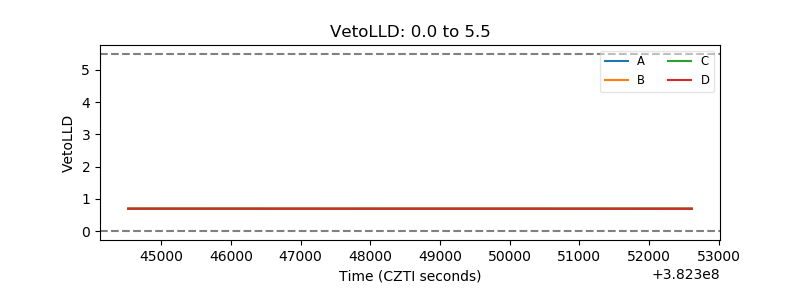 |
| Alpha Counter | 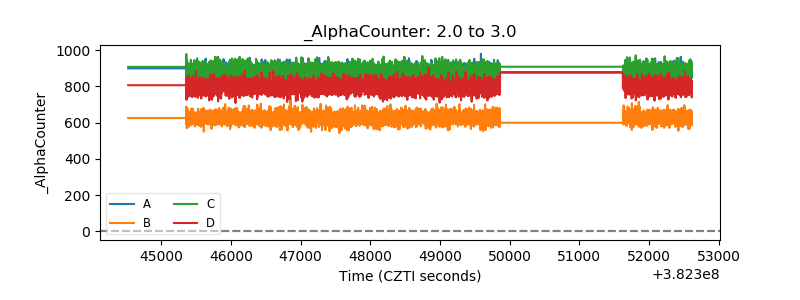 |
| _CPM_Rate | 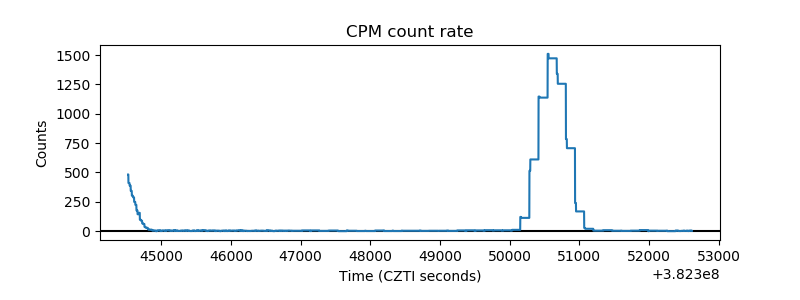 |
| CZT Counter | 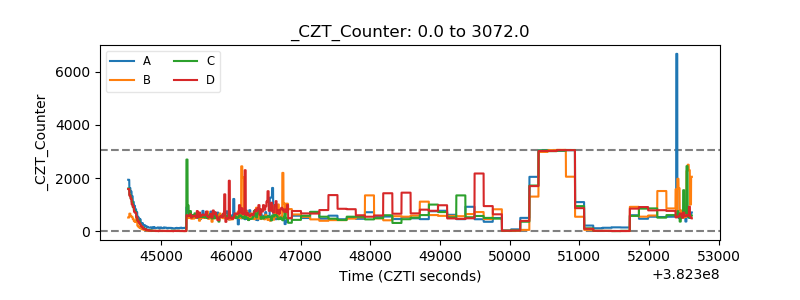 |
| +2.5 Volts monitor | 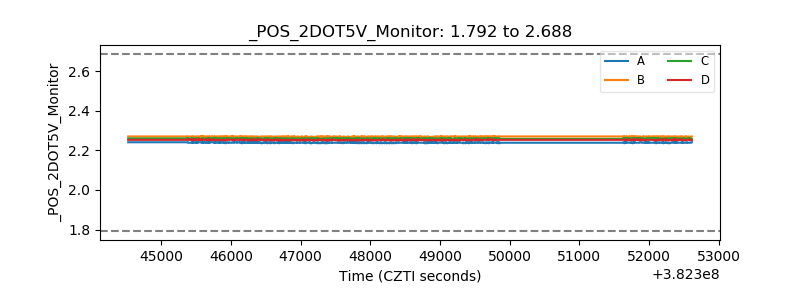 |
| +5 Volts monitor | 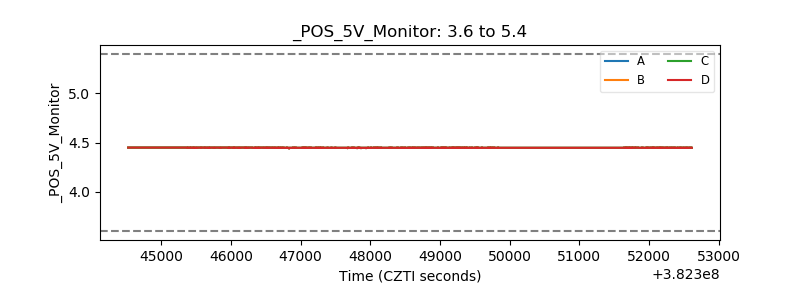 |
| _ROLL_ROT | 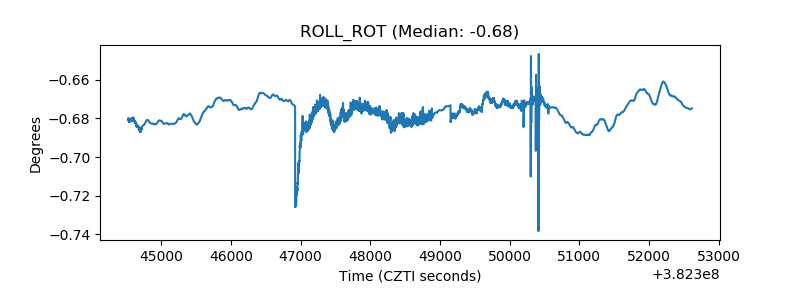 |
| _Roll_DEC | 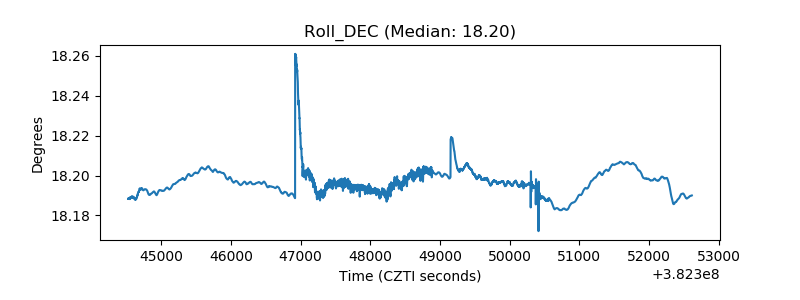 |
| _Roll_RA | 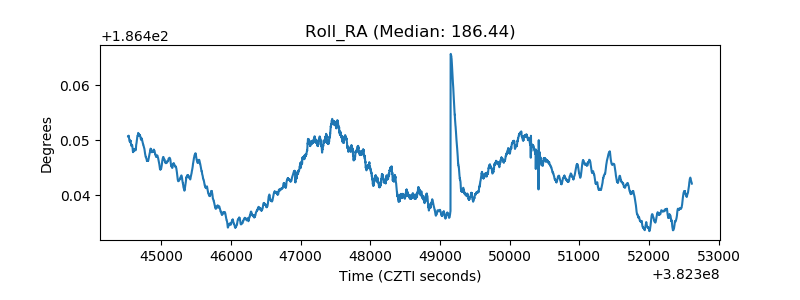 |
| Veto Counter | 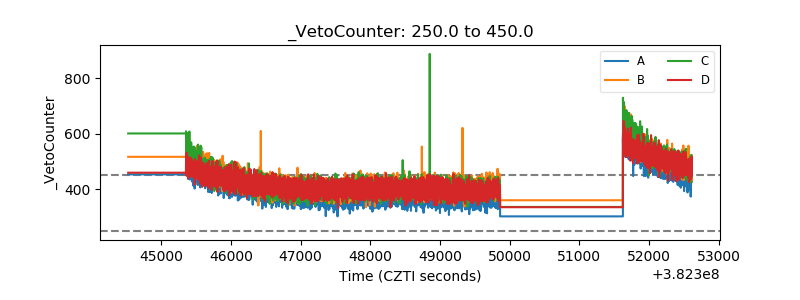 |