| Param | Original file | Final file |
|---|---|---|
| Filename | modeM0/AS1A10_071T13_9000004922_34471cztM0_level2.evt | modeM0/AS1A10_071T13_9000004922_34471cztM0_level2_quad_clean.evt |
| Size (bytes) | 368,801,280 | 58,708,800 |
| Size | 351.7 MB | 56.0 MB |
| Events in quadrant A | 2,152,445 | 379,799 |
| Events in quadrant B | 2,153,145 | 389,905 |
| Events in quadrant C | 2,178,028 | 392,880 |
| Events in quadrant D | 4,407,986 | 327,770 |
| Mode M9 | |||
|---|---|---|---|
| Quadrant | BADHDUFLAG | Total packets | Discarded packets |
| A | 0 | 15 | 1 |
| B | 0 | 15 | 2 |
| C | 0 | 15 | 0 |
| D | 0 | 16 | 2 |
| Mode SS | |||
|---|---|---|---|
| Quadrant | BADHDUFLAG | Total packets | Discarded packets |
| A | 0 | 122 | 36 |
| B | 0 | 124 | 44 |
| C | 0 | 123 | 35 |
| D | 0 | 121 | 39 |
| Mode M0 | |||
|---|---|---|---|
| Quadrant | BADHDUFLAG | Total packets | Discarded packets |
| A | 0 | 13306 | 3966 |
| B | 0 | 13824 | 4539 |
| C | 0 | 13073 | 4016 |
| D | 0 | 26350 | 10675 |
| Quadrant | Total seconds | Saturated seconds | Saturation percentage |
|---|---|---|---|
| A | 4166 | 69 | 1.656265% |
| B | 4171 | 51 | 1.222728% |
| C | 4240 | 5 | 0.117925% |
| D | 3670 | 334 | 9.100817% |
Noise dominated data is calculated using 1-second bins in cleaned event files. If a bin has >2000 counts, and if more than 50% of those come from <1% of pixels, then it is considered to be noise-dominated and hence unusable.
| Quadrant | # 1 sec bins | Bins with >0 counts | Bins with >2000 counts | High rate bins dominated by noise | Noise dominated (total time) | Noise dominated (detector-on time) | Marked lightcurve |
|---|---|---|---|---|---|---|---|
| A | 7338 | 4770 | 59 | 59 | 0.80% | 1.24% |  |
| B | 7337 | 4756 | 20 | 20 | 0.27% | 0.42% | 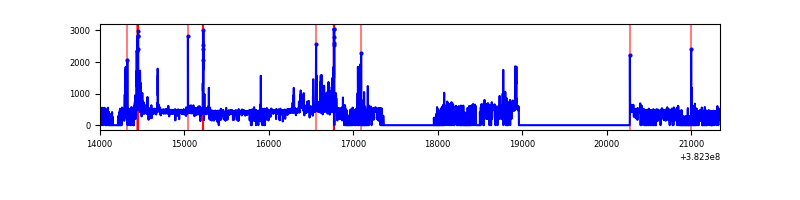 |
| C | 7338 | 4812 | 1 | 1 | 0.01% | 0.02% | 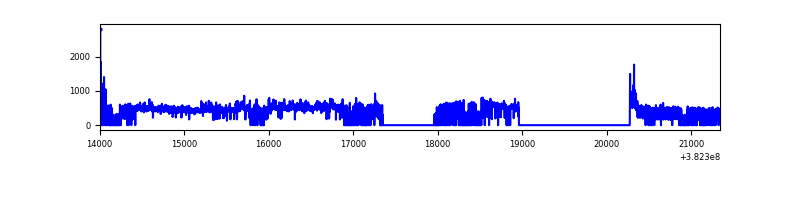 |
| D | 7338 | 4268 | 321 | 321 | 4.37% | 7.52% | 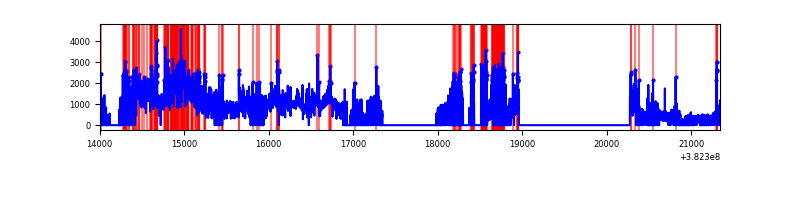 |
Top three noisy pixels from each quadrant. If the there are fewer than three noisy pixels in the level2.evt file, extra rows are filled as -1
| Pixel properties | Quadrant properties | ||||||
|---|---|---|---|---|---|---|---|
| Quadrant | DetID | PixID | Counts | Sigma | Mean | Median | Sigma |
| A | 15 | 169 | 252892 | 2639.21 | 469 | 461 | 95.6 |
| A | 9 | 143 | 48476 | 502.0 | 469 | 461 | 95.6 |
| A | 10 | 83 | 22976 | 235.4 | 469 | 461 | 95.6 |
| B | 5 | 172 | 165672 | 1796.06 | 470 | 458 | 92.0 |
| B | 5 | 255 | 72991 | 788.51 | 470 | 458 | 92.0 |
| B | 0 | 229 | 44305 | 476.67 | 470 | 458 | 92.0 |
| C | 15 | 214 | 178701 | 1610.14 | 467 | 472 | 110.7 |
| C | 14 | 67 | 130931 | 1178.58 | 467 | 472 | 110.7 |
| C | 0 | 10 | 34453 | 306.99 | 467 | 472 | 110.7 |
| D | 7 | 223 | 1288323 | 13671.43 | 382 | 372 | 94.2 |
| D | 10 | 203 | 632144 | 6706.18 | 382 | 372 | 94.2 |
| D | 8 | 195 | 414559 | 4396.54 | 382 | 372 | 94.2 |
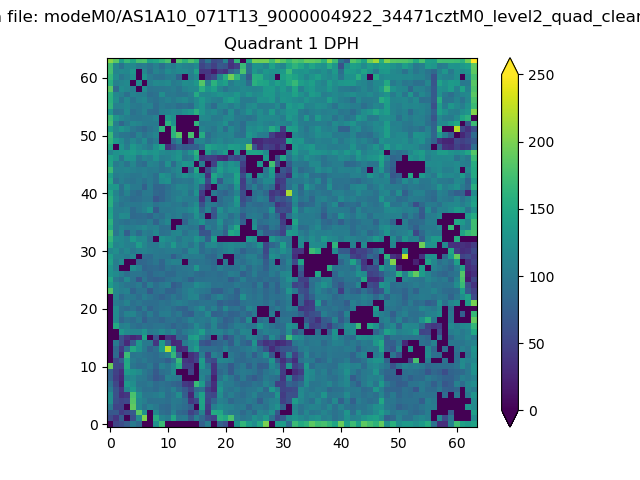
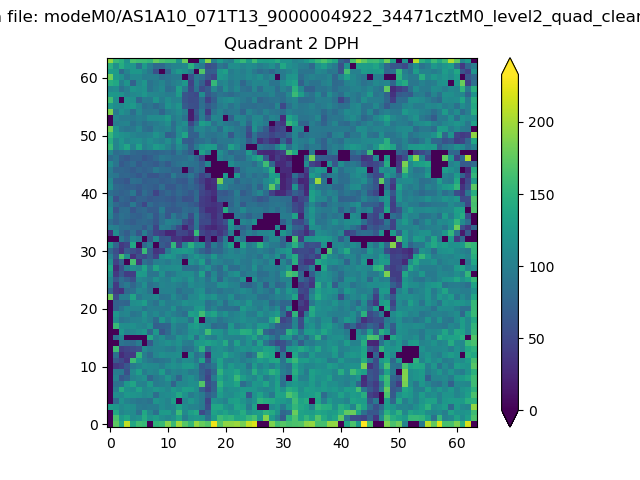
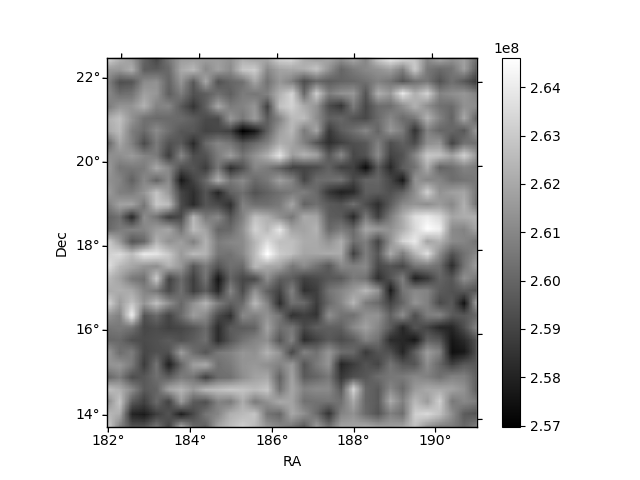
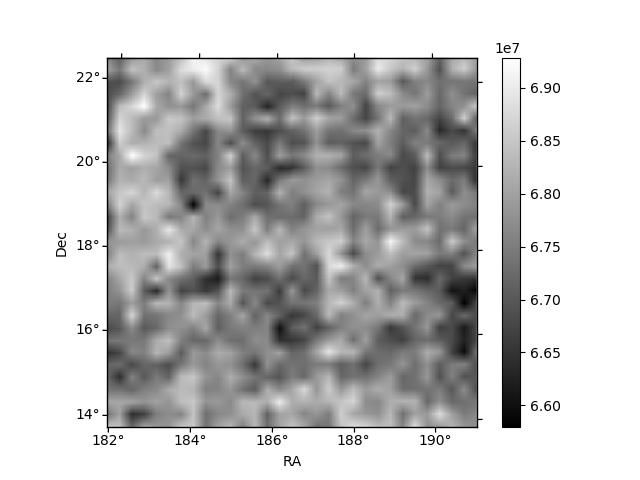
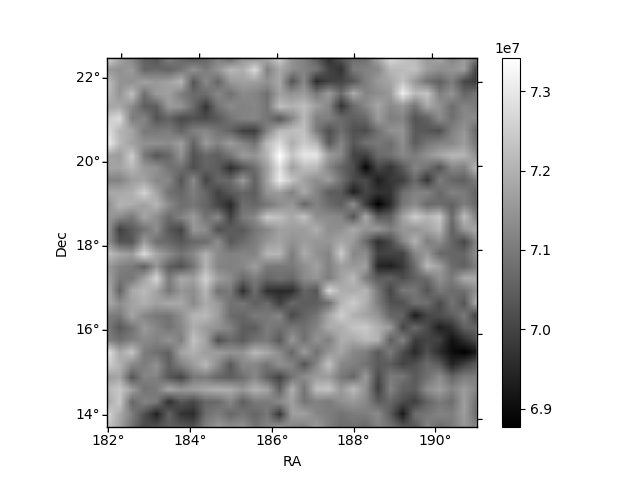
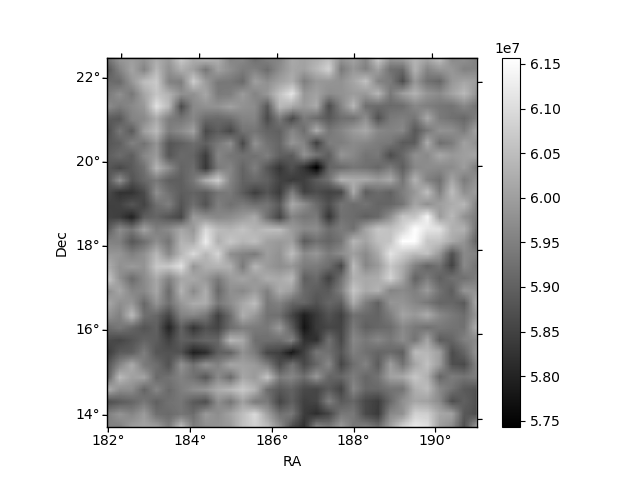
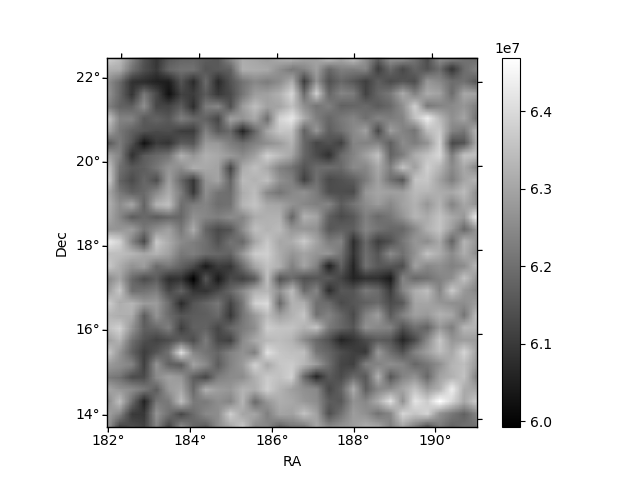
Histogram calculated using DETX and DETY for each event in the final _common_clean file
| Quadrant A | 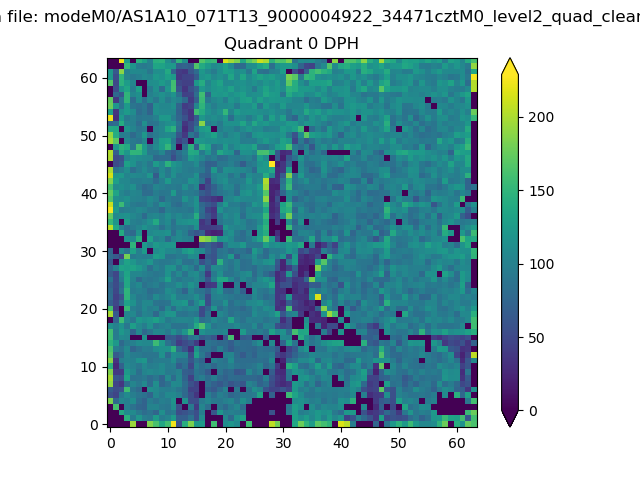 |
 |
Quadrant B |
|---|---|---|---|
| Quadrant D | 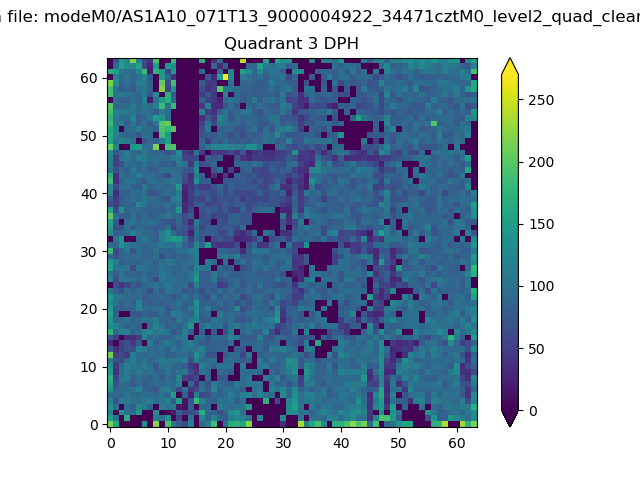 |
 |
Quadrant C |
| Plot type | Count rate plots | Images |
|---|---|---|
| Comparison with Poisson distribution Blue bars denote a histogram of data divided into 1 sec bins. Red curve is a Poisson curve with rate = median count rate of data. |
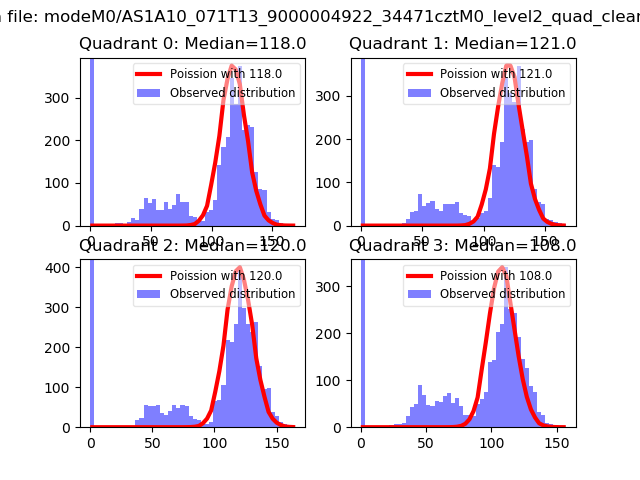 |
 |
| Quadrant-wise count rates Data is divided into 100 sec bins |
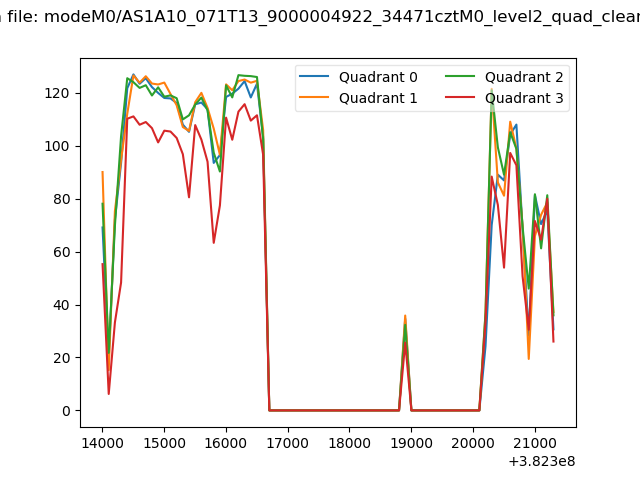 |
|
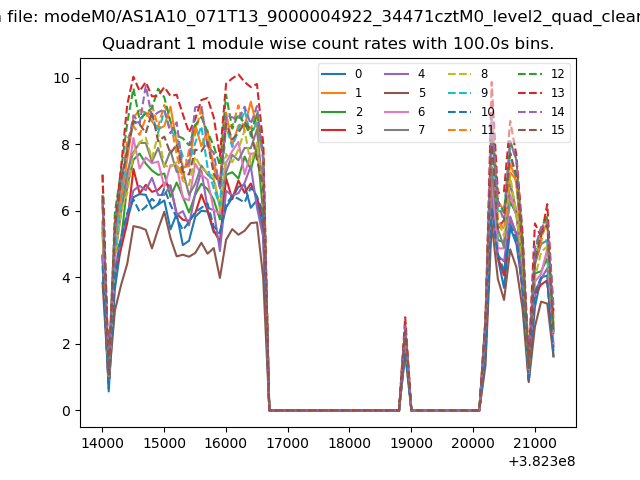
| Module-wise count rates for Quadrant A Data is divided into 100 sec bins |
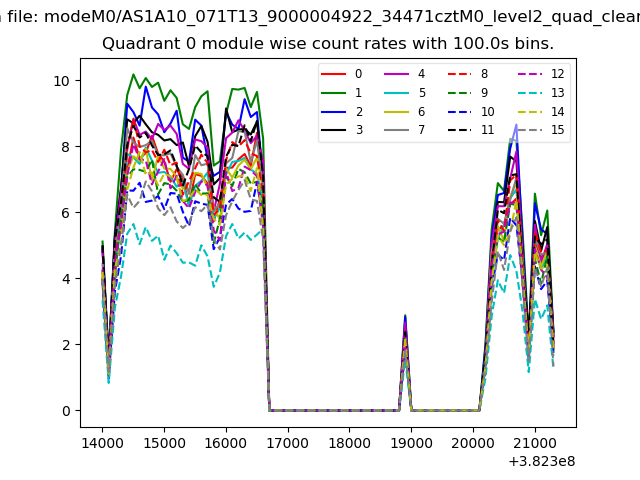 |
 |
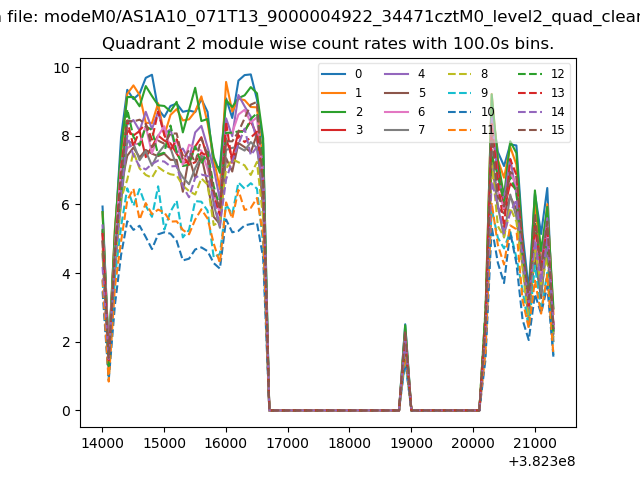
| Module-wise count rates for Quadrant B Data is divided into 100 sec bins |
 |
 |
| Module-wise count rates for Quadrant C Data is divided into 100 sec bins |
 |
 |
| Module-wise count rates for Quadrant D Data is divided into 100 sec bins |
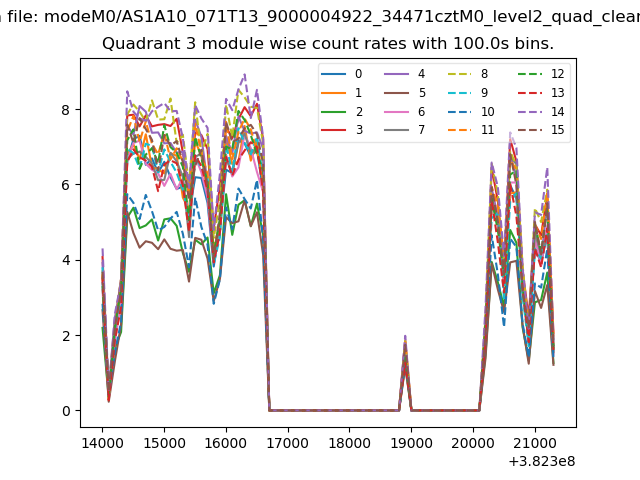 |
 |
| Parameter | Plot |
|---|---|
| CZT HV Monitor | 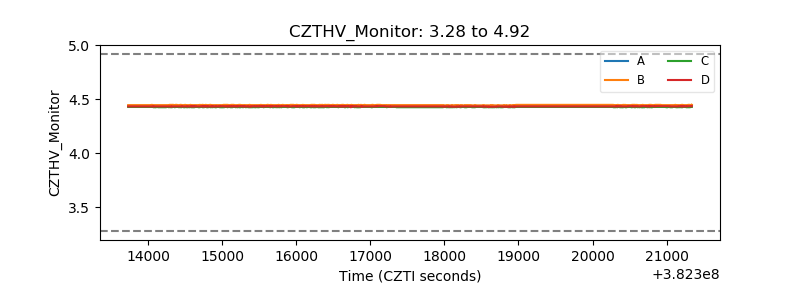 |
| D_VDD | 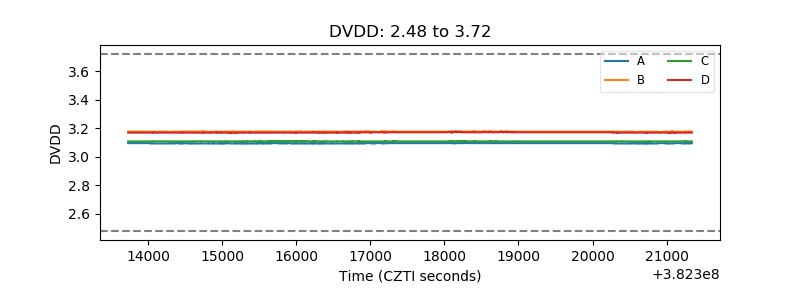 |
| Temperature 1 | 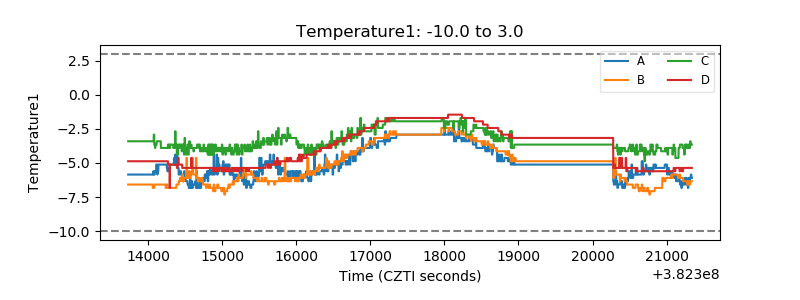 |
| Veto HV Monitor | 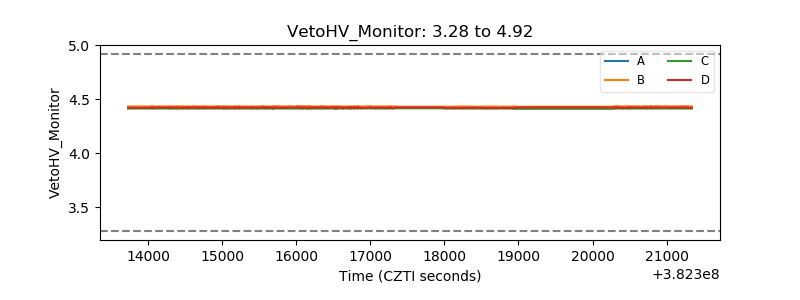 |
| Veto LLD | 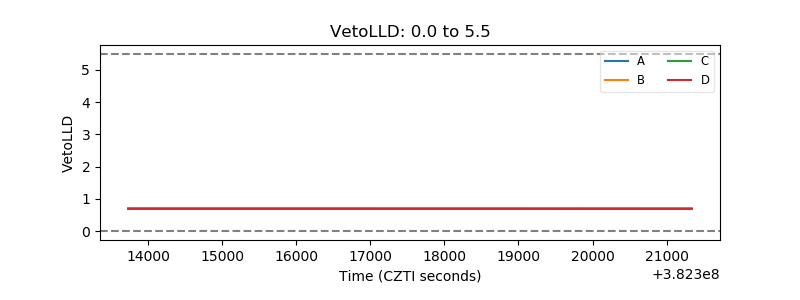 |
| Alpha Counter | 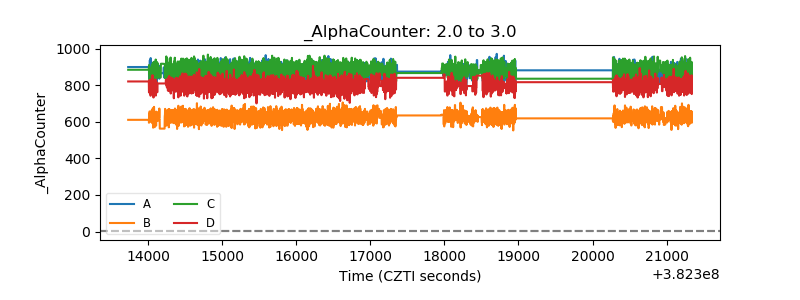 |
| _CPM_Rate | 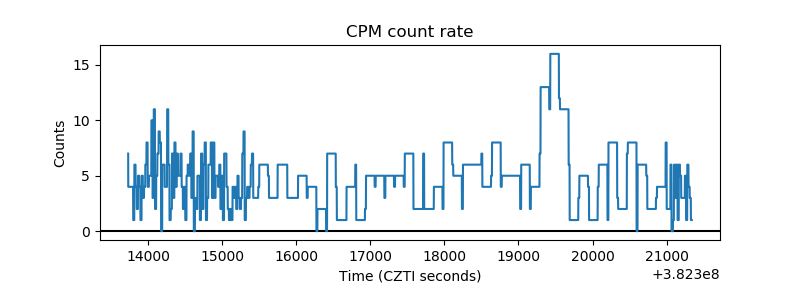 |
| CZT Counter | 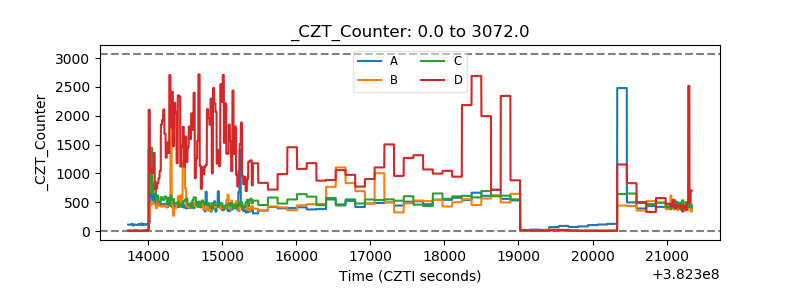 |
| +2.5 Volts monitor | 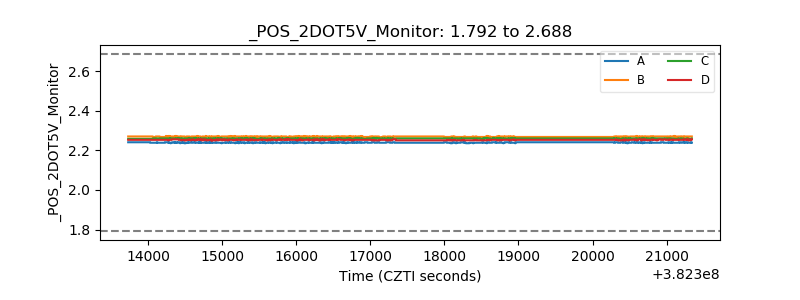 |
| +5 Volts monitor | 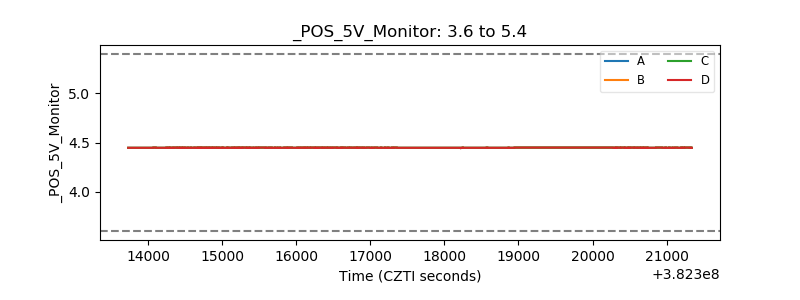 |
| _ROLL_ROT | 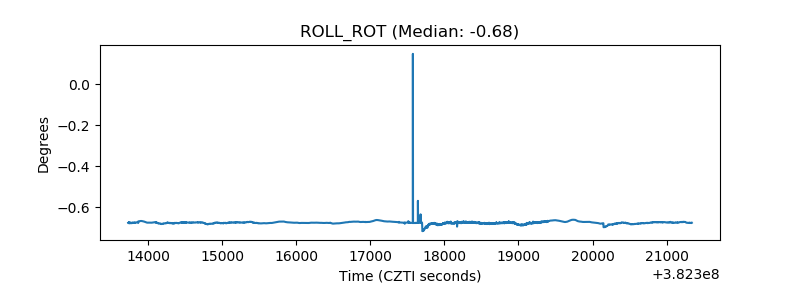 |
| _Roll_DEC | 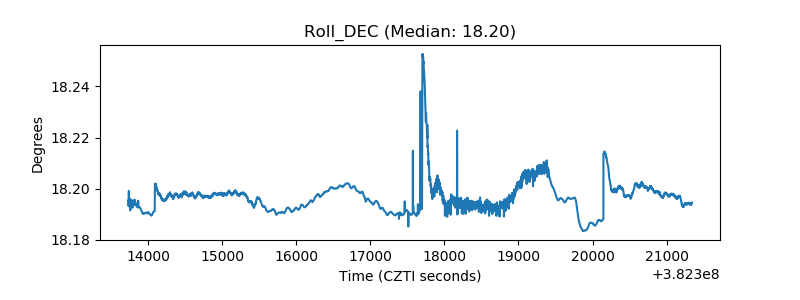 |
| _Roll_RA | 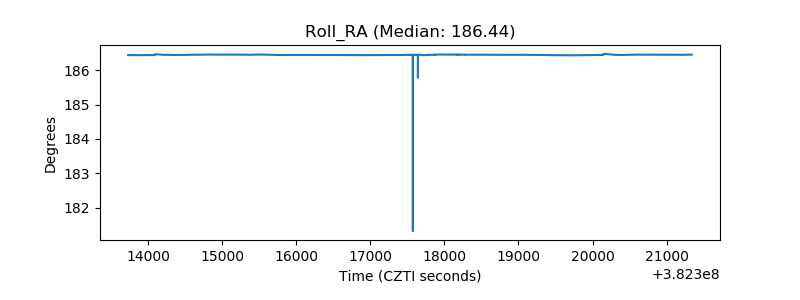 |
| Veto Counter | 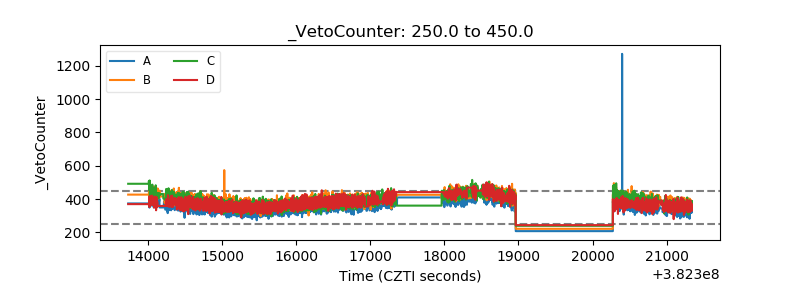 |