| Param | Original file | Final file |
|---|---|---|
| Filename | modeM0/AS1A10_071T13_9000004922_34469cztM0_level2.evt | modeM0/AS1A10_071T13_9000004922_34469cztM0_level2_quad_clean.evt |
| Size (bytes) | 525,084,480 | 84,821,760 |
| Size | 500.8 MB | 80.9 MB |
| Events in quadrant A | 2,643,967 | 568,672 |
| Events in quadrant B | 2,861,480 | 577,037 |
| Events in quadrant C | 2,888,714 | 563,582 |
| Events in quadrant D | 7,139,446 | 478,167 |
| Mode M9 | |||
|---|---|---|---|
| Quadrant | BADHDUFLAG | Total packets | Discarded packets |
| A | 0 | 34 | 0 |
| B | 0 | 34 | 0 |
| C | 0 | 34 | 0 |
| D | 0 | 35 | 0 |
| Mode SS | |||
|---|---|---|---|
| Quadrant | BADHDUFLAG | Total packets | Discarded packets |
| A | 0 | 110 | 0 |
| B | 0 | 110 | 0 |
| C | 0 | 110 | 0 |
| D | 0 | 110 | 0 |
| Mode M0 | |||
|---|---|---|---|
| Quadrant | BADHDUFLAG | Total packets | Discarded packets |
| A | 0 | 11399 | 3 |
| B | 0 | 12060 | 2 |
| C | 0 | 11925 | 2 |
| D | 0 | 25058 | 2 |
| Quadrant | Total seconds | Saturated seconds | Saturation percentage |
|---|---|---|---|
| A | 5443 | 10 | 0.183722% |
| B | 5443 | 76 | 1.396289% |
| C | 5443 | 27 | 0.496050% |
| D | 5443 | 987 | 18.133382% |
Noise dominated data is calculated using 1-second bins in cleaned event files. If a bin has >2000 counts, and if more than 50% of those come from <1% of pixels, then it is considered to be noise-dominated and hence unusable.
| Quadrant | # 1 sec bins | Bins with >0 counts | Bins with >2000 counts | High rate bins dominated by noise | Noise dominated (total time) | Noise dominated (detector-on time) | Marked lightcurve |
|---|---|---|---|---|---|---|---|
| A | 7115 | 5444 | 2 | 2 | 0.03% | 0.04% | 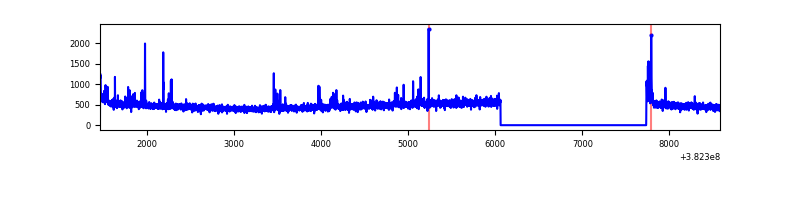 |
| B | 7115 | 5444 | 34 | 34 | 0.48% | 0.62% | 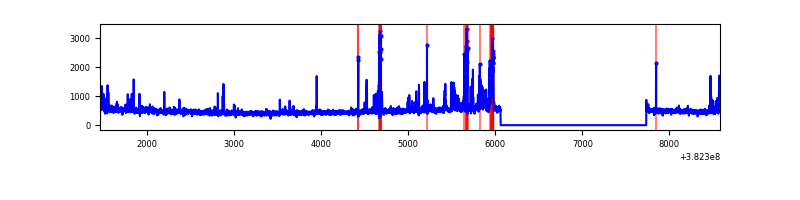 |
| C | 7115 | 5444 | 22 | 22 | 0.31% | 0.40% | 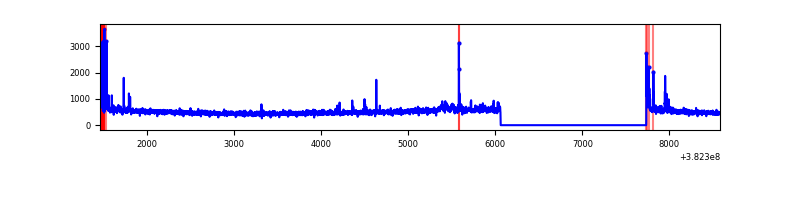 |
| D | 7115 | 5444 | 937 | 937 | 13.17% | 17.21% | 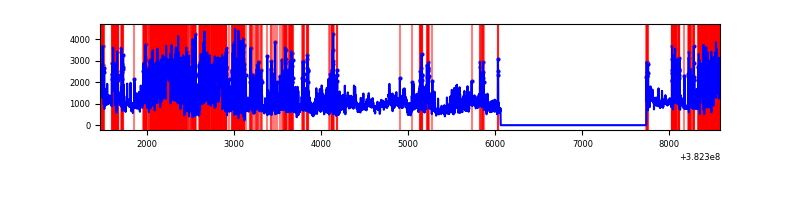 |
Top three noisy pixels from each quadrant. If the there are fewer than three noisy pixels in the level2.evt file, extra rows are filled as -1
| Pixel properties | Quadrant properties | ||||||
|---|---|---|---|---|---|---|---|
| Quadrant | DetID | PixID | Counts | Sigma | Mean | Median | Sigma |
| A | 15 | 169 | 90687 | 694.83 | 645 | 633 | 129.6 |
| A | 10 | 83 | 37015 | 280.71 | 645 | 633 | 129.6 |
| A | 13 | 6 | 11211 | 81.62 | 645 | 633 | 129.6 |
| B | 5 | 172 | 281723 | 2278.57 | 641 | 624 | 123.4 |
| B | 4 | 232 | 18036 | 141.14 | 641 | 624 | 123.4 |
| B | 5 | 173 | 15082 | 117.2 | 641 | 624 | 123.4 |
| C | 15 | 214 | 229063 | 1561.44 | 626 | 631 | 146.3 |
| C | 15 | 208 | 127450 | 866.87 | 626 | 631 | 146.3 |
| C | 0 | 10 | 68359 | 462.95 | 626 | 631 | 146.3 |
| D | 7 | 223 | 2845572 | 18464.84 | 581 | 567 | 154.1 |
| D | 8 | 195 | 896995 | 5818.06 | 581 | 567 | 154.1 |
| D | 10 | 203 | 373715 | 2421.83 | 581 | 567 | 154.1 |
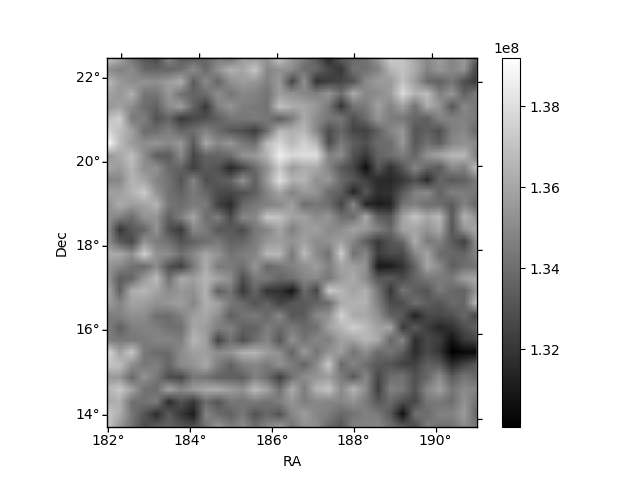
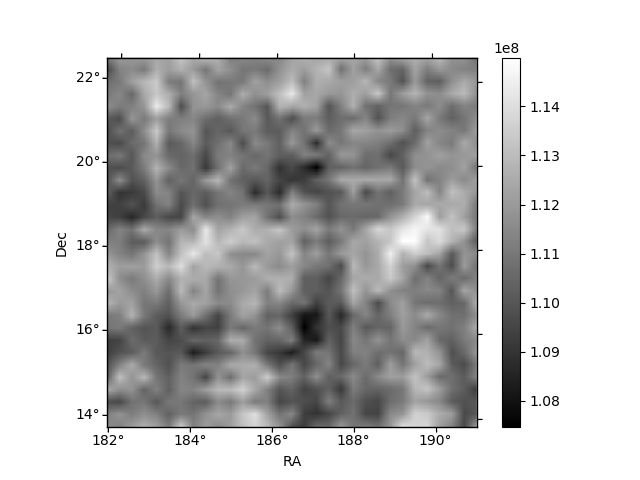
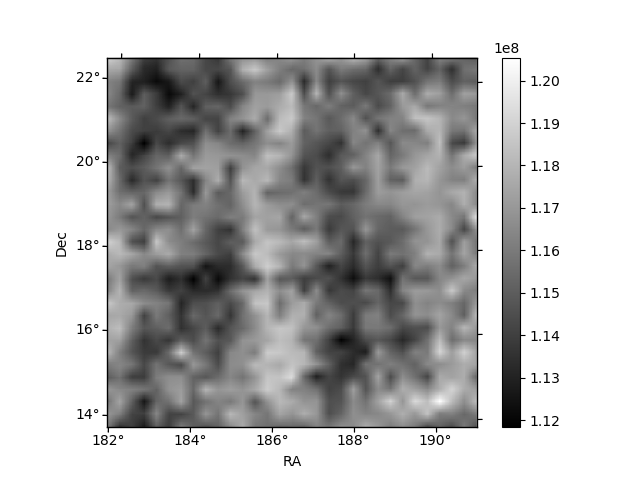
Histogram calculated using DETX and DETY for each event in the final _common_clean file
| Quadrant A | 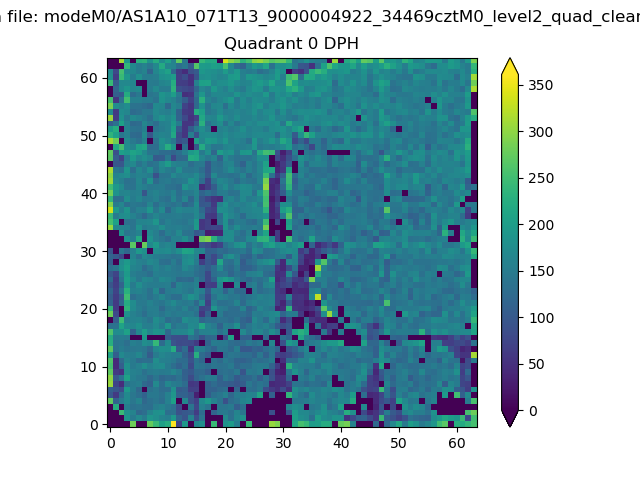 |
 |
Quadrant B |
|---|---|---|---|
| Quadrant D | 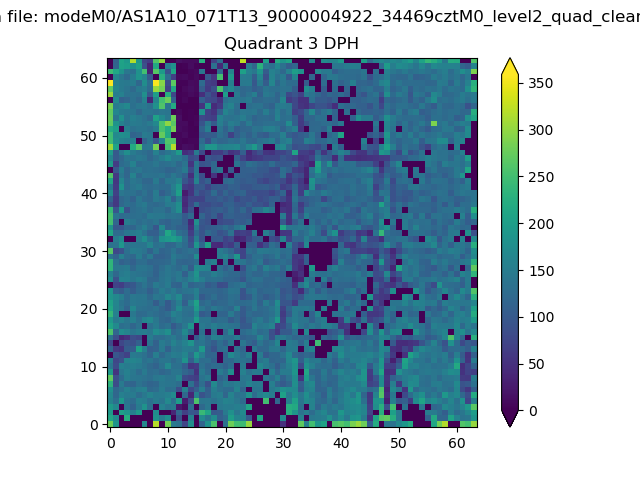 |
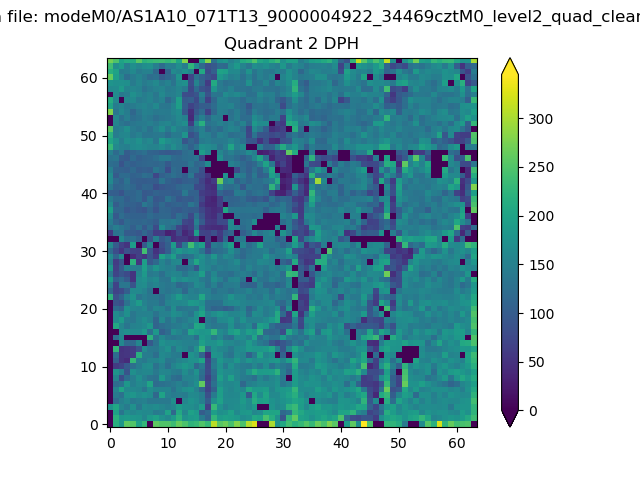 |
Quadrant C |
| Plot type | Count rate plots | Images |
|---|---|---|
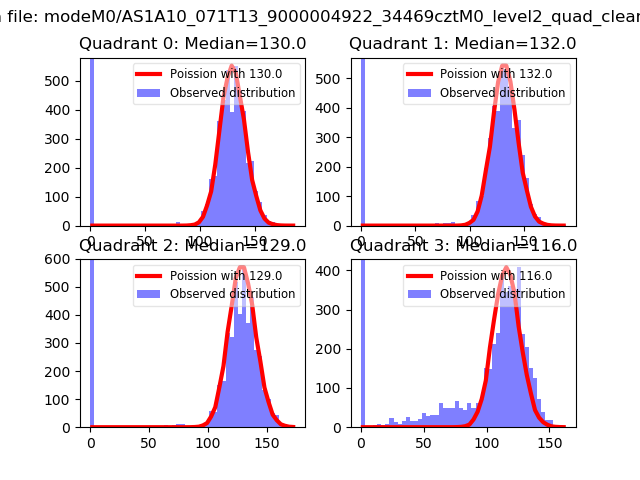
| Comparison with Poisson distribution Blue bars denote a histogram of data divided into 1 sec bins. Red curve is a Poisson curve with rate = median count rate of data. |
 |
 |
| Quadrant-wise count rates Data is divided into 100 sec bins |
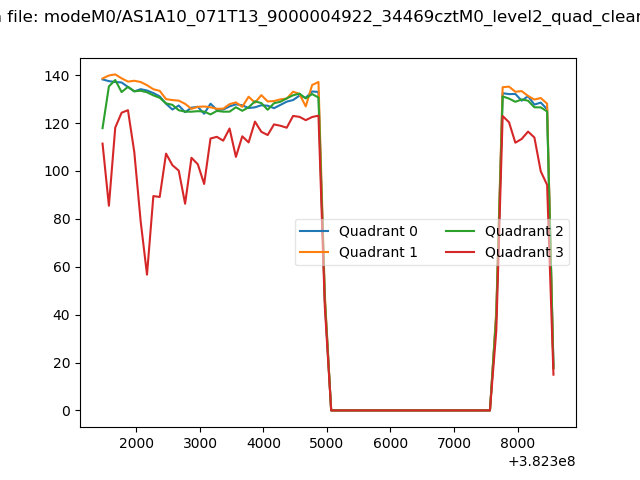 |
|
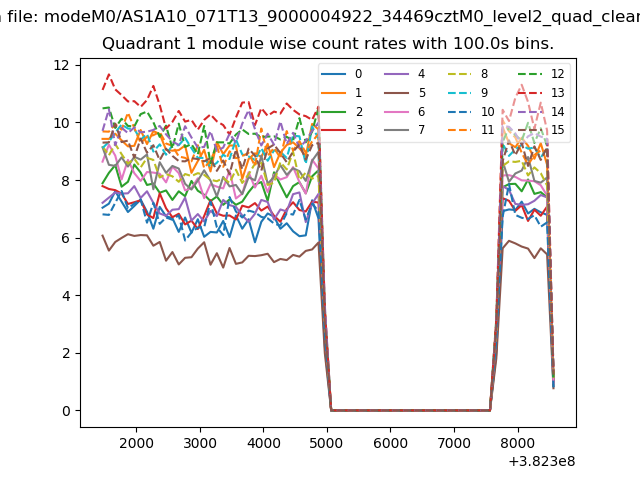
| Module-wise count rates for Quadrant A Data is divided into 100 sec bins |
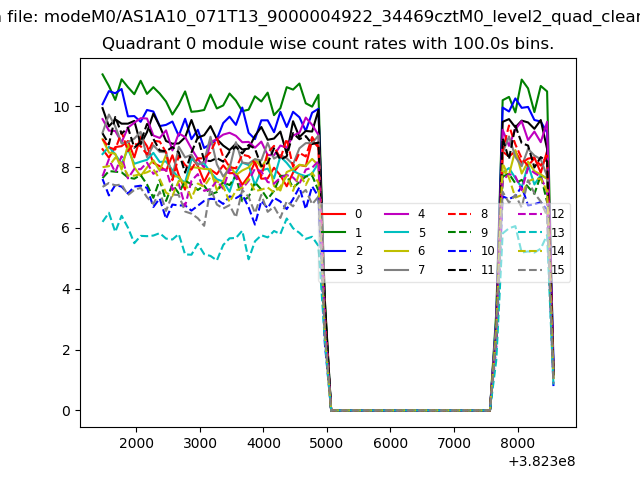 |
 |
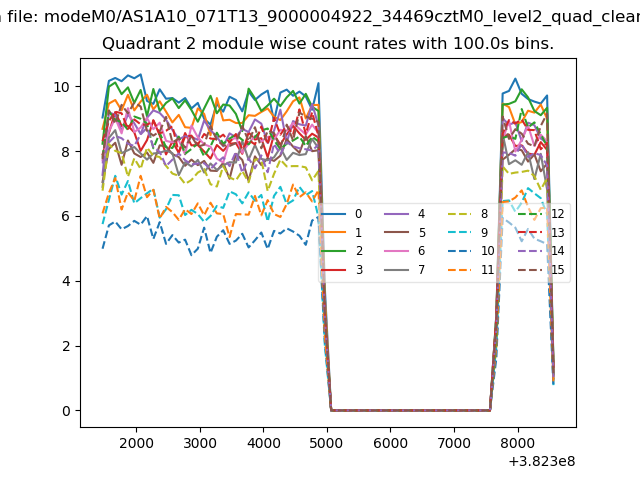
| Module-wise count rates for Quadrant B Data is divided into 100 sec bins |
 |
 |
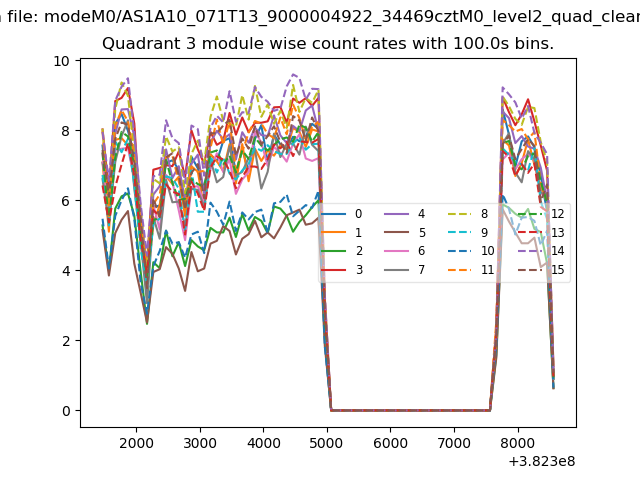
| Module-wise count rates for Quadrant C Data is divided into 100 sec bins |
 |
 |
| Module-wise count rates for Quadrant D Data is divided into 100 sec bins |
 |
 |
| Parameter | Plot |
|---|---|
| CZT HV Monitor | 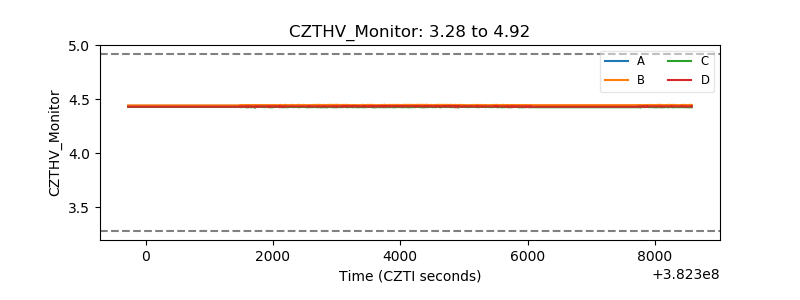 |
| D_VDD | 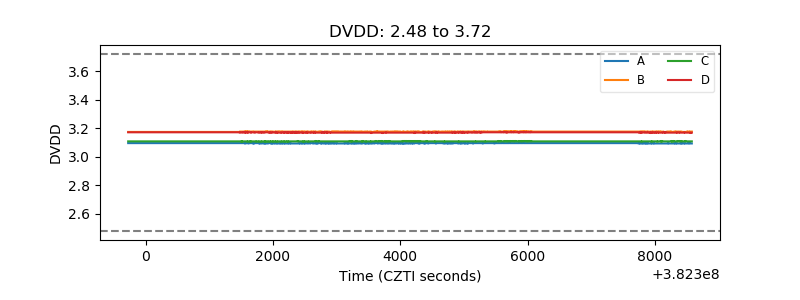 |
| Temperature 1 | 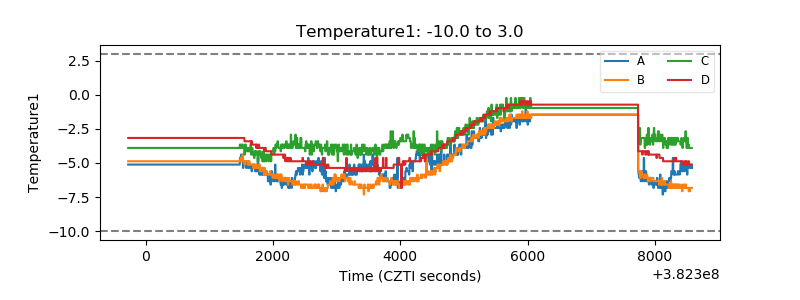 |
| Veto HV Monitor | 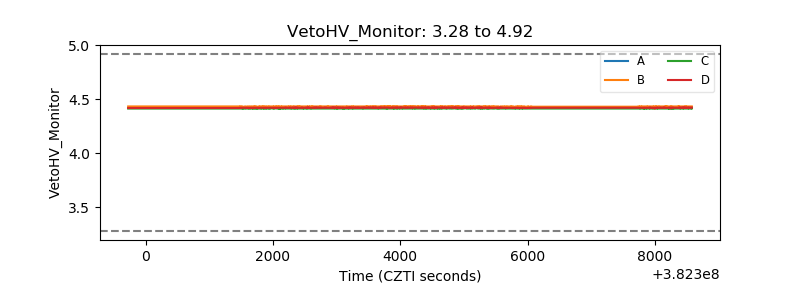 |
| Veto LLD | 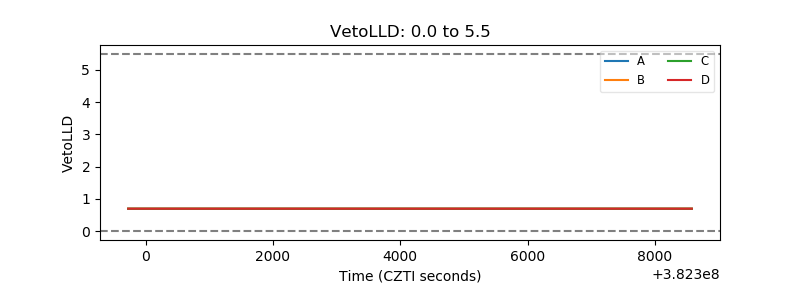 |
| Alpha Counter | 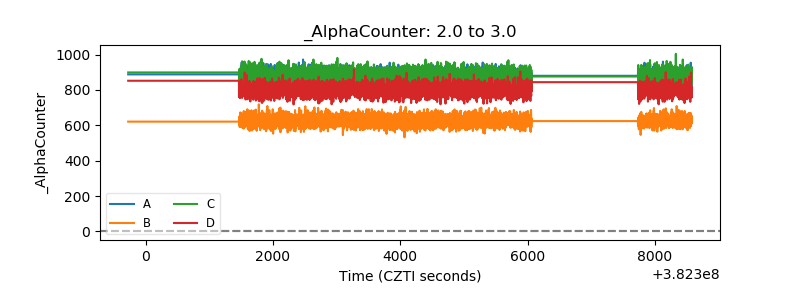 |
| _CPM_Rate | 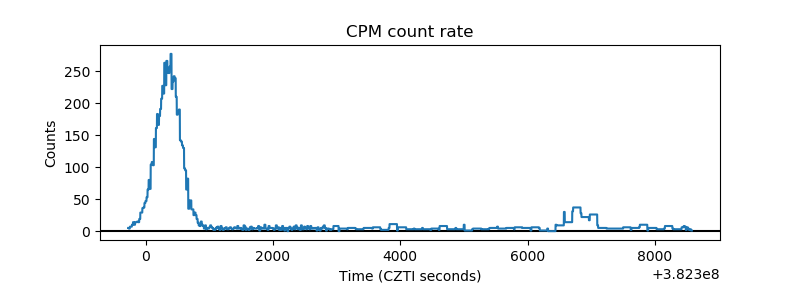 |
| CZT Counter | 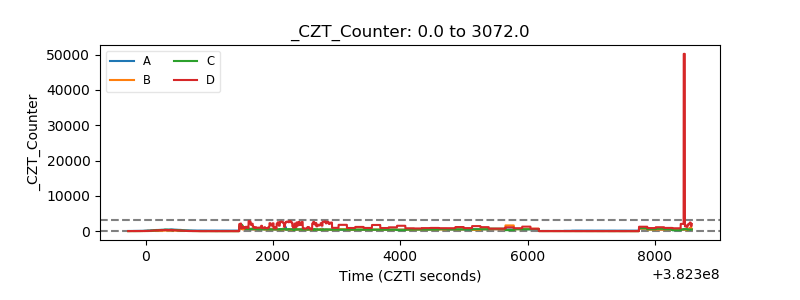 |
| +2.5 Volts monitor | 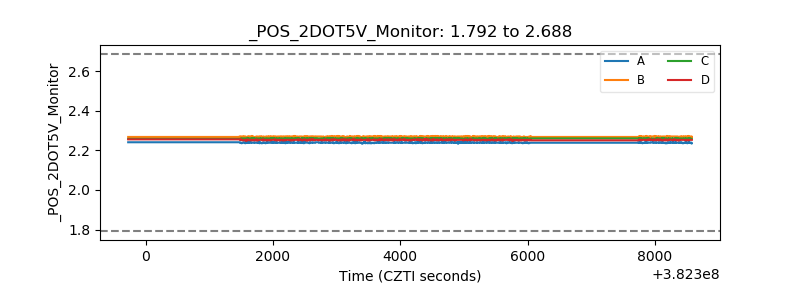 |
| +5 Volts monitor | 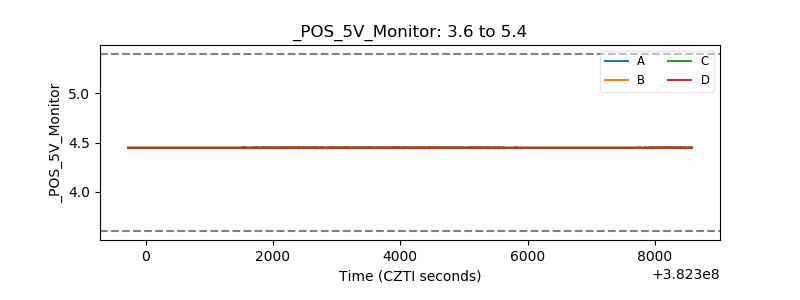 |
| _ROLL_ROT | 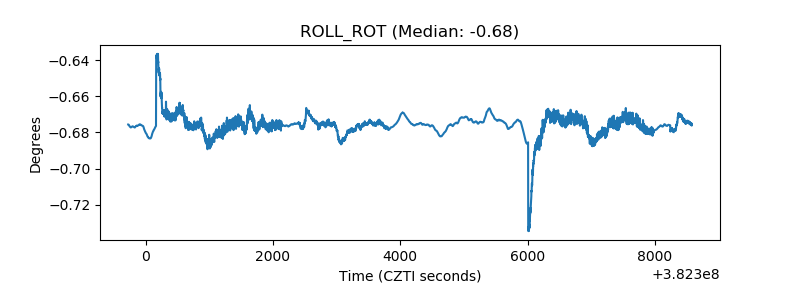 |
| _Roll_DEC | 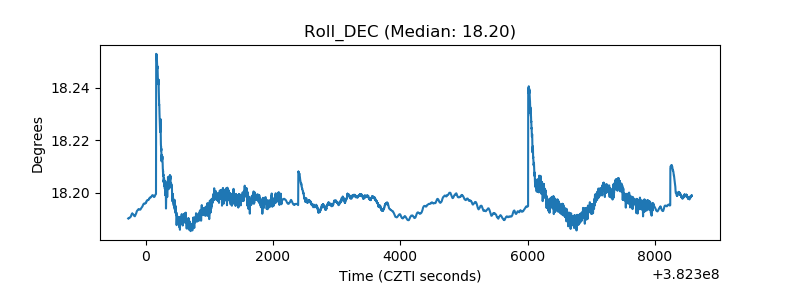 |
| _Roll_RA | 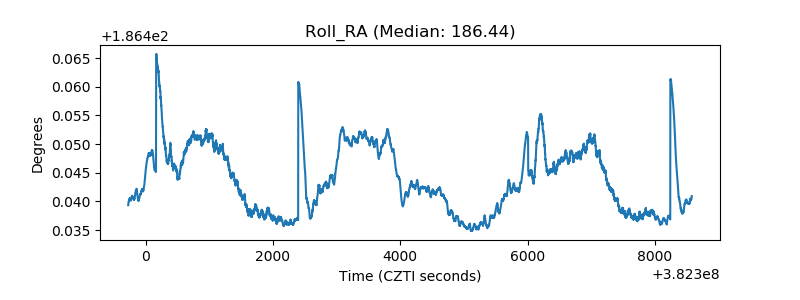 |
| Veto Counter | 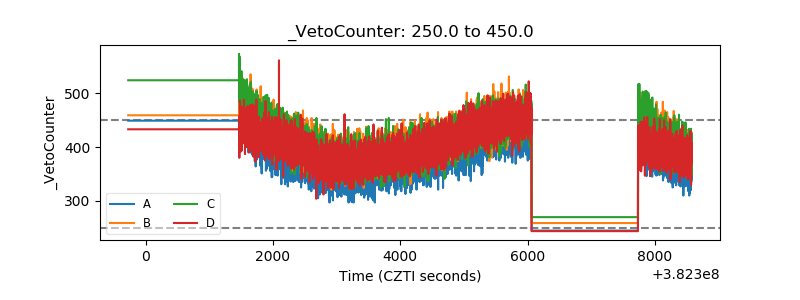 |