| Param | Original file | Final file |
|---|---|---|
| Filename | modeM0/AS1A10_071T13_9000004922_34468cztM0_level2.evt | modeM0/AS1A10_071T13_9000004922_34468cztM0_level2_quad_clean.evt |
| Size (bytes) | 256,806,720 | 46,180,800 |
| Size | 244.9 MB | 44.0 MB |
| Events in quadrant A | 1,334,875 | 314,429 |
| Events in quadrant B | 1,448,100 | 320,213 |
| Events in quadrant C | 1,465,164 | 309,883 |
| Events in quadrant D | 3,350,795 | 266,556 |
| Mode M9 | |||
|---|---|---|---|
| Quadrant | BADHDUFLAG | Total packets | Discarded packets |
| A | 0 | 20 | 0 |
| B | 0 | 20 | 0 |
| C | 0 | 20 | 0 |
| D | 0 | 20 | 0 |
| Mode SS | |||
|---|---|---|---|
| Quadrant | BADHDUFLAG | Total packets | Discarded packets |
| A | 0 | 54 | 0 |
| B | 0 | 54 | 0 |
| C | 0 | 54 | 0 |
| D | 0 | 54 | 0 |
| Mode M0 | |||
|---|---|---|---|
| Quadrant | BADHDUFLAG | Total packets | Discarded packets |
| A | 0 | 5545 | 2 |
| B | 0 | 5906 | 1 |
| C | 0 | 5875 | 1 |
| D | 0 | 11800 | 1 |
| Quadrant | Total seconds | Saturated seconds | Saturation percentage |
|---|---|---|---|
| A | 2609 | 6 | 0.229973% |
| B | 2609 | 16 | 0.613262% |
| C | 2609 | 20 | 0.766577% |
| D | 2609 | 434 | 16.634726% |
Noise dominated data is calculated using 1-second bins in cleaned event files. If a bin has >2000 counts, and if more than 50% of those come from <1% of pixels, then it is considered to be noise-dominated and hence unusable.
| Quadrant | # 1 sec bins | Bins with >0 counts | Bins with >2000 counts | High rate bins dominated by noise | Noise dominated (total time) | Noise dominated (detector-on time) | Marked lightcurve |
|---|---|---|---|---|---|---|---|
| A | 4612 | 2610 | 2 | 2 | 0.04% | 0.08% | 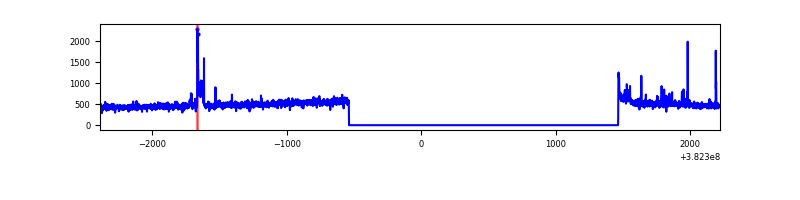 |
| B | 4612 | 2610 | 11 | 11 | 0.24% | 0.42% | 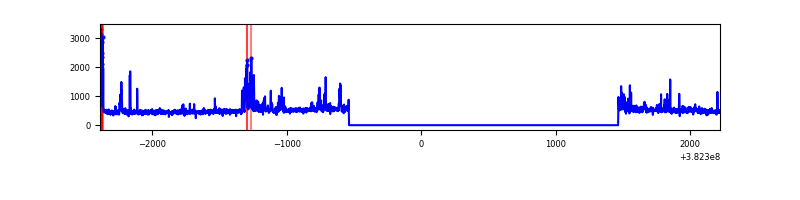 |
| C | 4612 | 2610 | 16 | 16 | 0.35% | 0.61% | 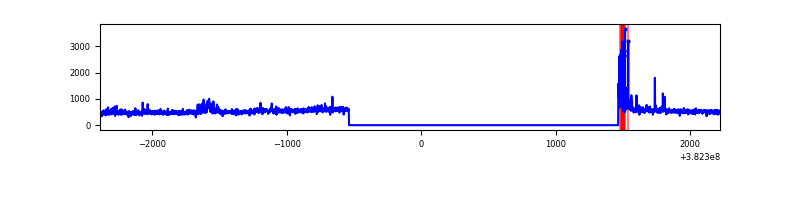 |
| D | 4611 | 2609 | 418 | 418 | 9.07% | 16.02% | 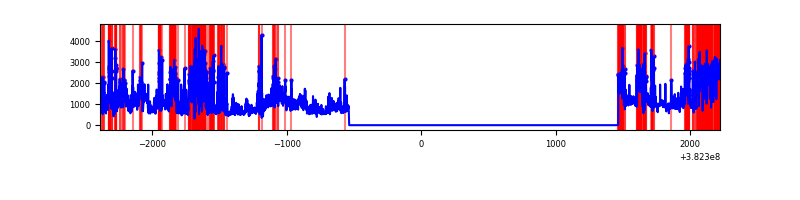 |
Top three noisy pixels from each quadrant. If the there are fewer than three noisy pixels in the level2.evt file, extra rows are filled as -1
| Pixel properties | Quadrant properties | ||||||
|---|---|---|---|---|---|---|---|
| Quadrant | DetID | PixID | Counts | Sigma | Mean | Median | Sigma |
| A | 15 | 169 | 52962 | 800.51 | 324 | 318 | 65.8 |
| A | 10 | 83 | 18481 | 276.19 | 324 | 318 | 65.8 |
| A | 9 | 143 | 7257 | 105.52 | 324 | 318 | 65.8 |
| B | 5 | 172 | 156578 | 2501.34 | 319 | 312 | 62.5 |
| B | 4 | 232 | 17029 | 267.59 | 319 | 312 | 62.5 |
| B | 12 | 111 | 7596 | 116.59 | 319 | 312 | 62.5 |
| C | 15 | 214 | 110413 | 1497.02 | 311 | 314 | 73.5 |
| C | 15 | 208 | 55396 | 748.95 | 311 | 314 | 73.5 |
| C | 0 | 10 | 44285 | 597.87 | 311 | 314 | 73.5 |
| D | 7 | 223 | 1370301 | 16924.16 | 291 | 285 | 81.0 |
| D | 8 | 195 | 334439 | 4127.89 | 291 | 285 | 81.0 |
| D | 10 | 203 | 149770 | 1846.63 | 291 | 285 | 81.0 |
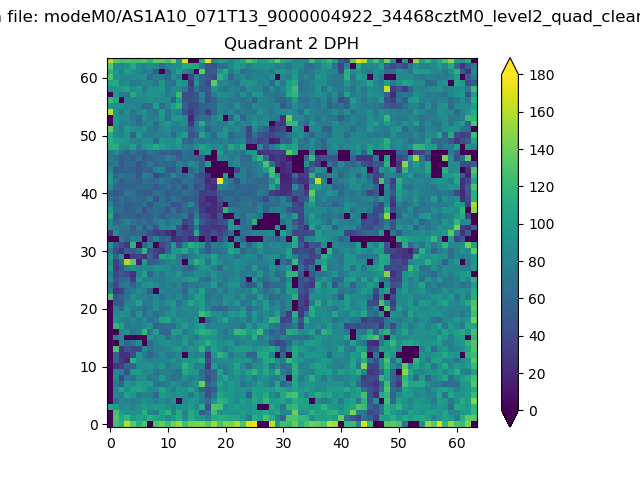
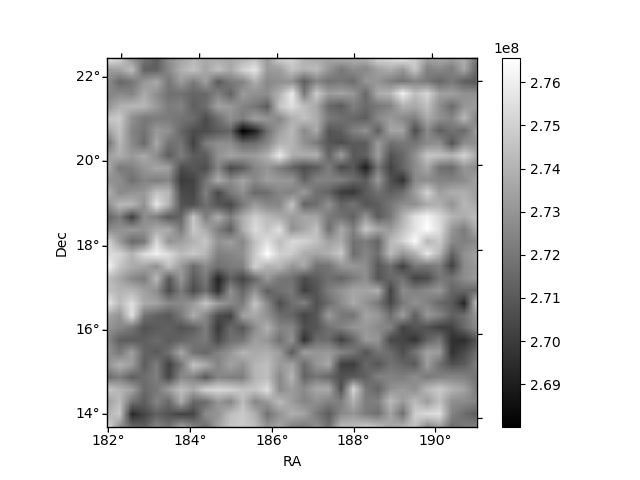
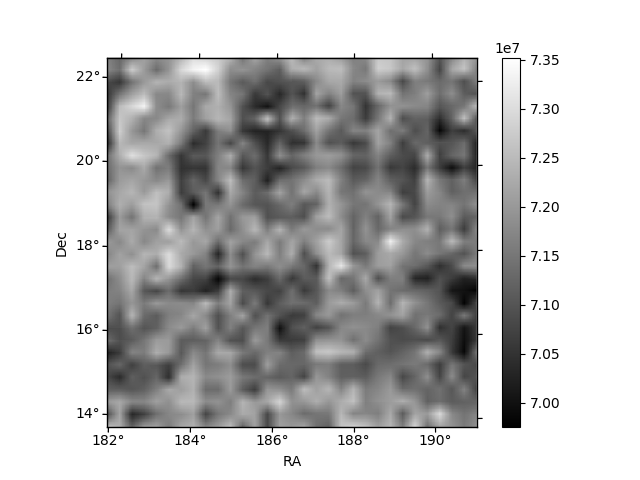
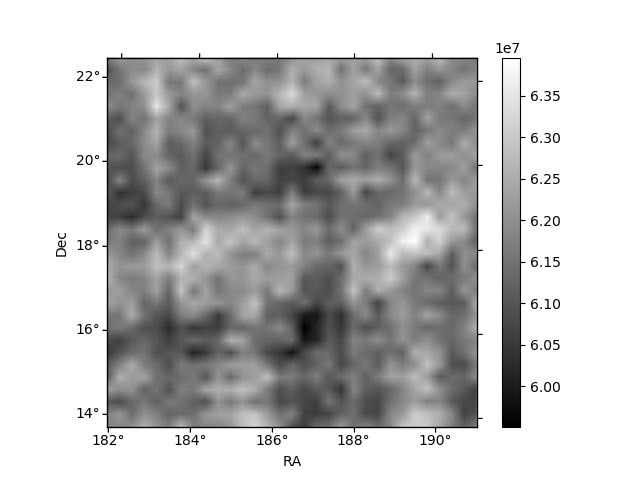
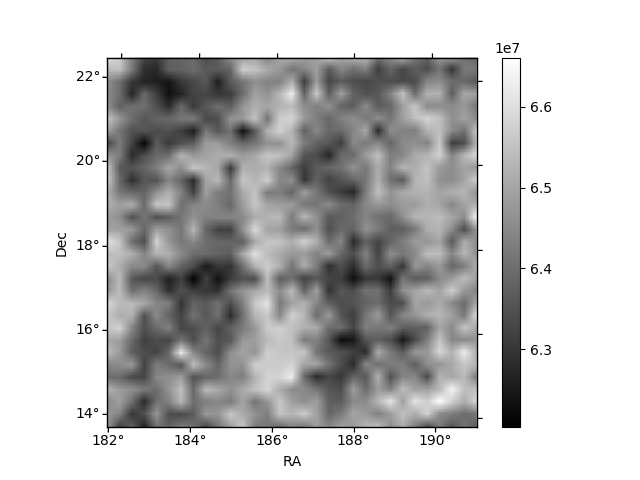
Histogram calculated using DETX and DETY for each event in the final _common_clean file
| Quadrant A | 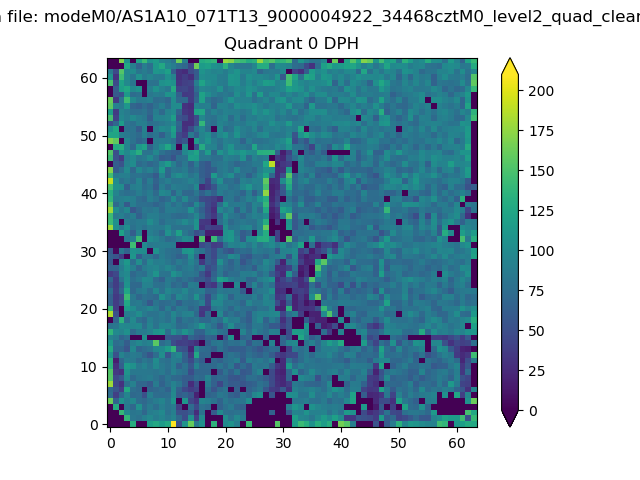 |
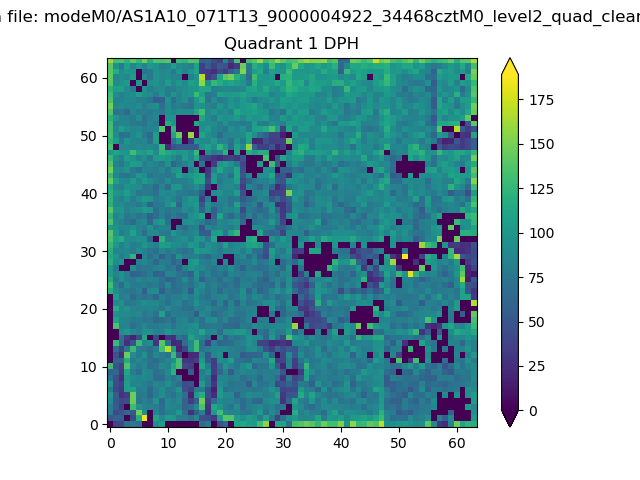 |
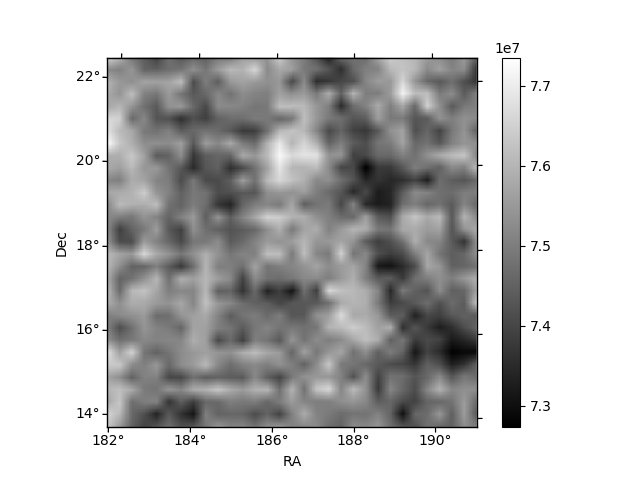
Quadrant B |
|---|---|---|---|
| Quadrant D | 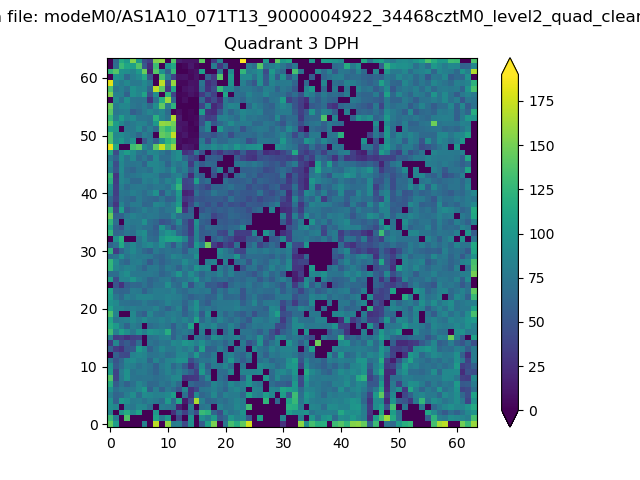 |
 |
Quadrant C |
| Plot type | Count rate plots | Images |
|---|---|---|
| Comparison with Poisson distribution Blue bars denote a histogram of data divided into 1 sec bins. Red curve is a Poisson curve with rate = median count rate of data. |
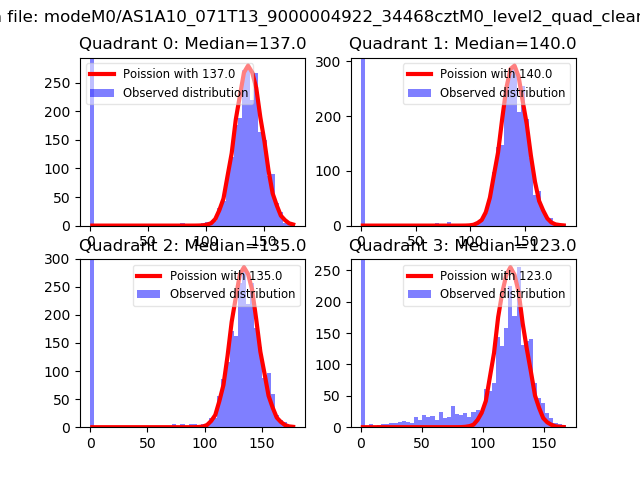 |
 |
| Quadrant-wise count rates Data is divided into 100 sec bins |
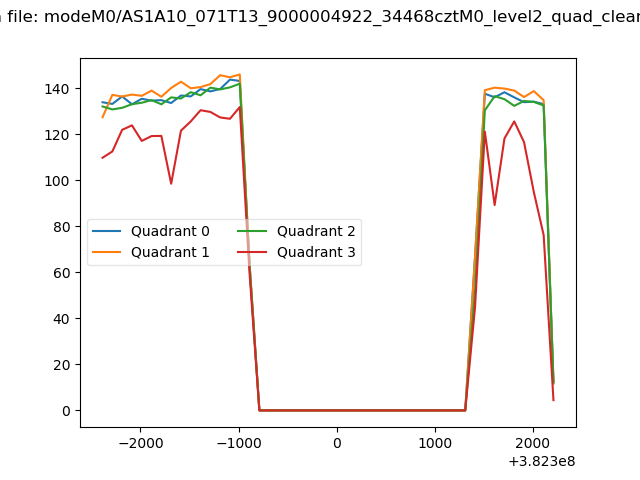 |
|
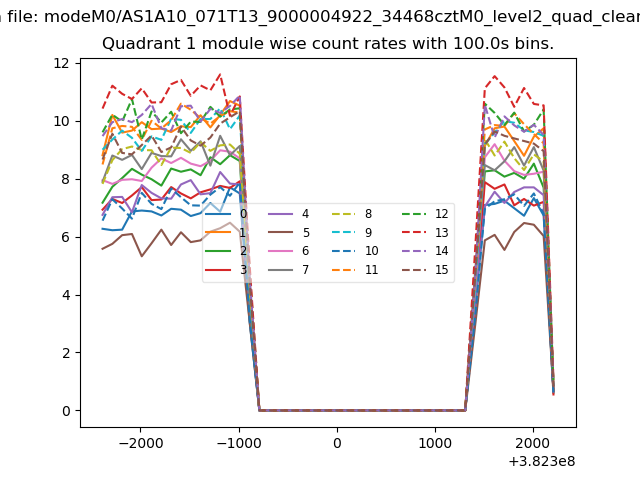
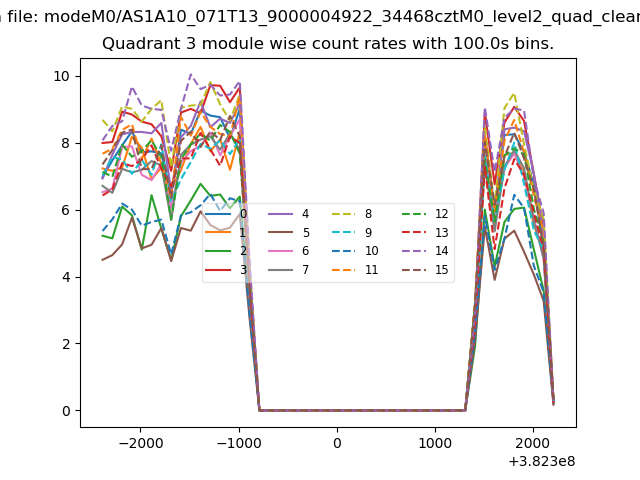
| Module-wise count rates for Quadrant A Data is divided into 100 sec bins |
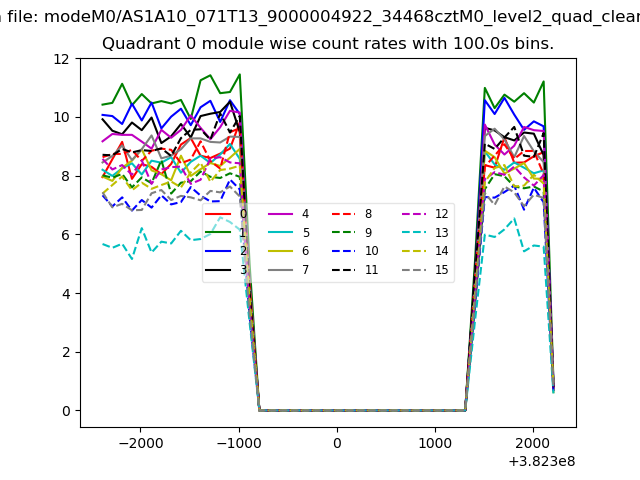 |
 |
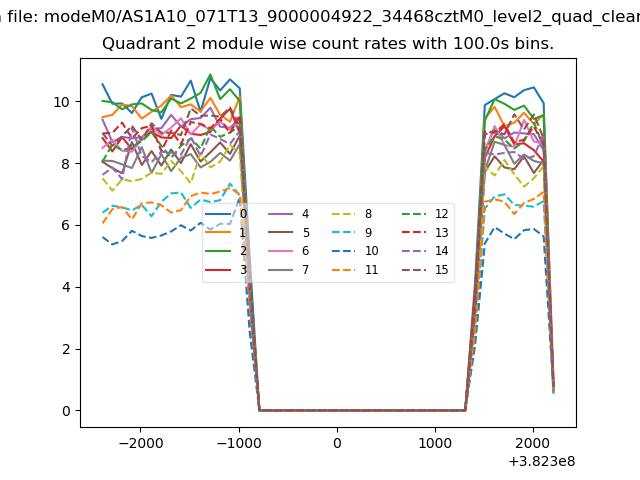
| Module-wise count rates for Quadrant B Data is divided into 100 sec bins |
 |
 |
| Module-wise count rates for Quadrant C Data is divided into 100 sec bins |
 |
 |
| Module-wise count rates for Quadrant D Data is divided into 100 sec bins |
 |
 |
| Parameter | Plot |
|---|---|
| CZT HV Monitor | 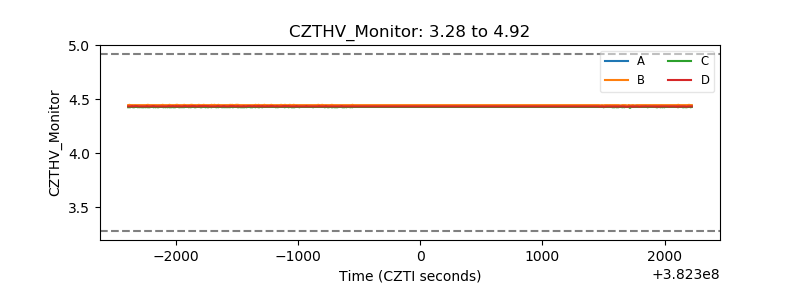 |
| D_VDD | 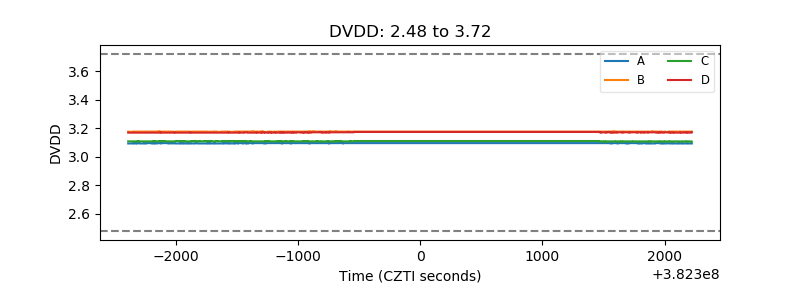 |
| Temperature 1 | 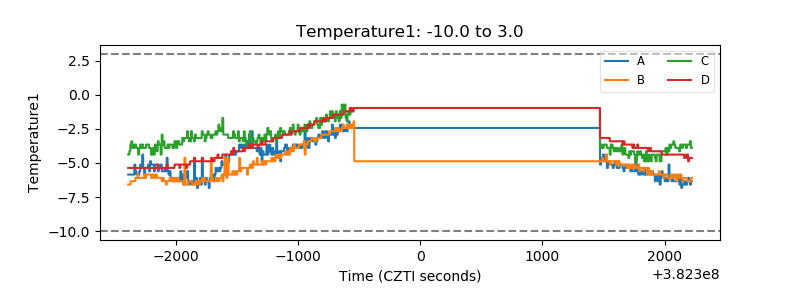 |
| Veto HV Monitor | 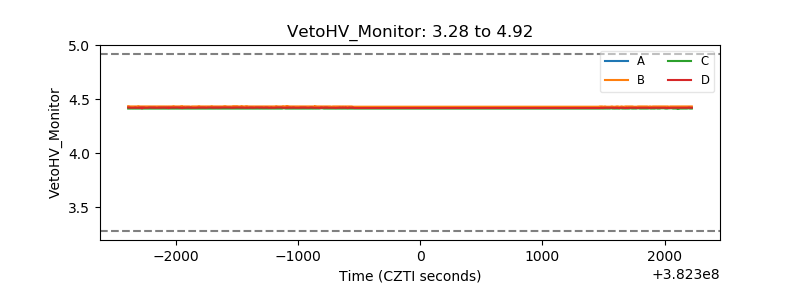 |
| Veto LLD | 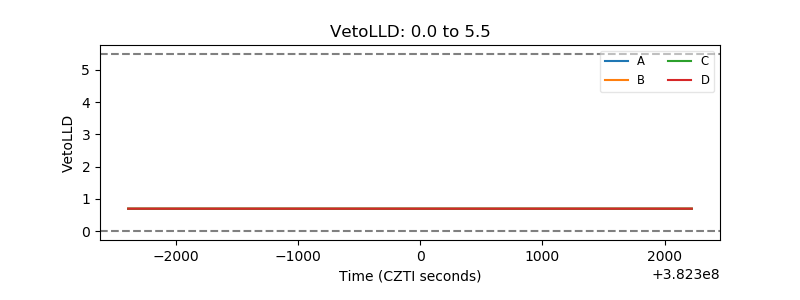 |
| Alpha Counter | 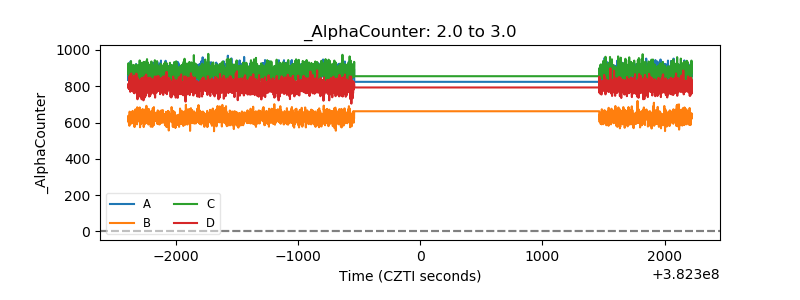 |
| _CPM_Rate | 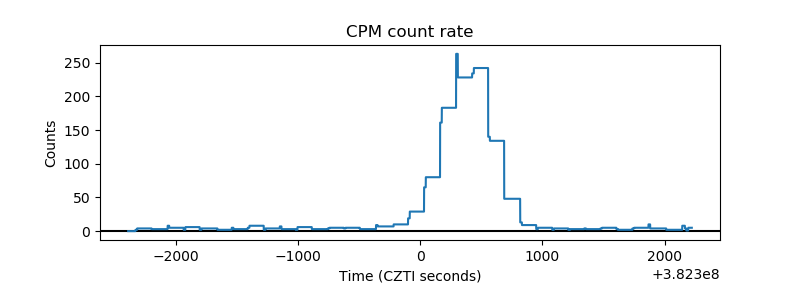 |
| CZT Counter | 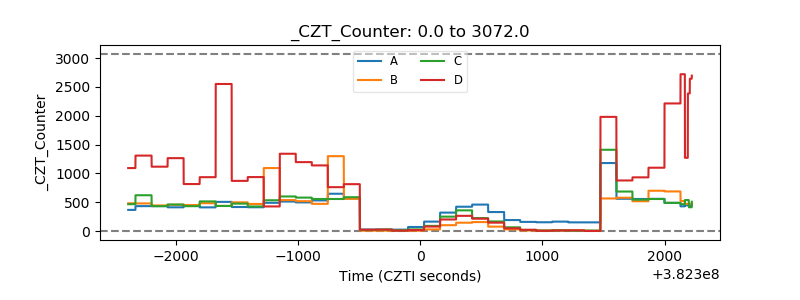 |
| +2.5 Volts monitor | 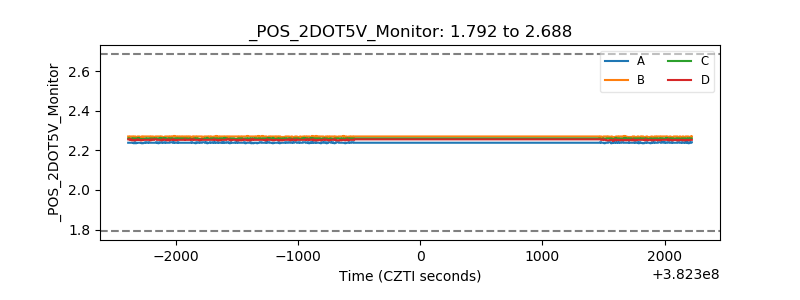 |
| +5 Volts monitor | 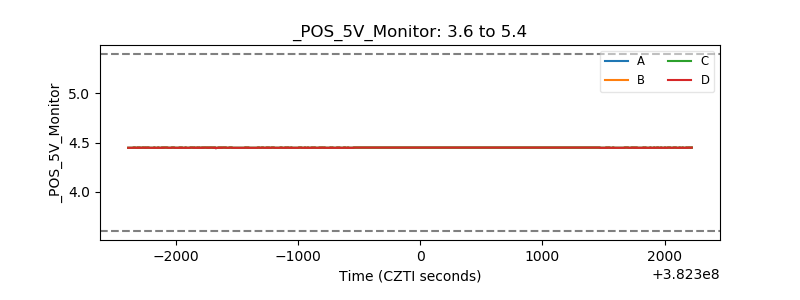 |
| _ROLL_ROT | 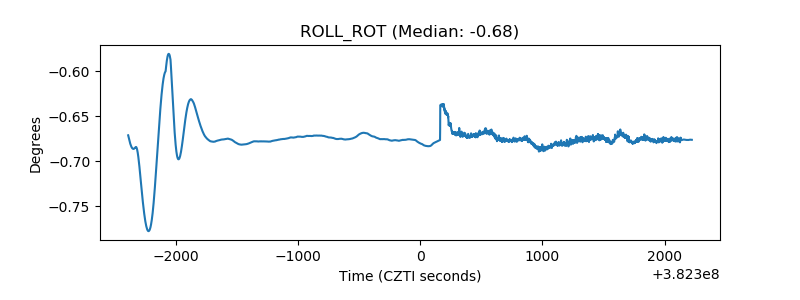 |
| _Roll_DEC | 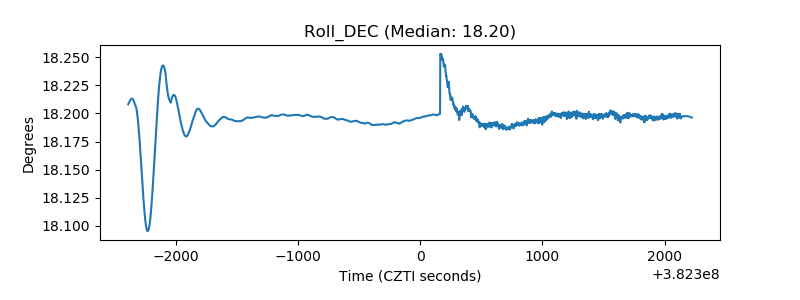 |
| _Roll_RA | 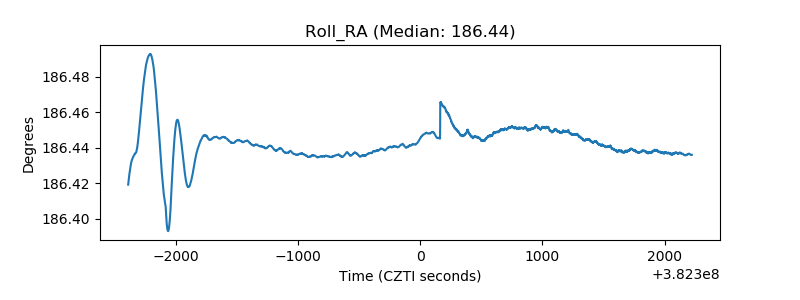 |
| Veto Counter | 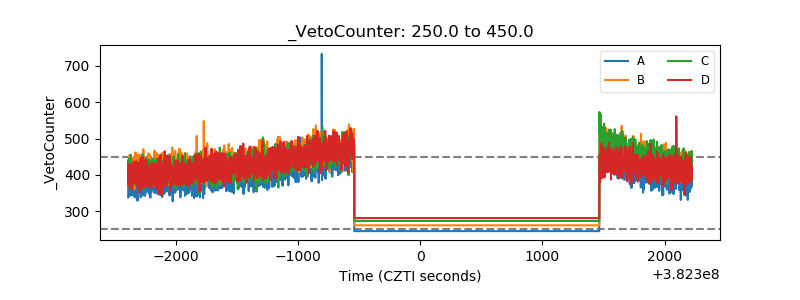 |