| Param | Original file | Final file |
|---|---|---|
| Filename | modeM0/AS1A10_058T06_9000004920_34468cztM0_level2.evt | modeM0/AS1A10_058T06_9000004920_34468cztM0_level2_quad_clean.evt |
| Size (bytes) | 188,104,320 | 21,035,520 |
| Size | 179.4 MB | 20.1 MB |
| Events in quadrant A | 1,010,713 | 139,494 |
| Events in quadrant B | 932,930 | 140,123 |
| Events in quadrant C | 1,010,129 | 136,286 |
| Events in quadrant D | 2,626,836 | 96,891 |
| Mode SS | |||
|---|---|---|---|
| Quadrant | BADHDUFLAG | Total packets | Discarded packets |
| A | 0 | 34 | 0 |
| B | 0 | 34 | 0 |
| C | 0 | 34 | 0 |
| D | 0 | 34 | 0 |
| Mode M0 | |||
|---|---|---|---|
| Quadrant | BADHDUFLAG | Total packets | Discarded packets |
| A | 0 | 4064 | 1 |
| B | 0 | 3771 | 1 |
| C | 0 | 4019 | 1 |
| D | 0 | 9020 | 1 |
| Mode M9 | |||
|---|---|---|---|
| Quadrant | BADHDUFLAG | Total packets | Discarded packets |
| A | 0 | 17 | 0 |
| B | 0 | 17 | 0 |
| C | 0 | 17 | 0 |
| D | 0 | 18 | 0 |
| Quadrant | Total seconds | Saturated seconds | Saturation percentage |
|---|---|---|---|
| A | 1676 | 40 | 2.386635% |
| B | 1676 | 18 | 1.073986% |
| C | 1676 | 16 | 0.954654% |
| D | 1676 | 580 | 34.606205% |
Noise dominated data is calculated using 1-second bins in cleaned event files. If a bin has >2000 counts, and if more than 50% of those come from <1% of pixels, then it is considered to be noise-dominated and hence unusable.
| Quadrant | # 1 sec bins | Bins with >0 counts | Bins with >2000 counts | High rate bins dominated by noise | Noise dominated (total time) | Noise dominated (detector-on time) | Marked lightcurve |
|---|---|---|---|---|---|---|---|
| A | 1676 | 1676 | 27 | 27 | 1.61% | 1.61% | 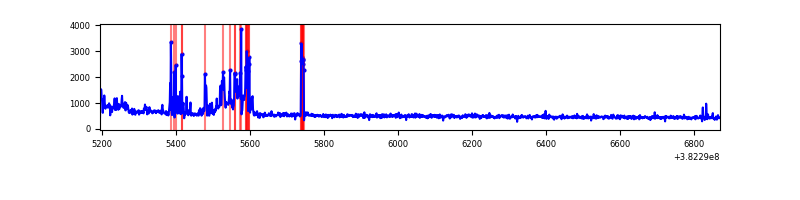 |
| B | 1676 | 1676 | 12 | 12 | 0.72% | 0.72% | 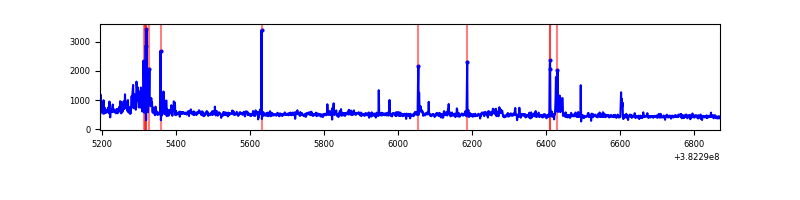 |
| C | 1676 | 1676 | 14 | 14 | 0.84% | 0.84% | 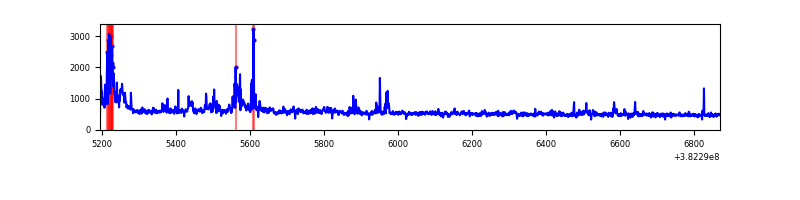 |
| D | 1676 | 1676 | 558 | 558 | 33.29% | 33.29% | 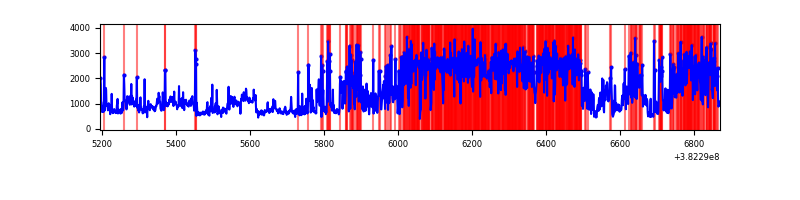 |
Top three noisy pixels from each quadrant. If the there are fewer than three noisy pixels in the level2.evt file, extra rows are filled as -1
| Pixel properties | Quadrant properties | ||||||
|---|---|---|---|---|---|---|---|
| Quadrant | DetID | PixID | Counts | Sigma | Mean | Median | Sigma |
| A | 15 | 169 | 169209 | 3831.46 | 209 | 206 | 44.1 |
| A | 10 | 83 | 17718 | 397.01 | 209 | 206 | 44.1 |
| A | 13 | 6 | 7207 | 158.72 | 209 | 206 | 44.1 |
| B | 5 | 172 | 61912 | 1478.72 | 209 | 205 | 41.7 |
| B | 4 | 232 | 20075 | 476.15 | 209 | 205 | 41.7 |
| B | 0 | 229 | 13881 | 327.72 | 209 | 205 | 41.7 |
| C | 15 | 214 | 72701 | 1517.47 | 200 | 201 | 47.8 |
| C | 15 | 208 | 62263 | 1299.0 | 200 | 201 | 47.8 |
| C | 0 | 10 | 57970 | 1209.14 | 200 | 201 | 47.8 |
| D | 7 | 223 | 1440236 | 29555.57 | 175 | 171 | 48.7 |
| D | 8 | 195 | 278744 | 5717.37 | 175 | 171 | 48.7 |
| D | 2 | 249 | 54164 | 1108.14 | 175 | 171 | 48.7 |
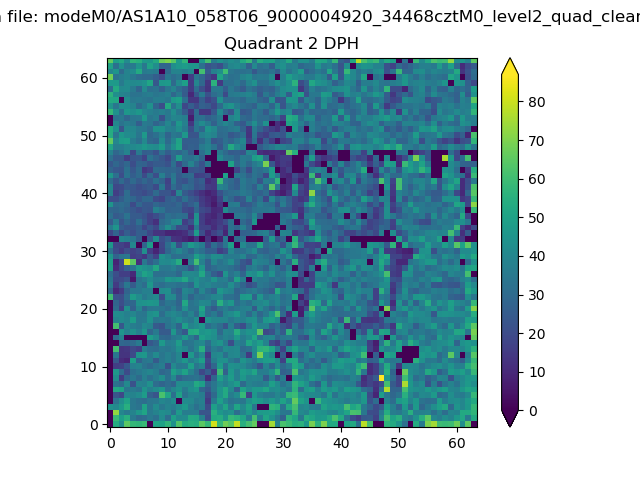
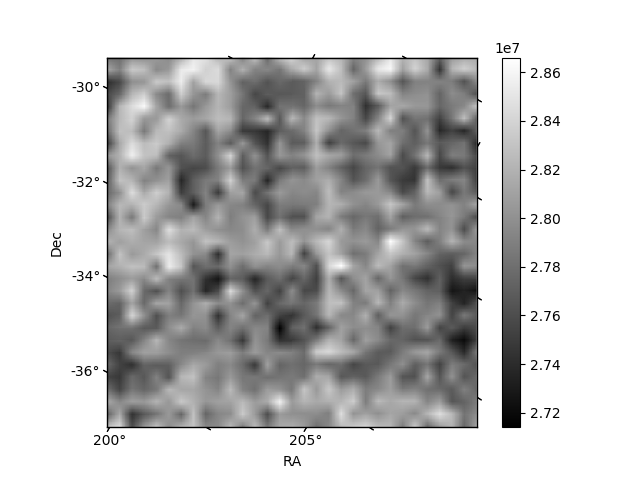
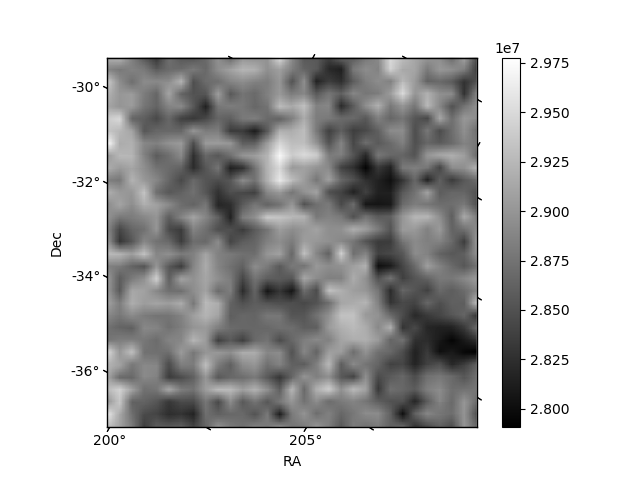
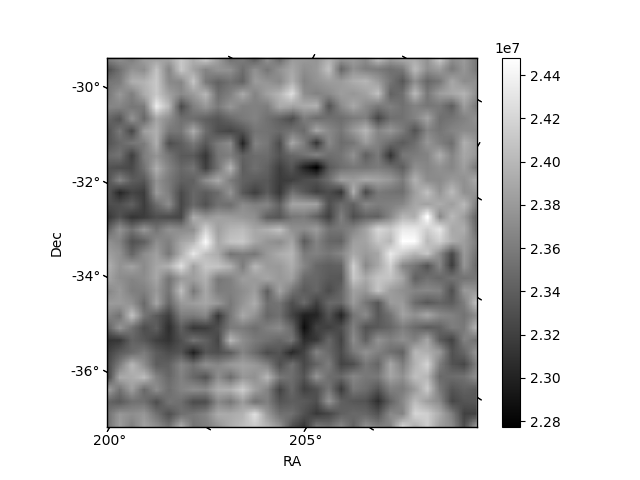
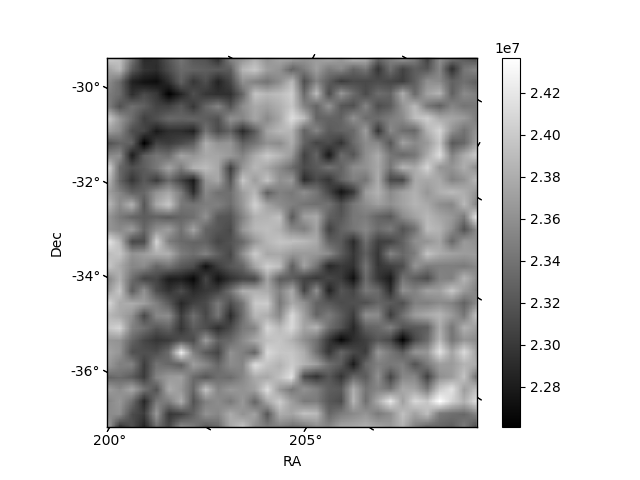
Histogram calculated using DETX and DETY for each event in the final _common_clean file
| Quadrant A | 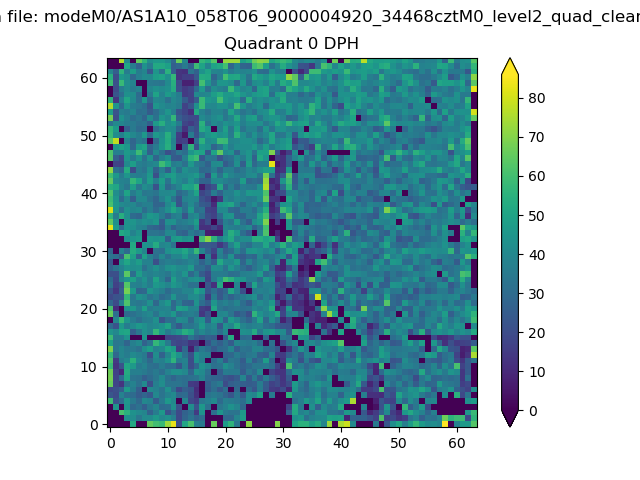 |
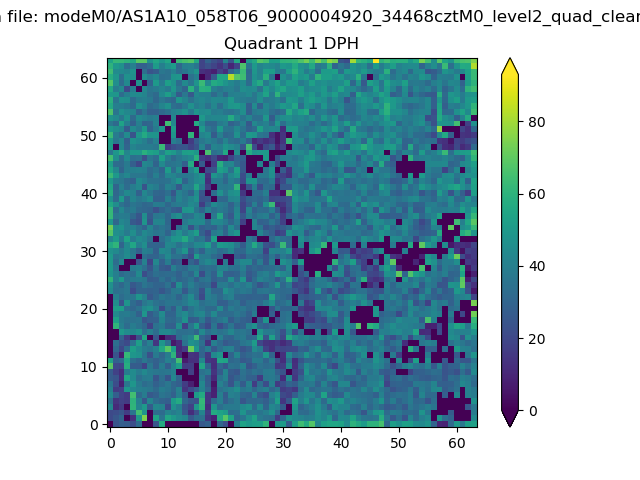 |
Quadrant B |
|---|---|---|---|
| Quadrant D | 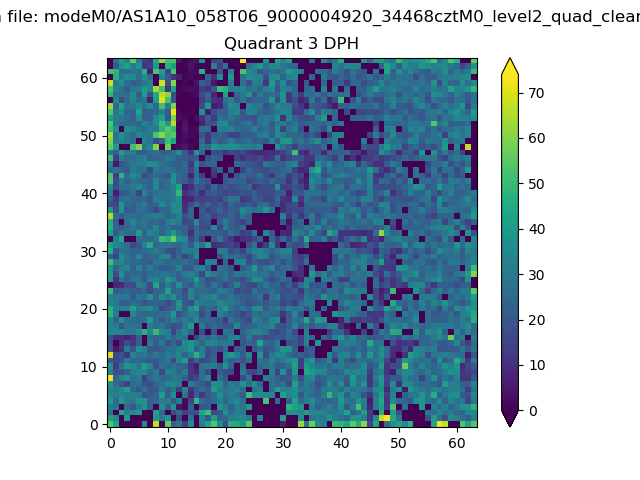 |
 |
Quadrant C |
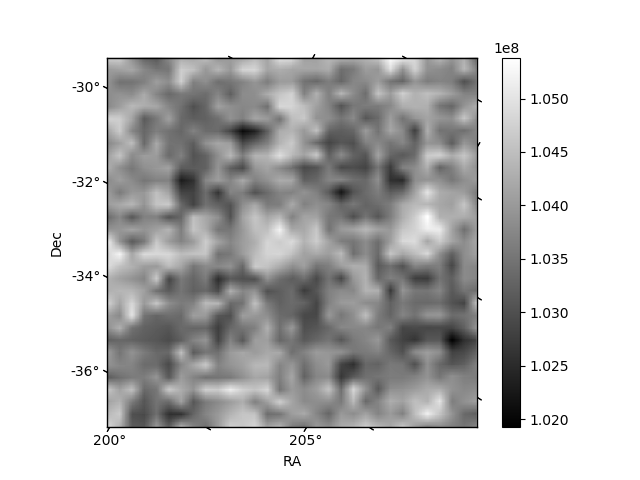
| Plot type | Count rate plots | Images |
|---|---|---|
| Comparison with Poisson distribution Blue bars denote a histogram of data divided into 1 sec bins. Red curve is a Poisson curve with rate = median count rate of data. |
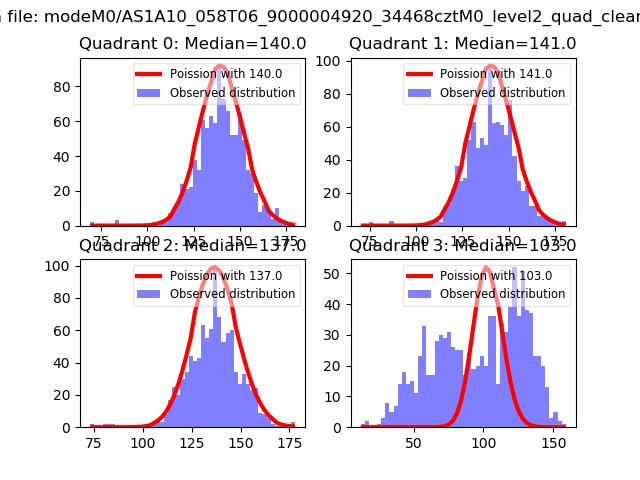 |
 |
| Quadrant-wise count rates Data is divided into 100 sec bins |
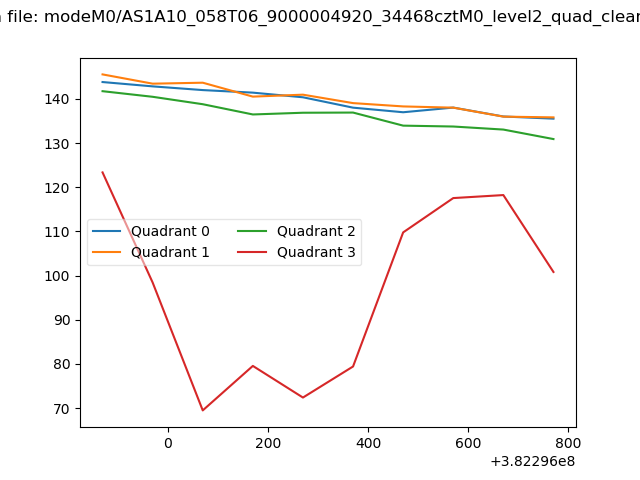 |
|
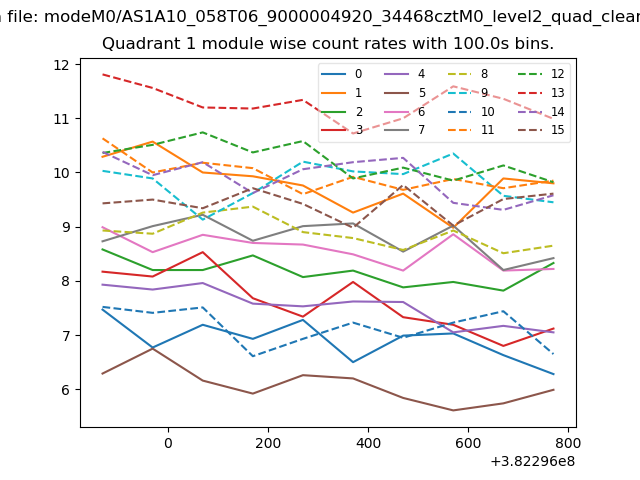
| Module-wise count rates for Quadrant A Data is divided into 100 sec bins |
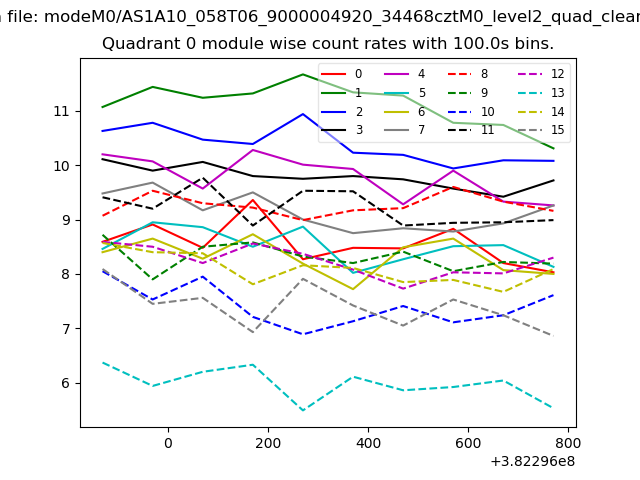 |
 |
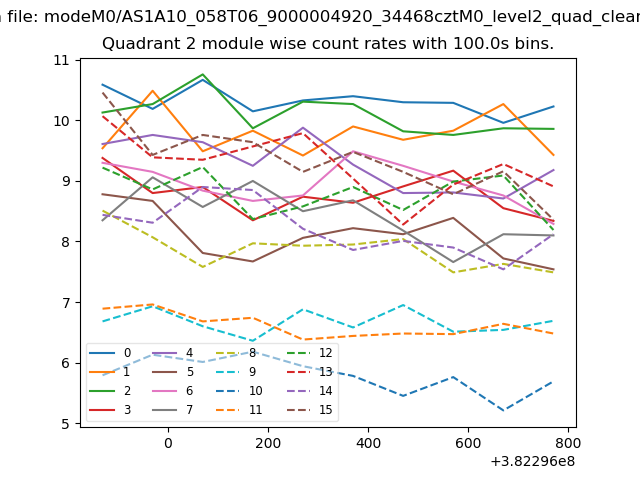
| Module-wise count rates for Quadrant B Data is divided into 100 sec bins |
 |
 |
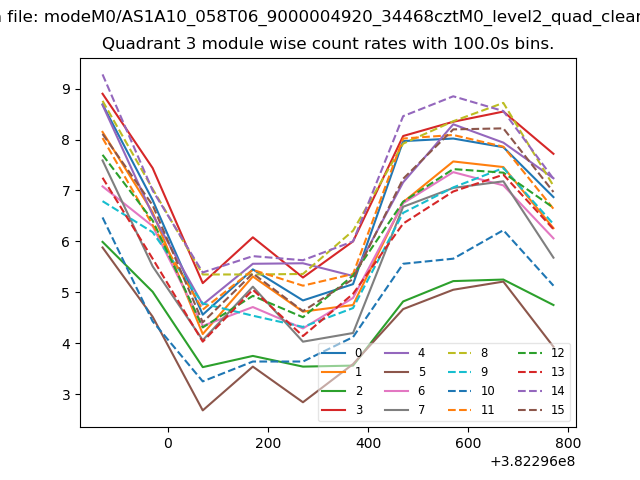
| Module-wise count rates for Quadrant C Data is divided into 100 sec bins |
 |
 |
| Module-wise count rates for Quadrant D Data is divided into 100 sec bins |
 |
 |
| Parameter | Plot |
|---|---|
| CZT HV Monitor | 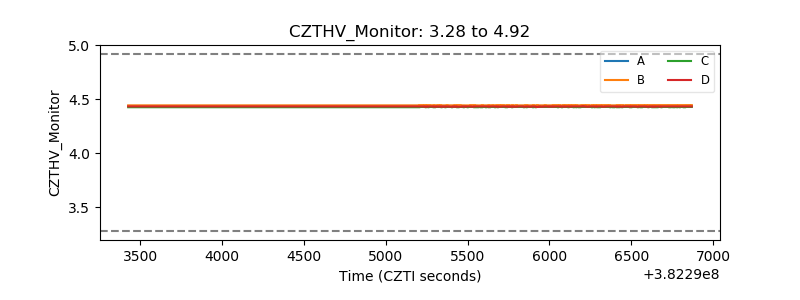 |
| D_VDD | 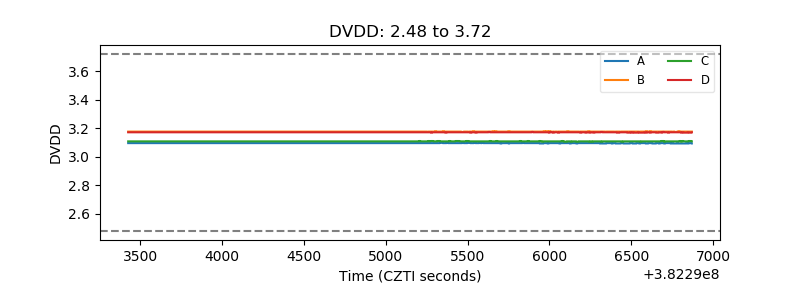 |
| Temperature 1 | 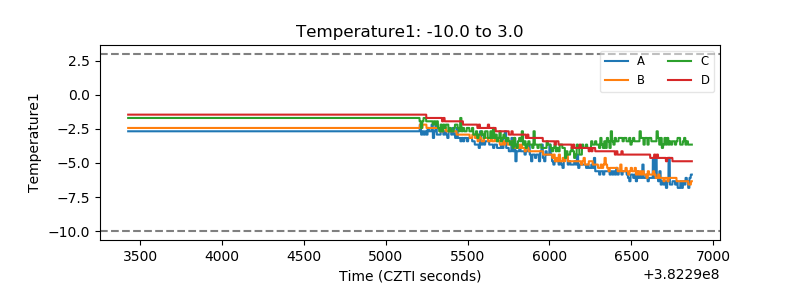 |
| Veto HV Monitor |  |
| Veto LLD | 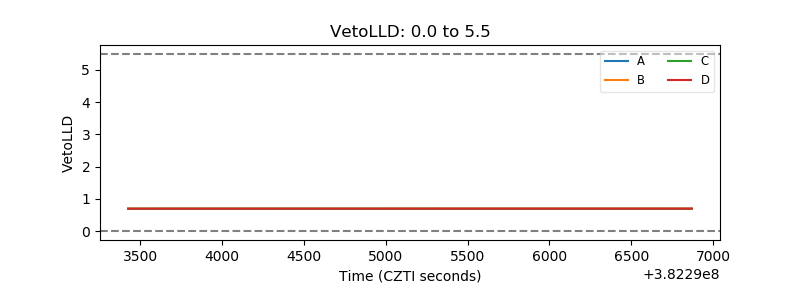 |
| Alpha Counter | 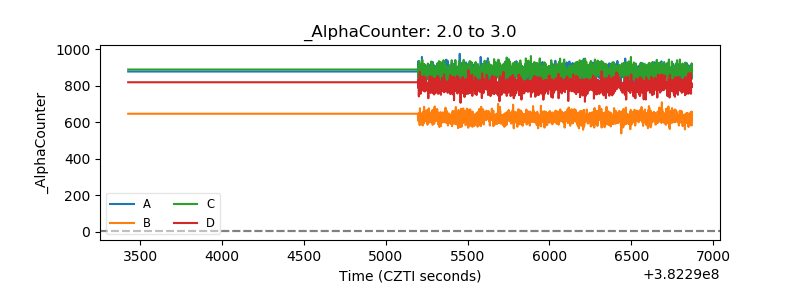 |
| _CPM_Rate | 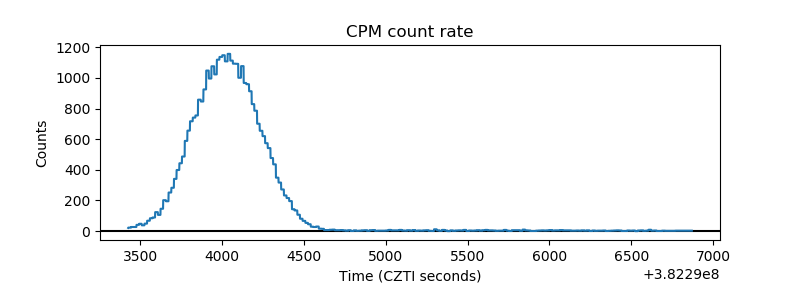 |
| CZT Counter | 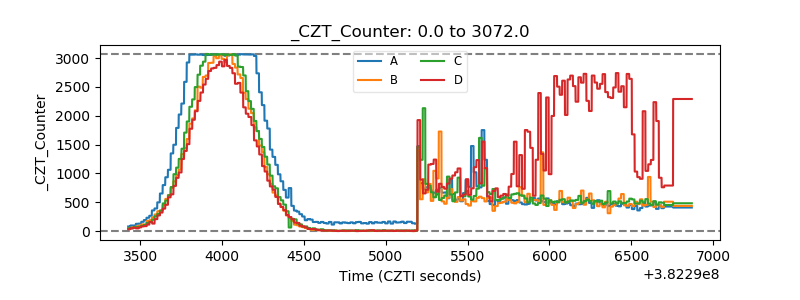 |
| +2.5 Volts monitor | 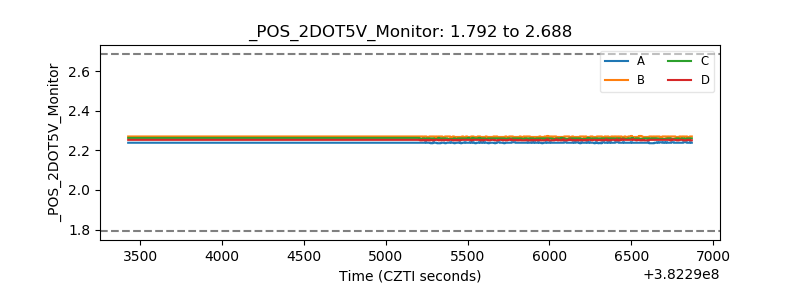 |
| +5 Volts monitor | 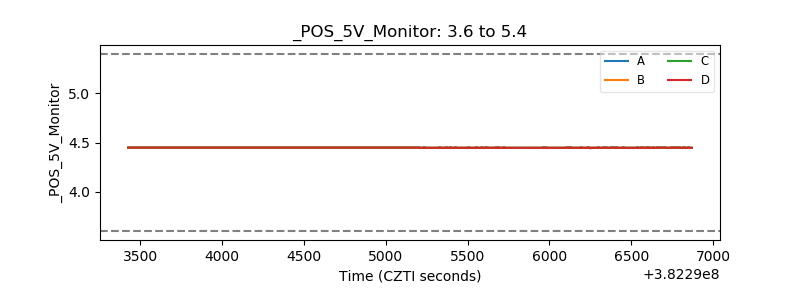 |
| _ROLL_ROT | 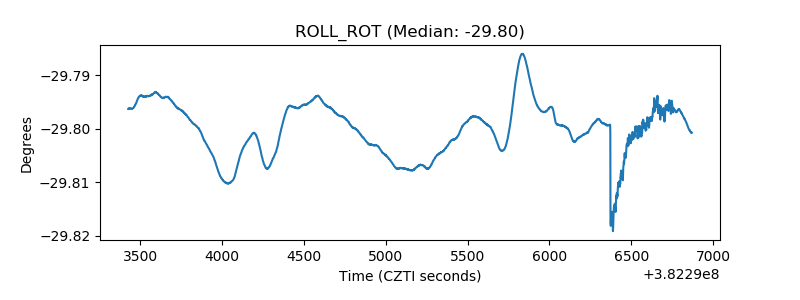 |
| _Roll_DEC | 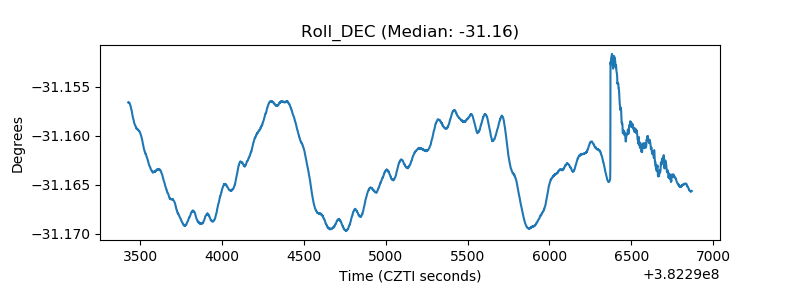 |
| _Roll_RA | 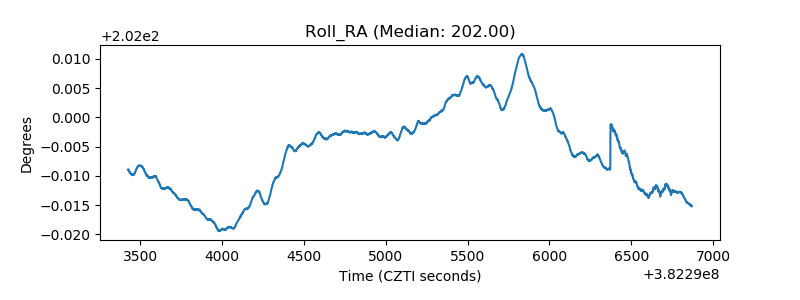 |
| Veto Counter | 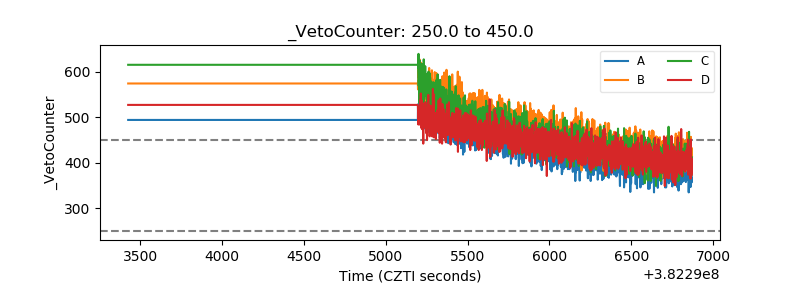 |