| Param | Original file | Final file |
|---|---|---|
| Filename | modeM0/AS1A10_058T06_9000004920_34466cztM0_level2.evt | modeM0/AS1A10_058T06_9000004920_34466cztM0_level2_quad_clean.evt |
| Size (bytes) | 534,464,640 | 62,046,720 |
| Size | 509.7 MB | 59.2 MB |
| Events in quadrant A | 2,876,199 | 393,204 |
| Events in quadrant B | 3,070,988 | 394,285 |
| Events in quadrant C | 4,130,564 | 373,403 |
| Events in quadrant D | 5,756,302 | 352,721 |
| Mode SS | |||
|---|---|---|---|
| Quadrant | BADHDUFLAG | Total packets | Discarded packets |
| A | 0 | 104 | 0 |
| B | 0 | 104 | 0 |
| C | 0 | 104 | 0 |
| D | 0 | 104 | 0 |
| Mode M0 | |||
|---|---|---|---|
| Quadrant | BADHDUFLAG | Total packets | Discarded packets |
| A | 0 | 11681 | 3 |
| B | 0 | 12252 | 2 |
| C | 0 | 15744 | 2 |
| D | 0 | 20960 | 2 |
| Mode M9 | |||
|---|---|---|---|
| Quadrant | BADHDUFLAG | Total packets | Discarded packets |
| A | 0 | 22 | 0 |
| B | 0 | 22 | 0 |
| C | 0 | 22 | 0 |
| D | 0 | 23 | 0 |
| Quadrant | Total seconds | Saturated seconds | Saturation percentage |
|---|---|---|---|
| A | 5217 | 36 | 0.690052% |
| B | 5217 | 106 | 2.031819% |
| C | 5217 | 433 | 8.299789% |
| D | 5217 | 185 | 3.546099% |
Noise dominated data is calculated using 1-second bins in cleaned event files. If a bin has >2000 counts, and if more than 50% of those come from <1% of pixels, then it is considered to be noise-dominated and hence unusable.
| Quadrant | # 1 sec bins | Bins with >0 counts | Bins with >2000 counts | High rate bins dominated by noise | Noise dominated (total time) | Noise dominated (detector-on time) | Marked lightcurve |
|---|---|---|---|---|---|---|---|
| A | 7340 | 5218 | 25 | 25 | 0.34% | 0.48% | 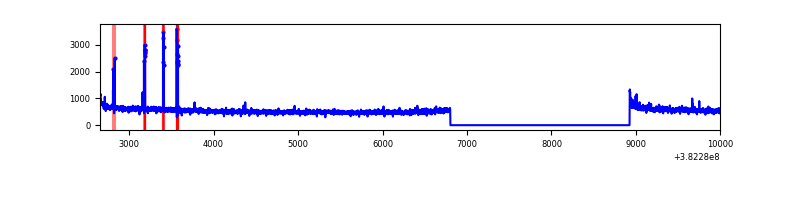 |
| B | 7340 | 5218 | 64 | 64 | 0.87% | 1.23% | 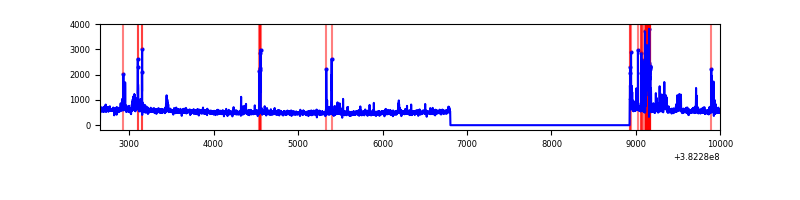 |
| C | 7340 | 5218 | 366 | 366 | 4.99% | 7.01% | 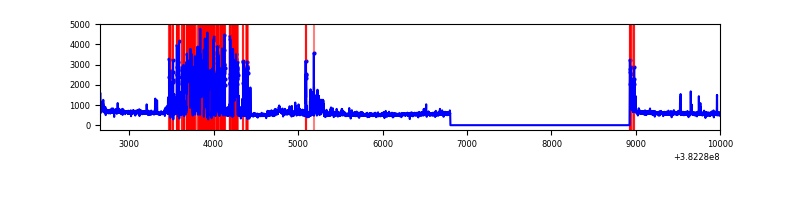 |
| D | 7340 | 5218 | 159 | 159 | 2.17% | 3.05% | 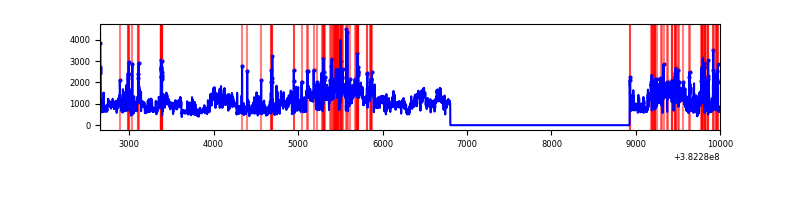 |
Top three noisy pixels from each quadrant. If the there are fewer than three noisy pixels in the level2.evt file, extra rows are filled as -1
| Pixel properties | Quadrant properties | ||||||
|---|---|---|---|---|---|---|---|
| Quadrant | DetID | PixID | Counts | Sigma | Mean | Median | Sigma |
| A | 15 | 169 | 51159 | 361.35 | 705 | 695 | 139.7 |
| A | 10 | 83 | 38091 | 267.77 | 705 | 695 | 139.7 |
| A | 13 | 6 | 27784 | 193.97 | 705 | 695 | 139.7 |
| B | 5 | 172 | 311491 | 2382.93 | 694 | 678 | 130.4 |
| B | 4 | 232 | 25591 | 191.0 | 694 | 678 | 130.4 |
| B | 12 | 111 | 14874 | 108.84 | 694 | 678 | 130.4 |
| C | 15 | 208 | 1271539 | 8700.17 | 643 | 649 | 146.1 |
| C | 15 | 214 | 210169 | 1434.32 | 643 | 649 | 146.1 |
| C | 14 | 67 | 60461 | 409.46 | 643 | 649 | 146.1 |
| D | 8 | 195 | 1725352 | 10526.49 | 668 | 650 | 163.8 |
| D | 1 | 52 | 796239 | 4855.77 | 668 | 650 | 163.8 |
| D | 2 | 250 | 205957 | 1253.06 | 668 | 650 | 163.8 |
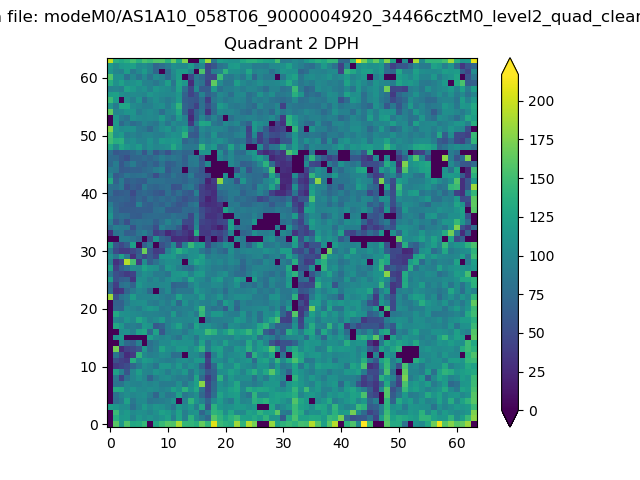
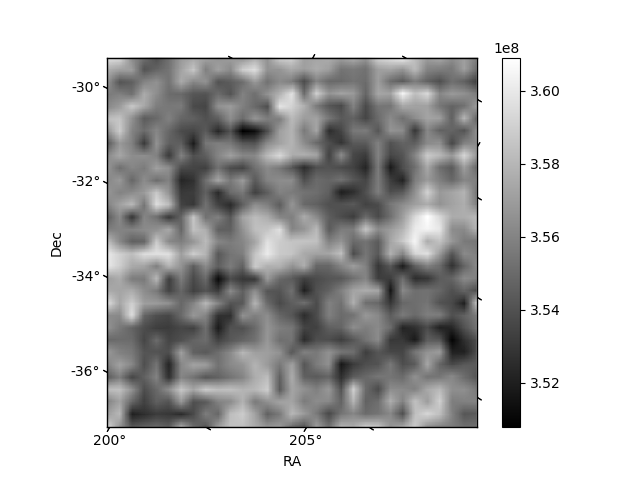
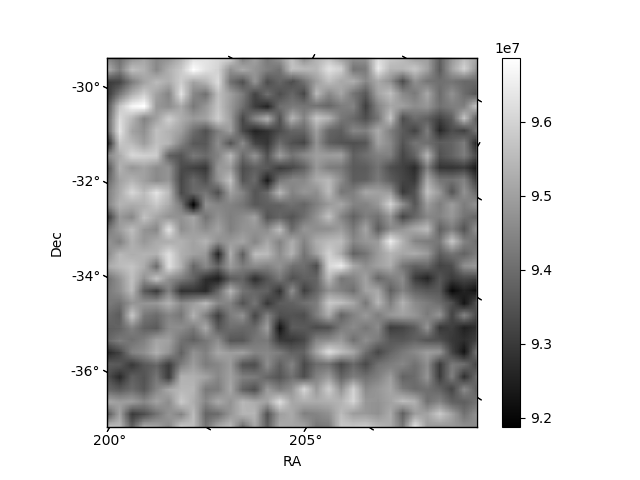
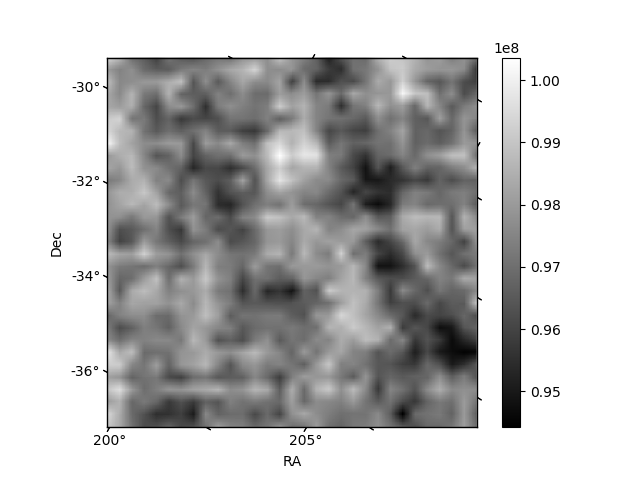
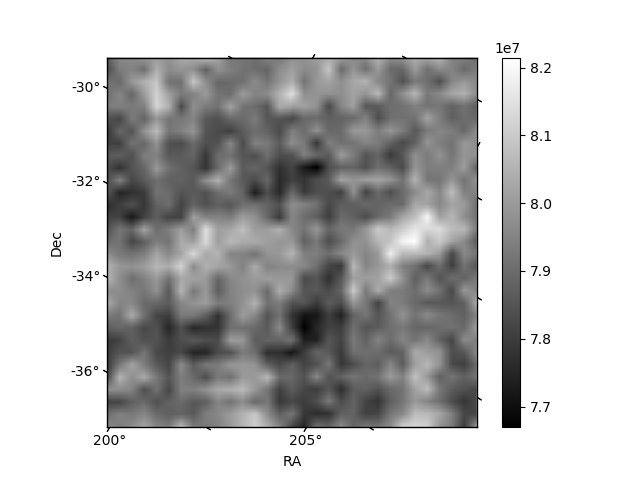
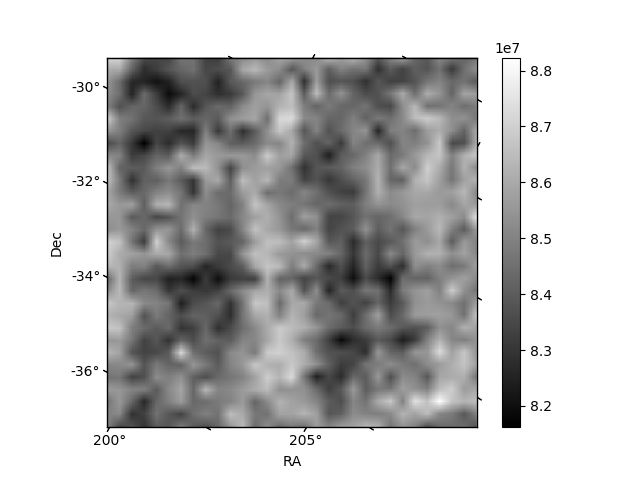
Histogram calculated using DETX and DETY for each event in the final _common_clean file
| Quadrant A | 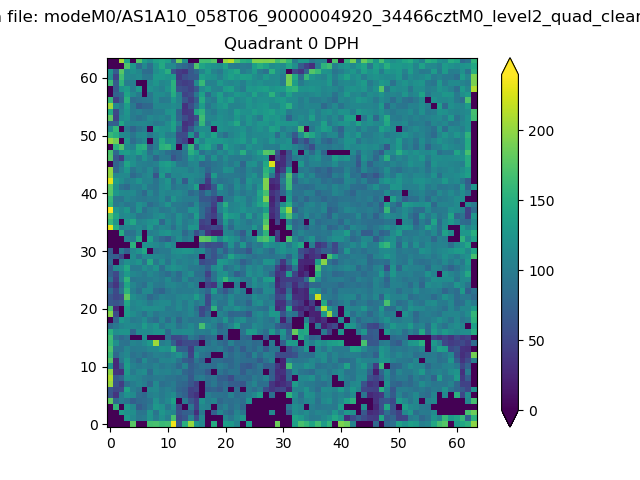 |
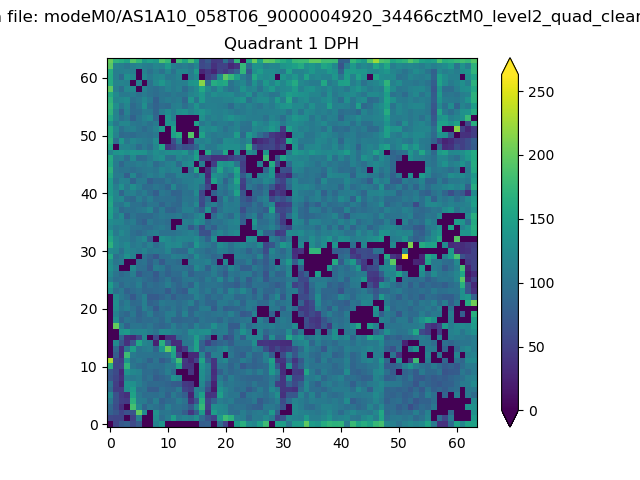 |
Quadrant B |
|---|---|---|---|
| Quadrant D | 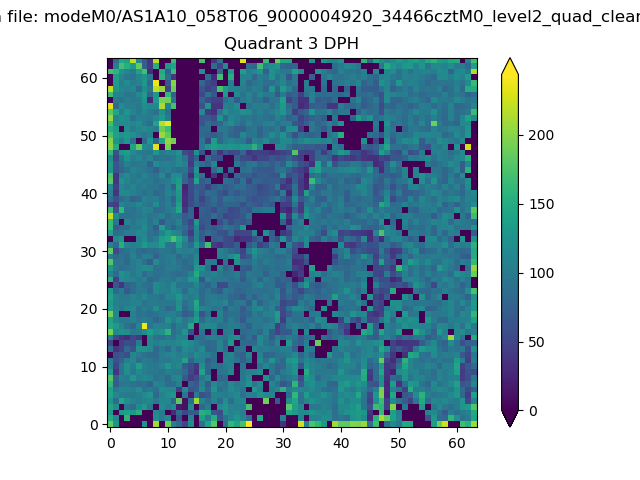 |
 |
Quadrant C |
| Plot type | Count rate plots | Images |
|---|---|---|
| Comparison with Poisson distribution Blue bars denote a histogram of data divided into 1 sec bins. Red curve is a Poisson curve with rate = median count rate of data. |
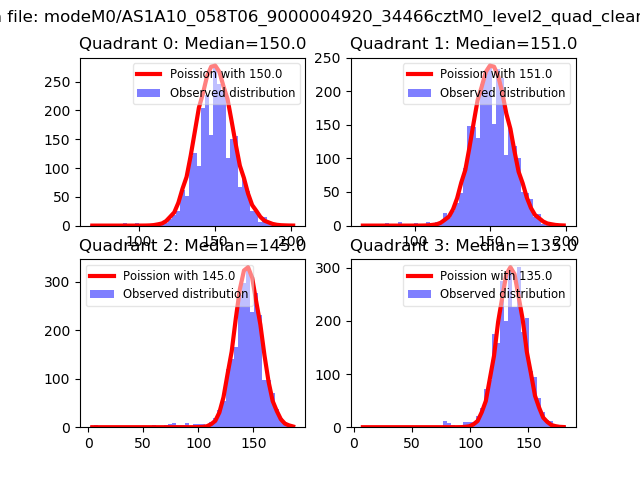 |
 |
| Quadrant-wise count rates Data is divided into 100 sec bins |
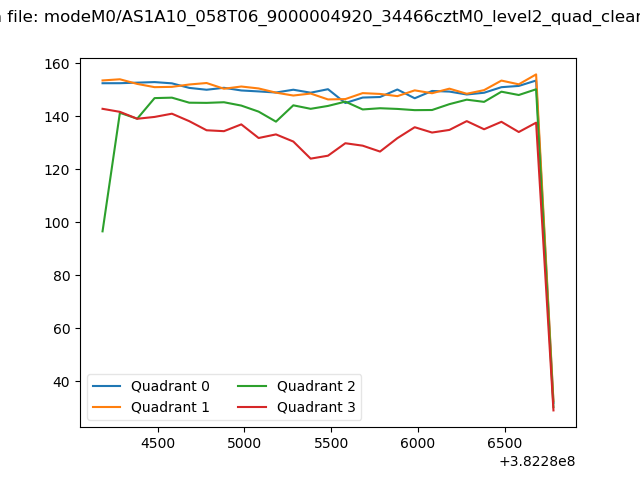 |
|
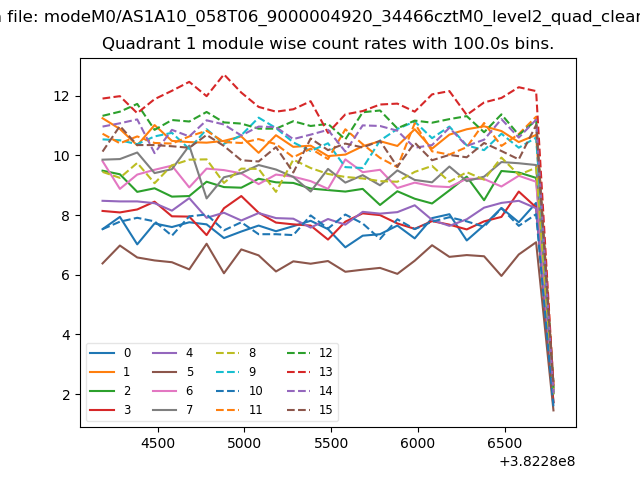
| Module-wise count rates for Quadrant A Data is divided into 100 sec bins |
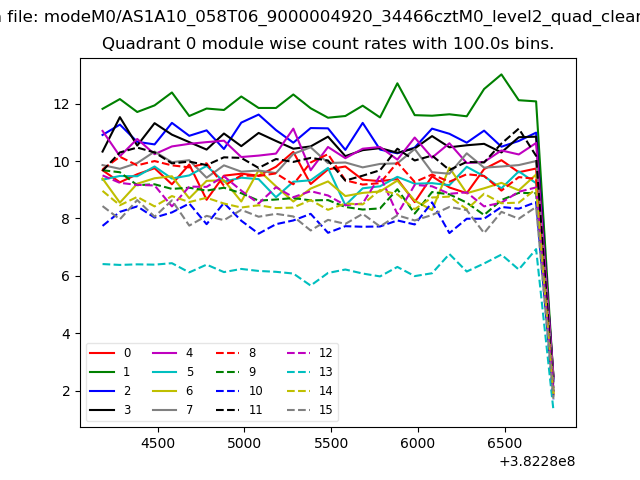 |
 |
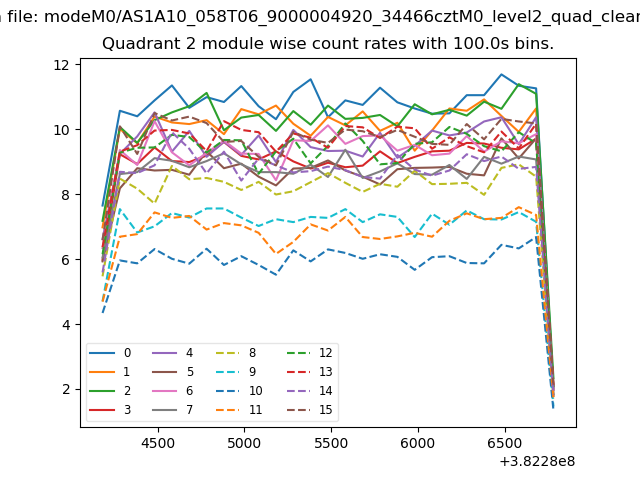
| Module-wise count rates for Quadrant B Data is divided into 100 sec bins |
 |
 |
| Module-wise count rates for Quadrant C Data is divided into 100 sec bins |
 |
 |
| Module-wise count rates for Quadrant D Data is divided into 100 sec bins |
 |
 |
| Parameter | Plot |
|---|---|
| CZT HV Monitor | 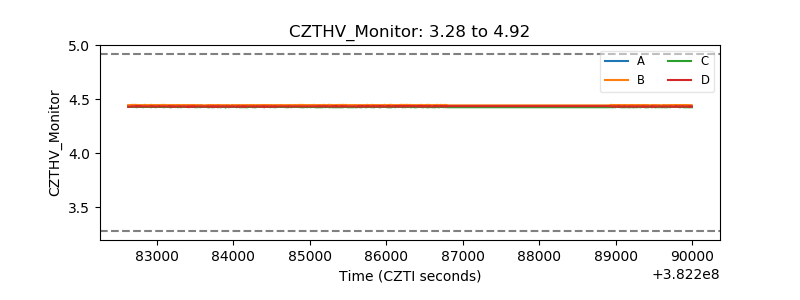 |
| D_VDD | 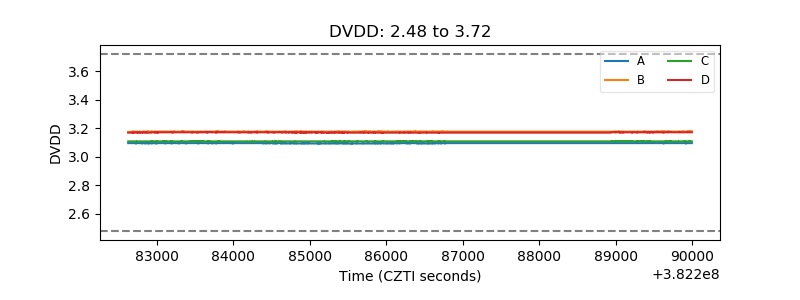 |
| Temperature 1 | 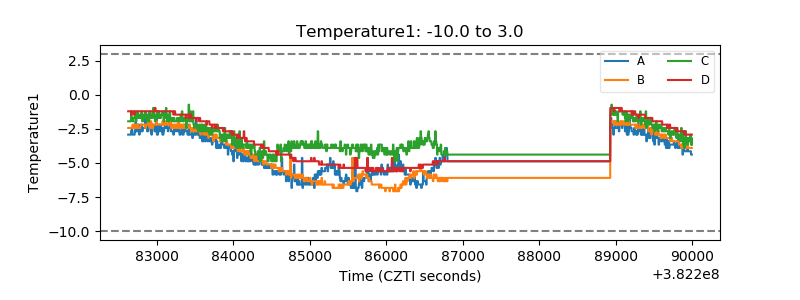 |
| Veto HV Monitor | 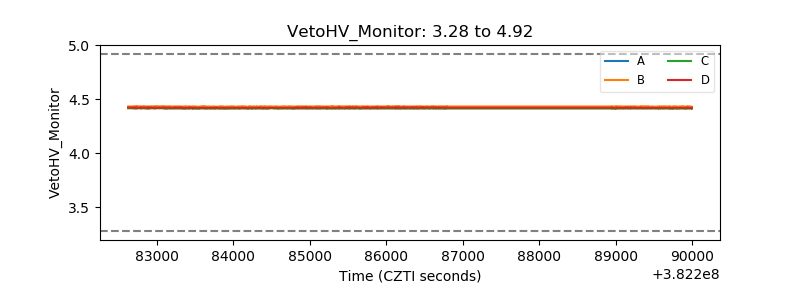 |
| Veto LLD | 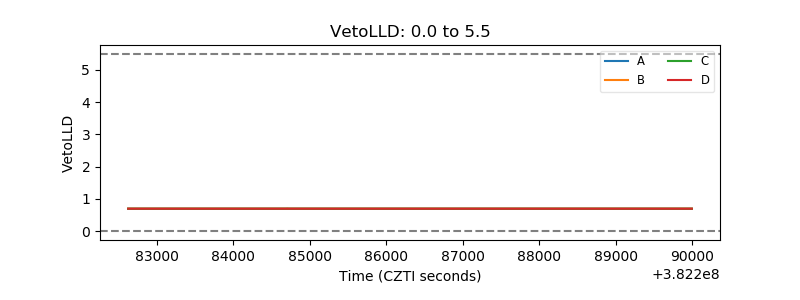 |
| Alpha Counter | 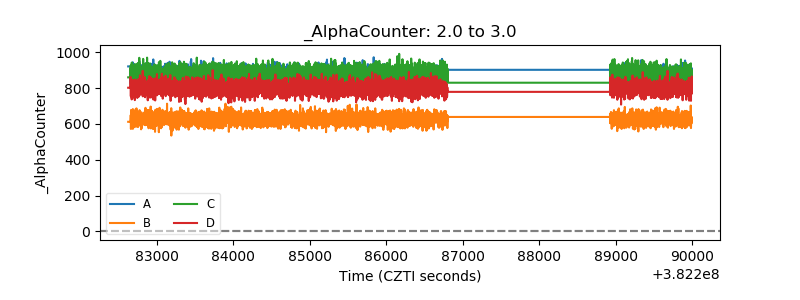 |
| _CPM_Rate | 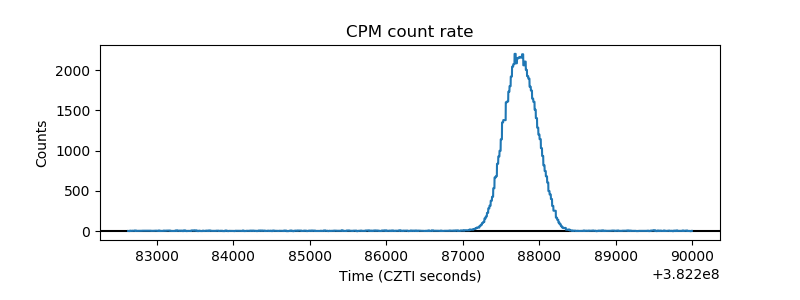 |
| CZT Counter | 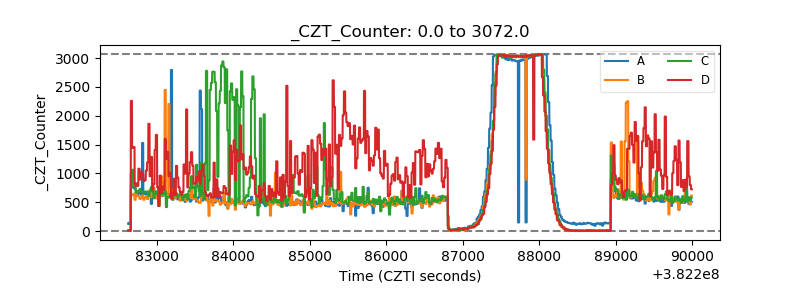 |
| +2.5 Volts monitor | 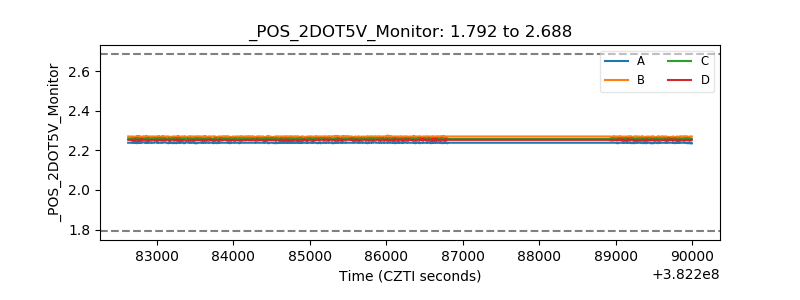 |
| +5 Volts monitor |  |
| _ROLL_ROT | 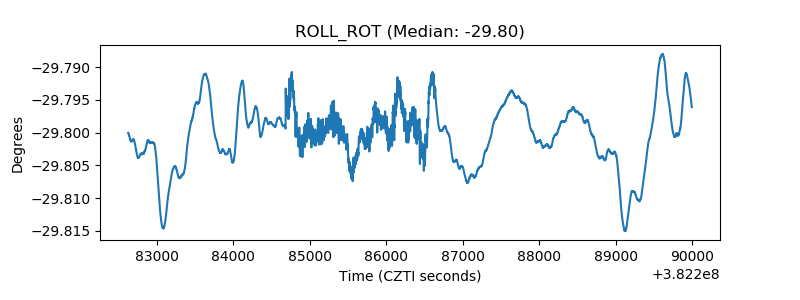 |
| _Roll_DEC | 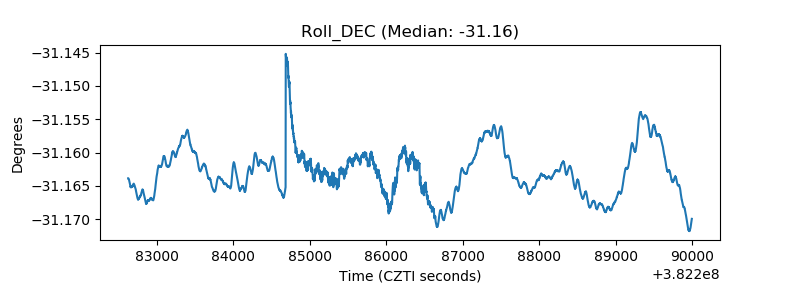 |
| _Roll_RA | 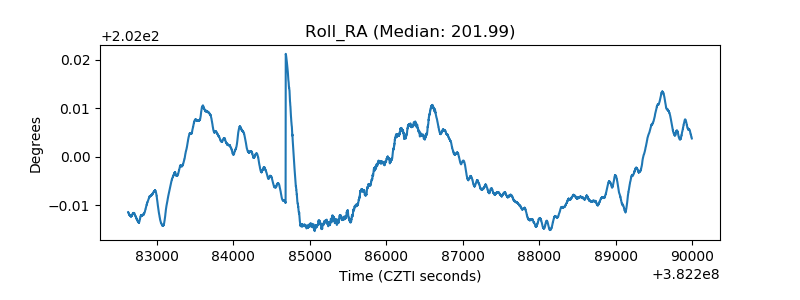 |
| Veto Counter | 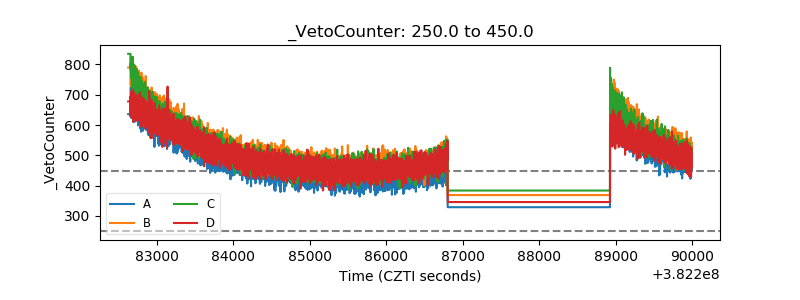 |