| Param | Original file | Final file |
|---|---|---|
| Filename | modeM0/AS1A10_058T06_9000004920_34464cztM0_level2.evt | modeM0/AS1A10_058T06_9000004920_34464cztM0_level2_quad_clean.evt |
| Size (bytes) | 1,346,313,600 | 139,527,360 |
| Size | 1.3 GB | 133.1 MB |
| Events in quadrant A | 7,499,580 | 843,403 |
| Events in quadrant B | 8,045,288 | 849,576 |
| Events in quadrant C | 8,022,653 | 834,756 |
| Events in quadrant D | 16,261,617 | 729,234 |
| Mode SS | |||
|---|---|---|---|
| Quadrant | BADHDUFLAG | Total packets | Discarded packets |
| A | 0 | 288 | 0 |
| B | 0 | 288 | 0 |
| C | 0 | 288 | 0 |
| D | 0 | 288 | 0 |
| Mode M0 | |||
|---|---|---|---|
| Quadrant | BADHDUFLAG | Total packets | Discarded packets |
| A | 0 | 30799 | 4 |
| B | 0 | 32472 | 3 |
| C | 0 | 31947 | 3 |
| D | 0 | 58070 | 3 |
| Mode M9 | |||
|---|---|---|---|
| Quadrant | BADHDUFLAG | Total packets | Discarded packets |
| A | 0 | 54 | 0 |
| B | 0 | 54 | 0 |
| C | 0 | 54 | 0 |
| D | 0 | 54 | 0 |
| Quadrant | Total seconds | Saturated seconds | Saturation percentage |
|---|---|---|---|
| A | 14017 | 182 | 1.298423% |
| B | 14017 | 173 | 1.234216% |
| C | 14017 | 110 | 0.784761% |
| D | 14017 | 2286 | 16.308768% |
Noise dominated data is calculated using 1-second bins in cleaned event files. If a bin has >2000 counts, and if more than 50% of those come from <1% of pixels, then it is considered to be noise-dominated and hence unusable.
| Quadrant | # 1 sec bins | Bins with >0 counts | Bins with >2000 counts | High rate bins dominated by noise | Noise dominated (total time) | Noise dominated (detector-on time) | Marked lightcurve |
|---|---|---|---|---|---|---|---|
| A | 19486 | 14020 | 127 | 127 | 0.65% | 0.91% | 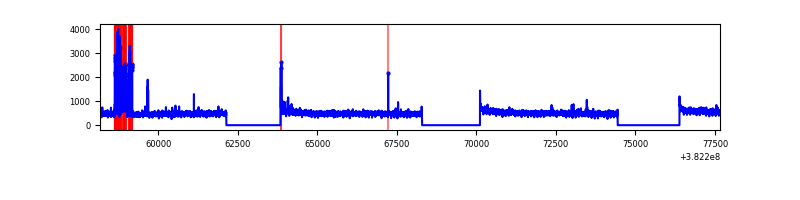 |
| B | 19486 | 14020 | 102 | 102 | 0.52% | 0.73% | 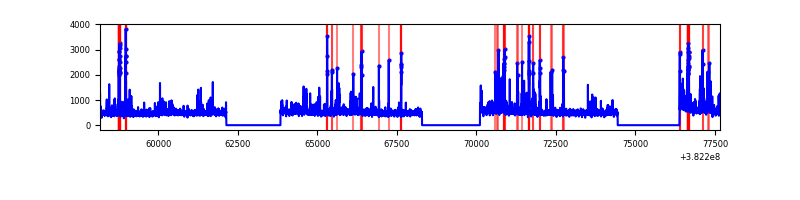 |
| C | 19486 | 14020 | 86 | 86 | 0.44% | 0.61% | 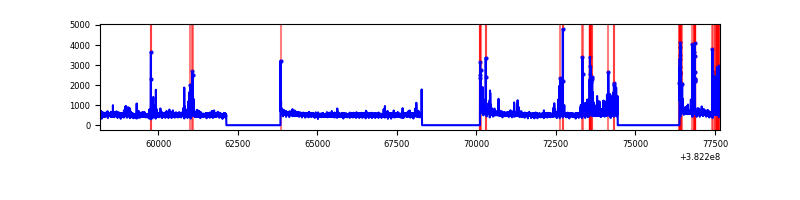 |
| D | 19486 | 14020 | 2143 | 2143 | 11.00% | 15.29% | 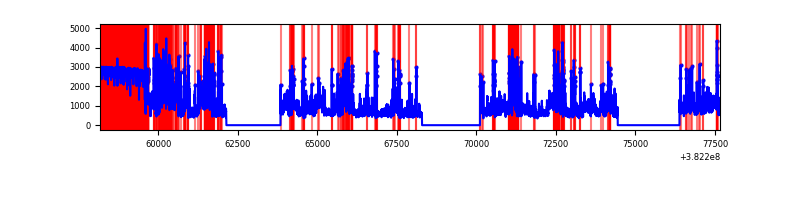 |
Top three noisy pixels from each quadrant. If the there are fewer than three noisy pixels in the level2.evt file, extra rows are filled as -1
| Pixel properties | Quadrant properties | ||||||
|---|---|---|---|---|---|---|---|
| Quadrant | DetID | PixID | Counts | Sigma | Mean | Median | Sigma |
| A | 15 | 169 | 599920 | 1726.98 | 1751 | 1720 | 346.4 |
| A | 10 | 83 | 64650 | 181.68 | 1751 | 1720 | 346.4 |
| A | 13 | 6 | 61734 | 173.26 | 1751 | 1720 | 346.4 |
| B | 5 | 172 | 579194 | 1774.12 | 1732 | 1690 | 325.5 |
| B | 0 | 229 | 257588 | 786.13 | 1732 | 1690 | 325.5 |
| B | 5 | 31 | 151311 | 459.64 | 1732 | 1690 | 325.5 |
| C | 15 | 208 | 598323 | 1533.44 | 1701 | 1718 | 389.1 |
| C | 15 | 214 | 577170 | 1479.07 | 1701 | 1718 | 389.1 |
| C | 0 | 10 | 97581 | 246.39 | 1701 | 1718 | 389.1 |
| D | 7 | 223 | 4037680 | 10803.81 | 1526 | 1483 | 373.6 |
| D | 8 | 195 | 3326163 | 8899.27 | 1526 | 1483 | 373.6 |
| D | 2 | 250 | 1122521 | 3000.72 | 1526 | 1483 | 373.6 |
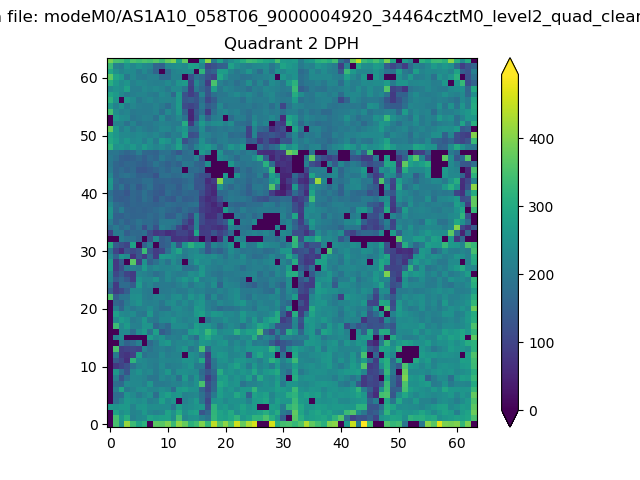
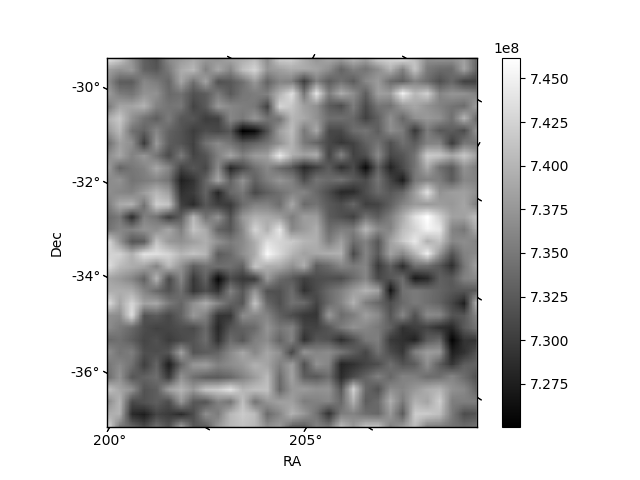
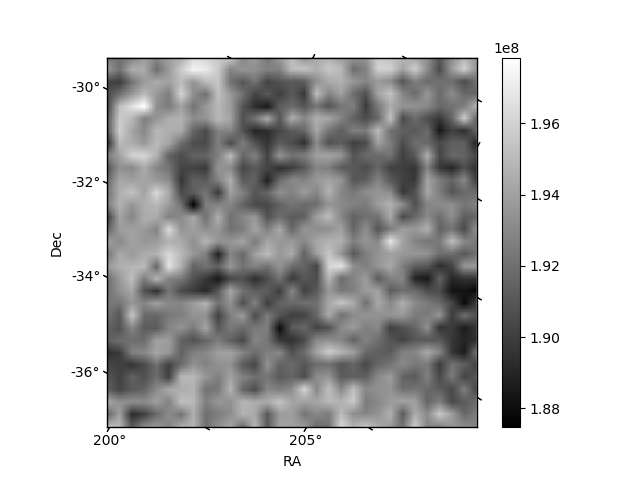
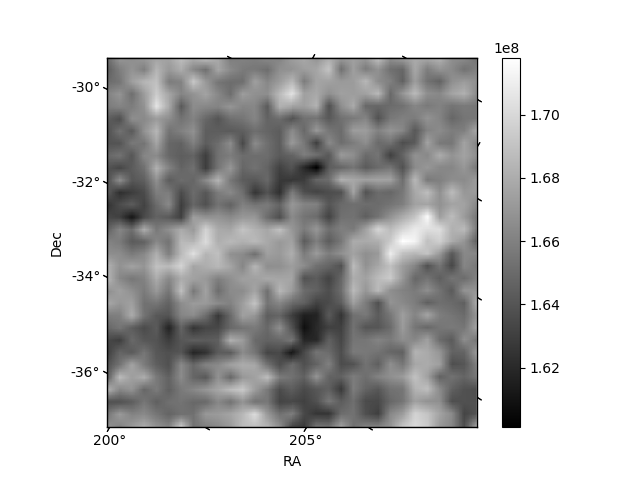
Histogram calculated using DETX and DETY for each event in the final _common_clean file
| Quadrant A | 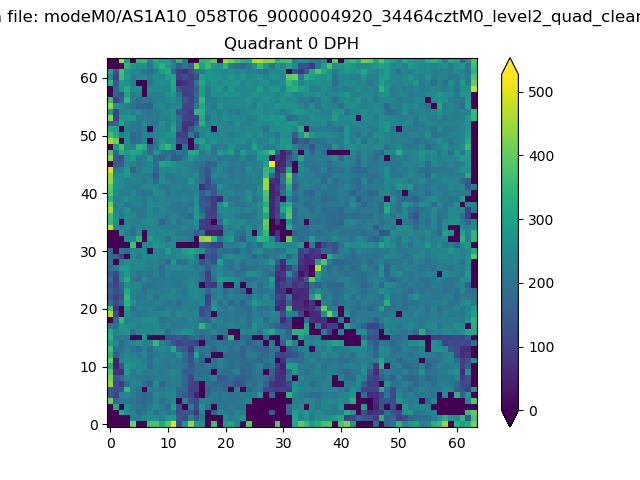 |
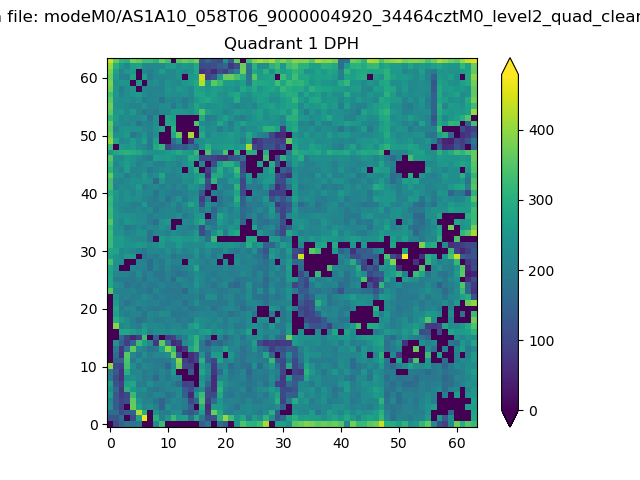 |
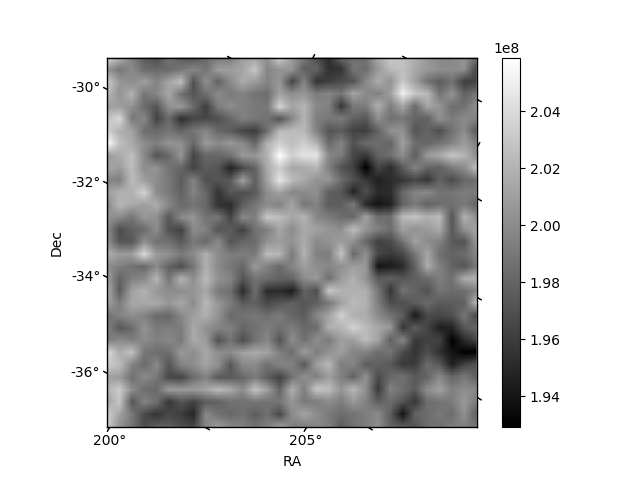
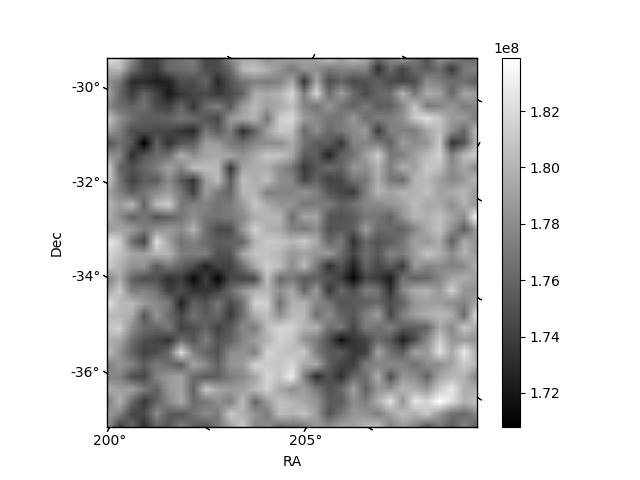
Quadrant B |
|---|---|---|---|
| Quadrant D | 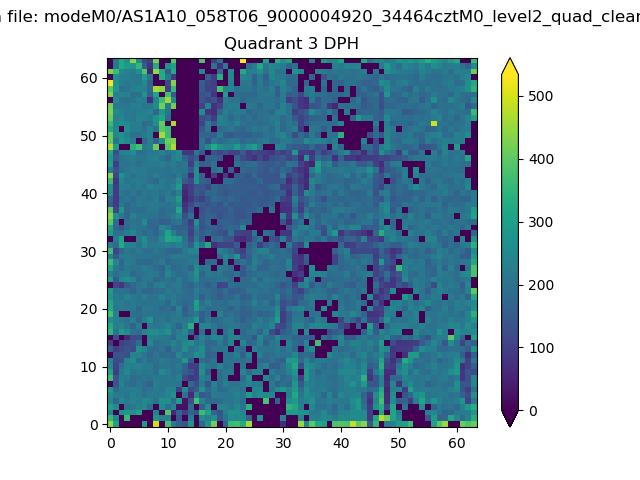 |
 |
Quadrant C |
| Plot type | Count rate plots | Images |
|---|---|---|
| Comparison with Poisson distribution Blue bars denote a histogram of data divided into 1 sec bins. Red curve is a Poisson curve with rate = median count rate of data. |
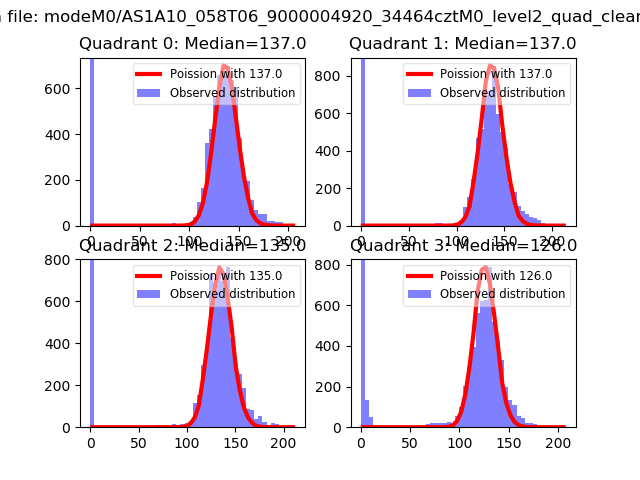 |
 |
| Quadrant-wise count rates Data is divided into 100 sec bins |
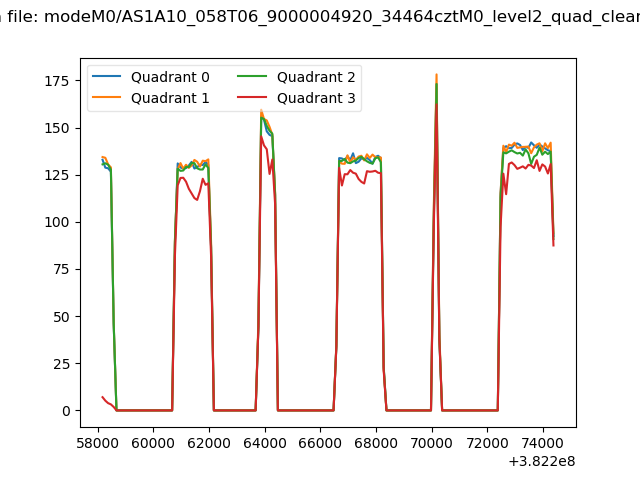 |
|
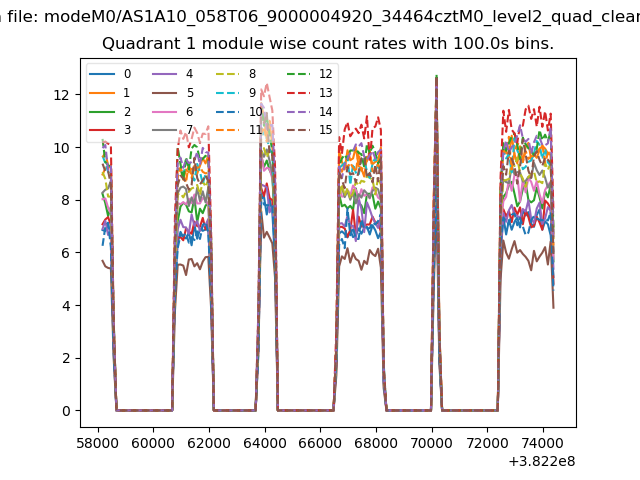
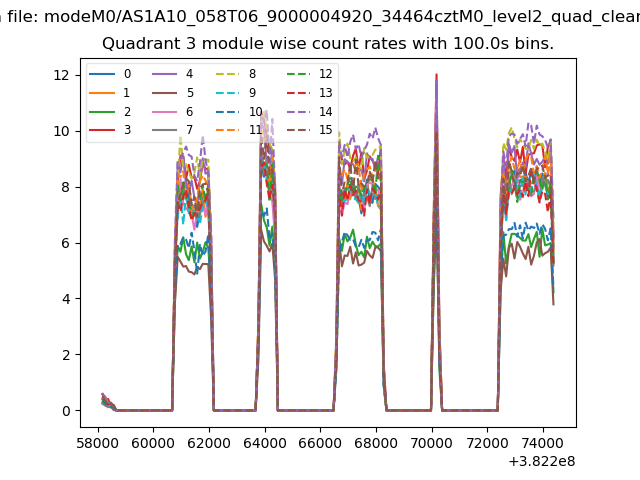
| Module-wise count rates for Quadrant A Data is divided into 100 sec bins |
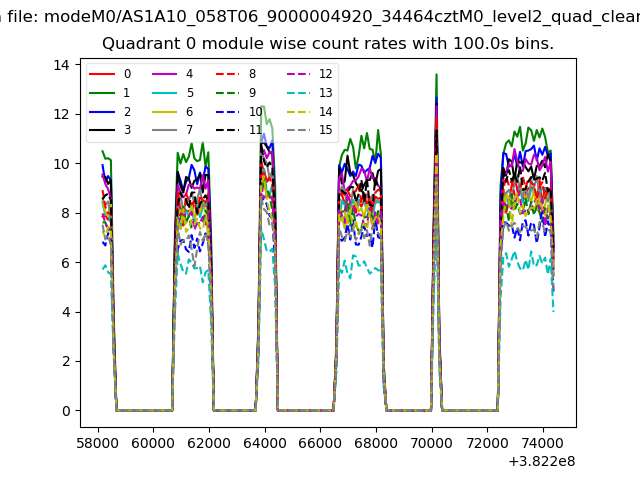 |
 |
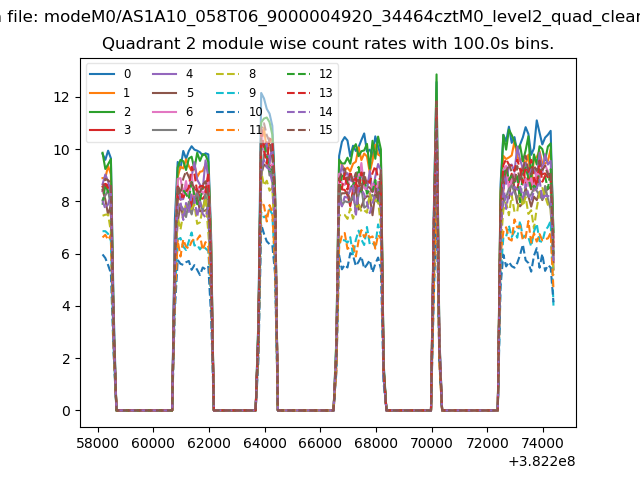
| Module-wise count rates for Quadrant B Data is divided into 100 sec bins |
 |
 |
| Module-wise count rates for Quadrant C Data is divided into 100 sec bins |
 |
 |
| Module-wise count rates for Quadrant D Data is divided into 100 sec bins |
 |
 |
| Parameter | Plot |
|---|---|
| CZT HV Monitor | 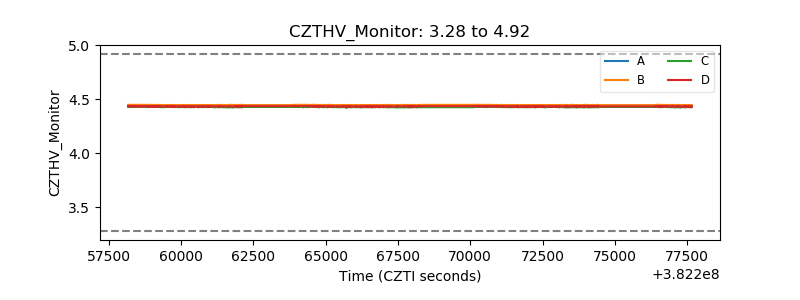 |
| D_VDD | 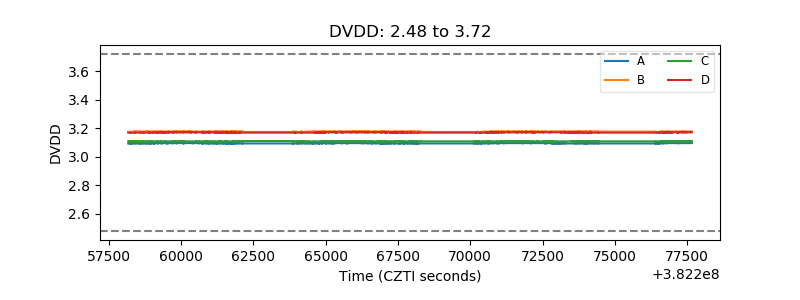 |
| Temperature 1 | 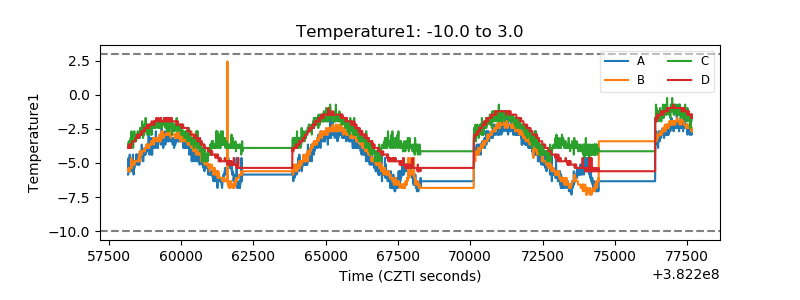 |
| Veto HV Monitor | 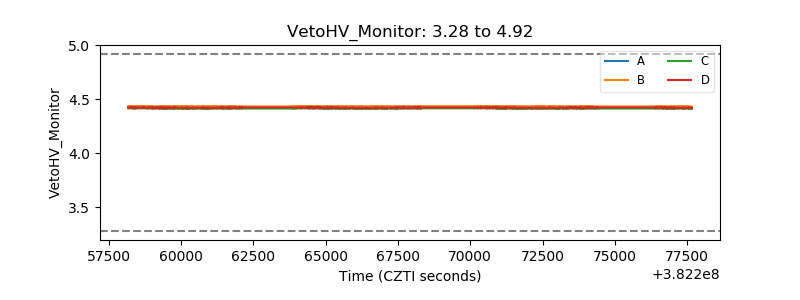 |
| Veto LLD | 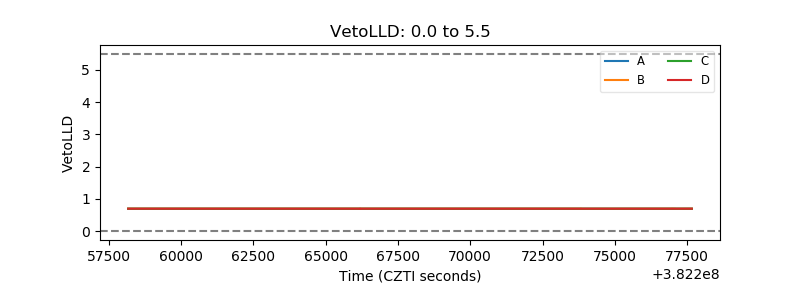 |
| Alpha Counter | 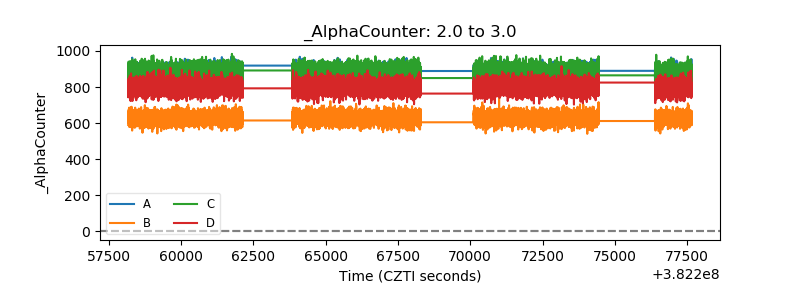 |
| _CPM_Rate | 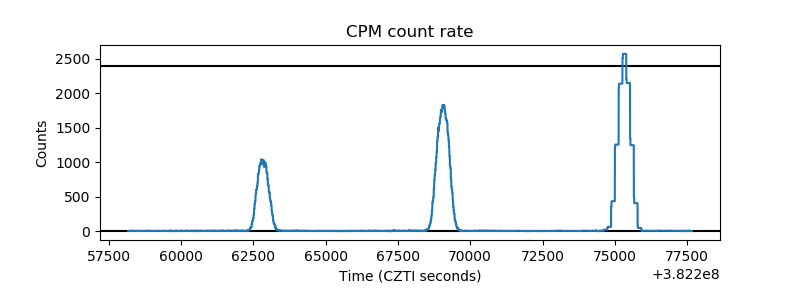 |
| CZT Counter | 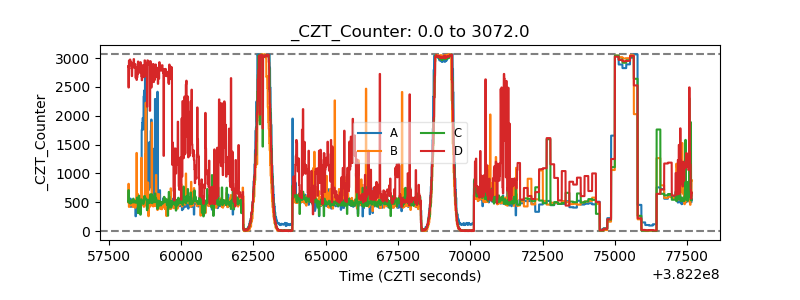 |
| +2.5 Volts monitor | 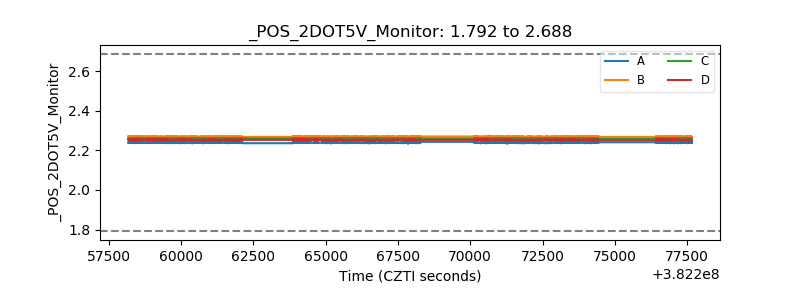 |
| +5 Volts monitor | 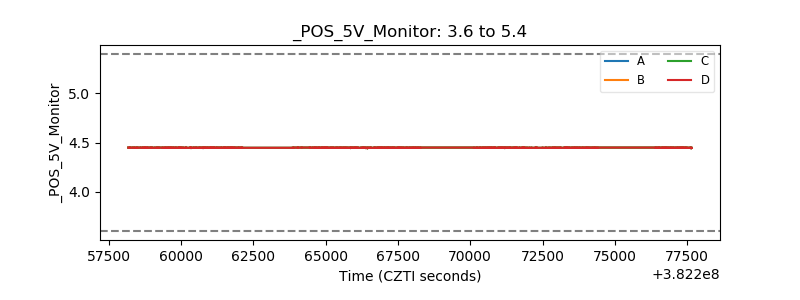 |
| _ROLL_ROT | 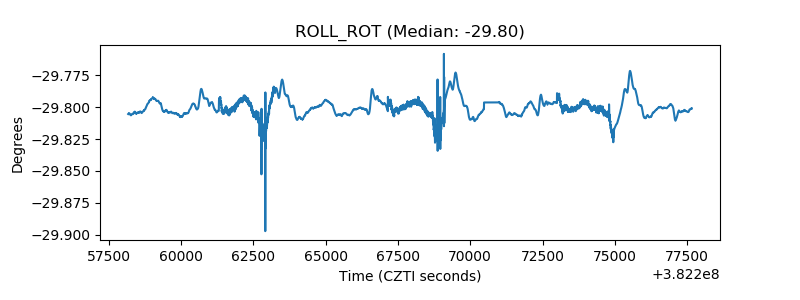 |
| _Roll_DEC | 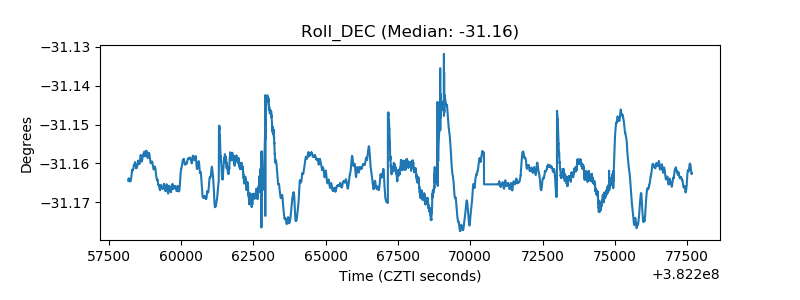 |
| _Roll_RA | 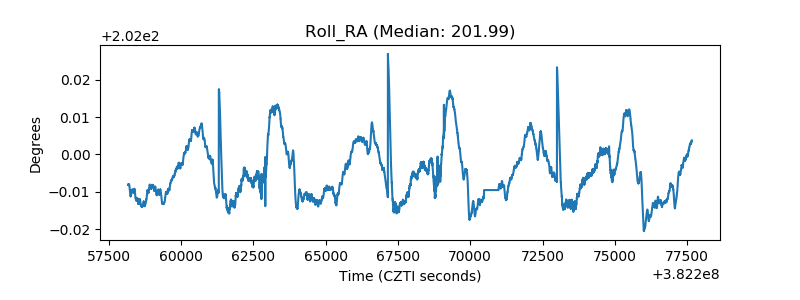 |
| Veto Counter | 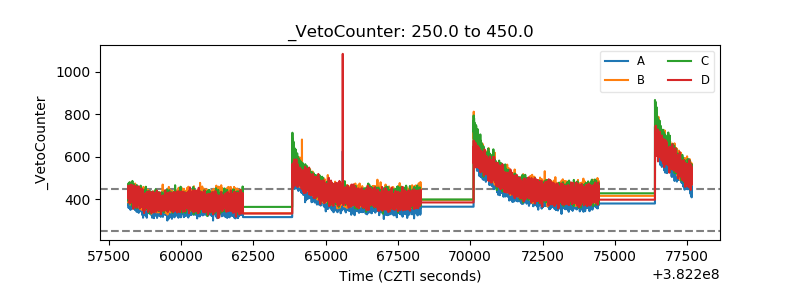 |