| Param | Original file | Final file |
|---|---|---|
| Filename | modeM0/AS1A10_058T06_9000004920_34463cztM0_level2.evt | modeM0/AS1A10_058T06_9000004920_34463cztM0_level2_quad_clean.evt |
| Size (bytes) | 443,534,400 | 56,678,400 |
| Size | 423.0 MB | 54.1 MB |
| Events in quadrant A | 2,684,983 | 341,249 |
| Events in quadrant B | 3,064,707 | 345,811 |
| Events in quadrant C | 2,856,475 | 340,606 |
| Events in quadrant D | 4,468,036 | 318,439 |
| Mode SS | |||
|---|---|---|---|
| Quadrant | BADHDUFLAG | Total packets | Discarded packets |
| A | 0 | 108 | 0 |
| B | 0 | 108 | 0 |
| C | 0 | 108 | 0 |
| D | 0 | 108 | 0 |
| Mode M0 | |||
|---|---|---|---|
| Quadrant | BADHDUFLAG | Total packets | Discarded packets |
| A | 0 | 11225 | 3 |
| B | 0 | 12322 | 2 |
| C | 0 | 11503 | 2 |
| D | 0 | 17065 | 2 |
| Mode M9 | |||
|---|---|---|---|
| Quadrant | BADHDUFLAG | Total packets | Discarded packets |
| A | 0 | 18 | 0 |
| B | 0 | 18 | 0 |
| C | 0 | 18 | 0 |
| D | 0 | 18 | 0 |
| Quadrant | Total seconds | Saturated seconds | Saturation percentage |
|---|---|---|---|
| A | 5279 | 7 | 0.132601% |
| B | 5279 | 55 | 1.041864% |
| C | 5279 | 19 | 0.359917% |
| D | 5280 | 155 | 2.935606% |
Noise dominated data is calculated using 1-second bins in cleaned event files. If a bin has >2000 counts, and if more than 50% of those come from <1% of pixels, then it is considered to be noise-dominated and hence unusable.
| Quadrant | # 1 sec bins | Bins with >0 counts | Bins with >2000 counts | High rate bins dominated by noise | Noise dominated (total time) | Noise dominated (detector-on time) | Marked lightcurve |
|---|---|---|---|---|---|---|---|
| A | 7102 | 5280 | 3 | 3 | 0.04% | 0.06% | 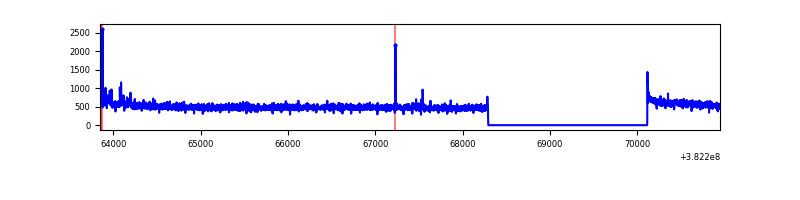 |
| B | 7102 | 5280 | 29 | 29 | 0.41% | 0.55% | 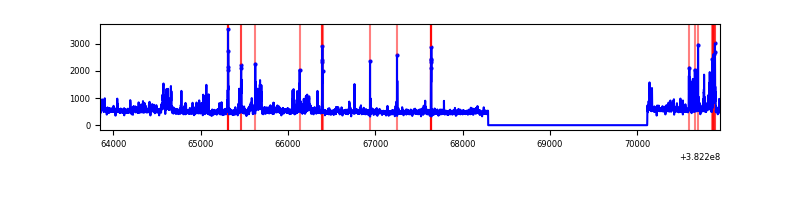 |
| C | 7102 | 5280 | 7 | 7 | 0.10% | 0.13% | 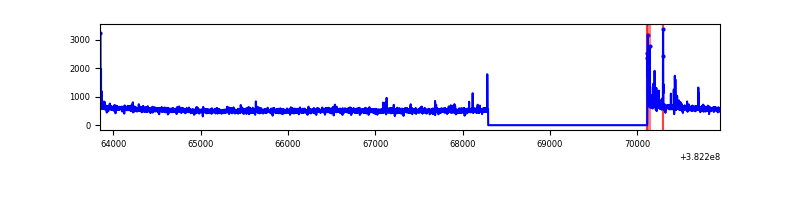 |
| D | 7103 | 5281 | 119 | 119 | 1.68% | 2.25% | 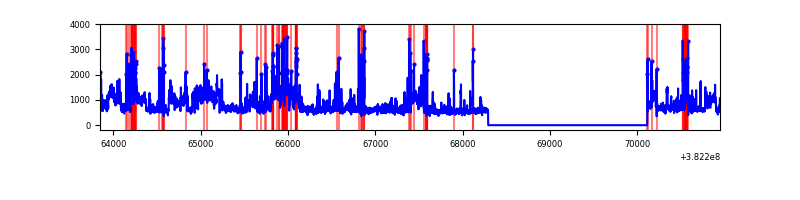 |
Top three noisy pixels from each quadrant. If the there are fewer than three noisy pixels in the level2.evt file, extra rows are filled as -1
| Pixel properties | Quadrant properties | ||||||
|---|---|---|---|---|---|---|---|
| Quadrant | DetID | PixID | Counts | Sigma | Mean | Median | Sigma |
| A | 10 | 83 | 36469 | 267.47 | 667 | 654 | 133.9 |
| A | 15 | 169 | 33914 | 248.39 | 667 | 654 | 133.9 |
| A | 13 | 6 | 33107 | 242.36 | 667 | 654 | 133.9 |
| B | 5 | 172 | 229577 | 1829.39 | 656 | 639 | 125.1 |
| B | 0 | 229 | 106692 | 847.44 | 656 | 639 | 125.1 |
| B | 5 | 31 | 93065 | 738.55 | 656 | 639 | 125.1 |
| C | 15 | 214 | 225030 | 1500.22 | 646 | 652 | 149.6 |
| C | 0 | 10 | 45147 | 297.5 | 646 | 652 | 149.6 |
| C | 15 | 208 | 37140 | 243.96 | 646 | 652 | 149.6 |
| D | 8 | 195 | 1176714 | 7433.88 | 644 | 628 | 158.2 |
| D | 2 | 250 | 276092 | 1741.17 | 644 | 628 | 158.2 |
| D | 2 | 249 | 184041 | 1159.33 | 644 | 628 | 158.2 |
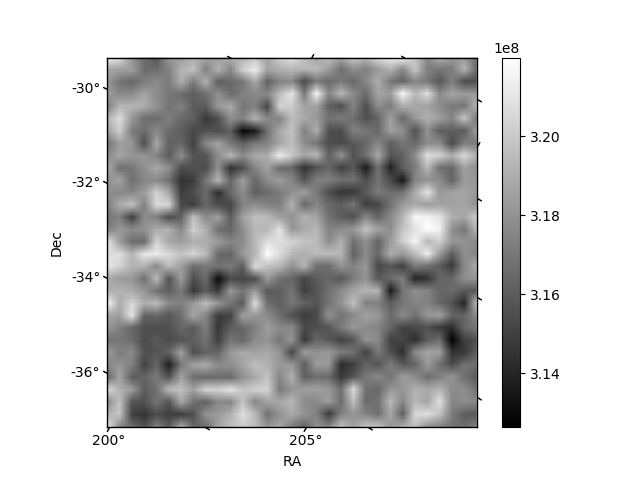
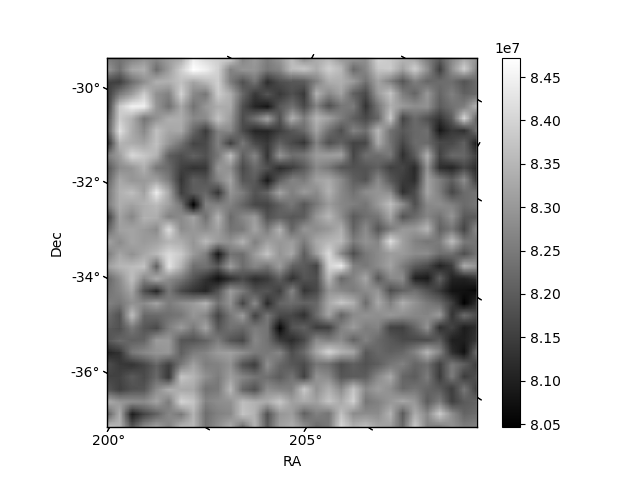
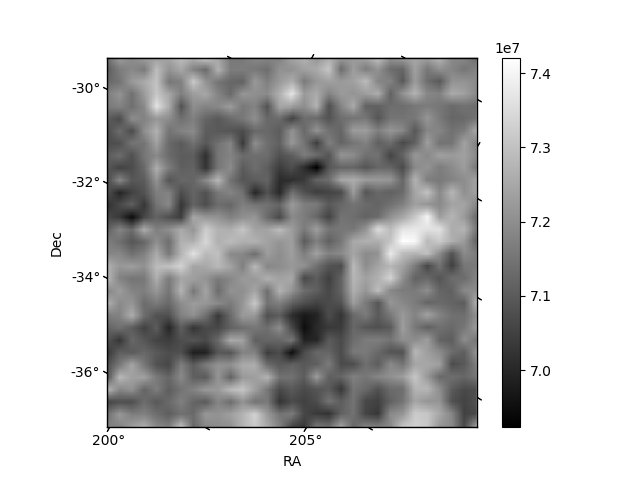
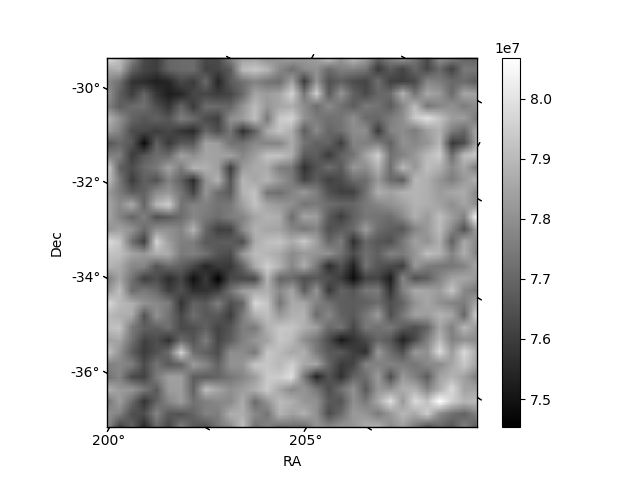
Histogram calculated using DETX and DETY for each event in the final _common_clean file
| Quadrant A | 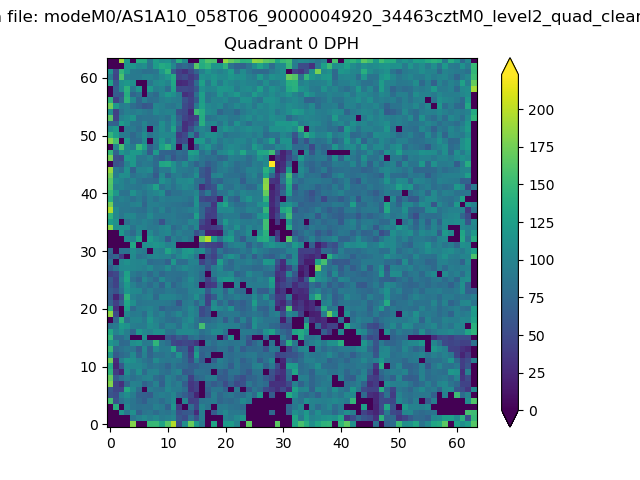 |
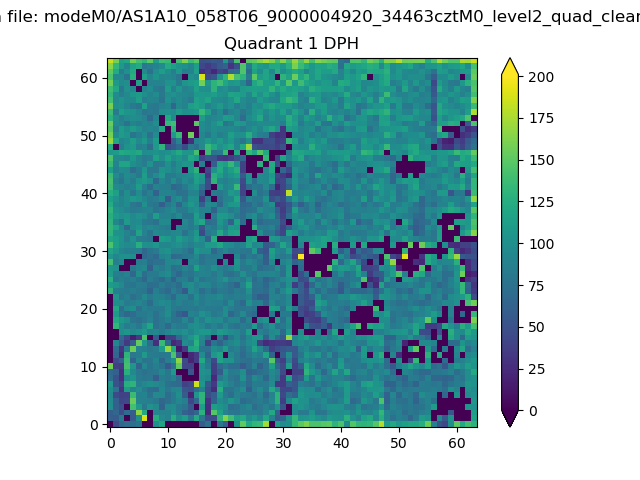 |
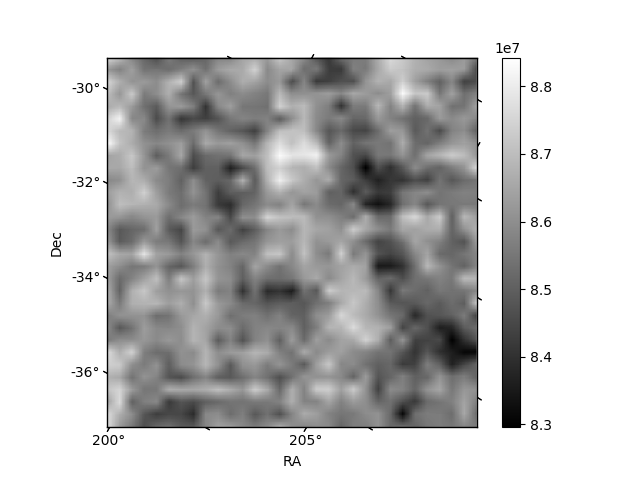
Quadrant B |
|---|---|---|---|
| Quadrant D | 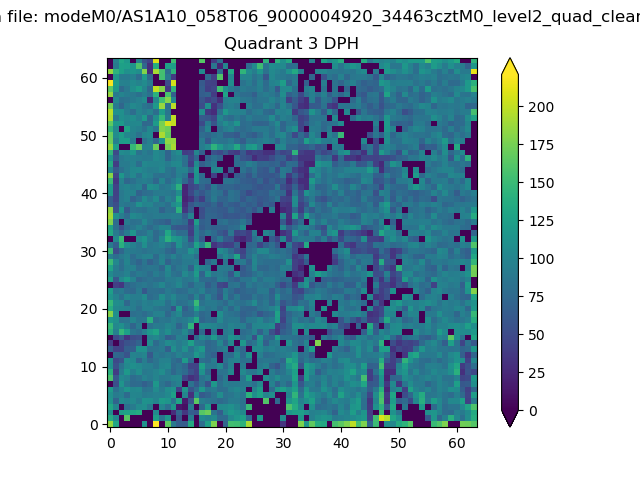 |
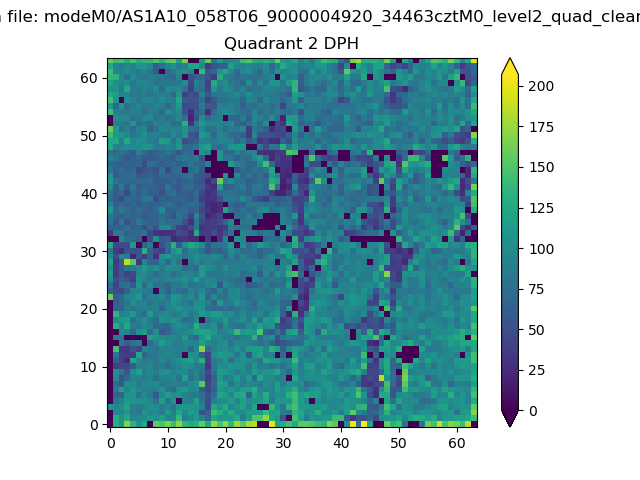 |
Quadrant C |
| Plot type | Count rate plots | Images |
|---|---|---|
| Comparison with Poisson distribution Blue bars denote a histogram of data divided into 1 sec bins. Red curve is a Poisson curve with rate = median count rate of data. |
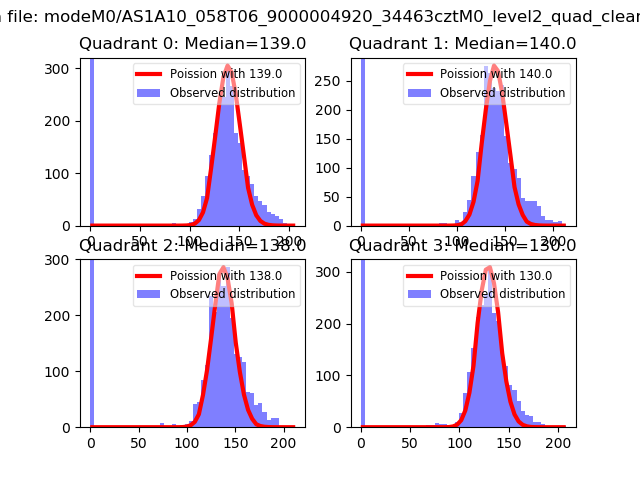 |
 |
| Quadrant-wise count rates Data is divided into 100 sec bins |
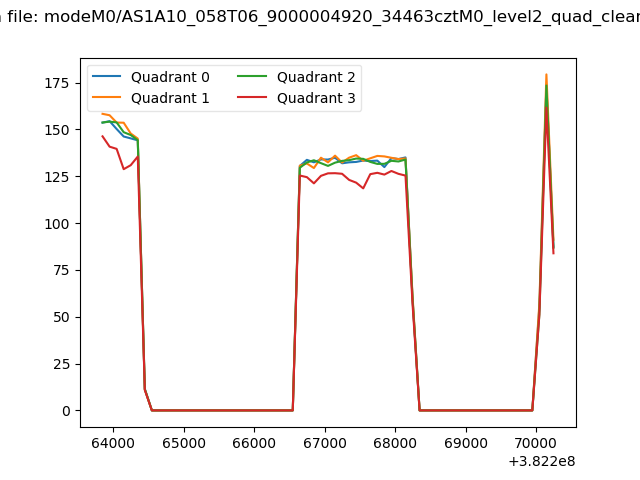 |
|
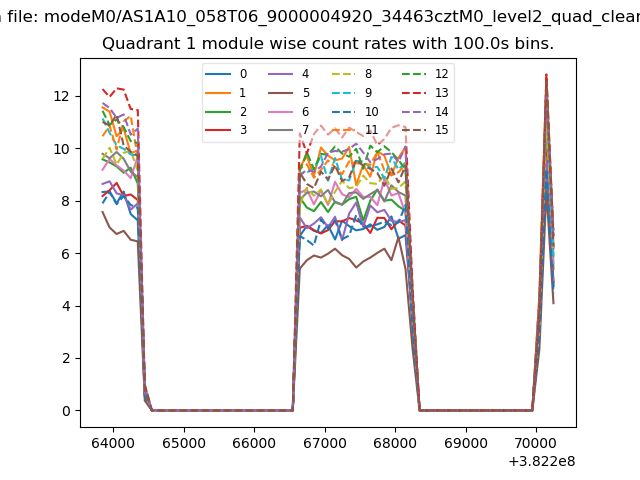
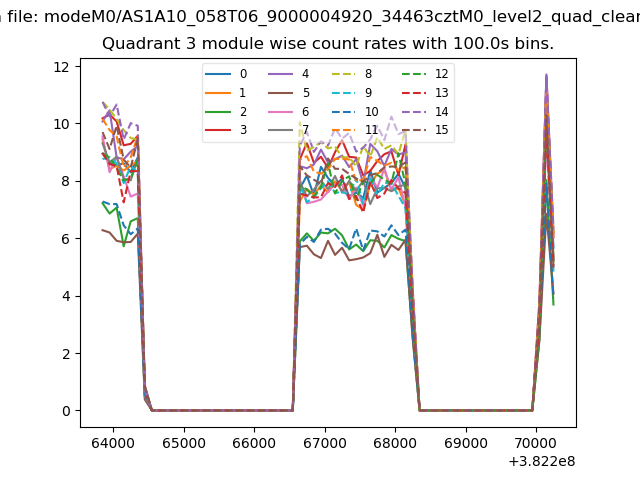
| Module-wise count rates for Quadrant A Data is divided into 100 sec bins |
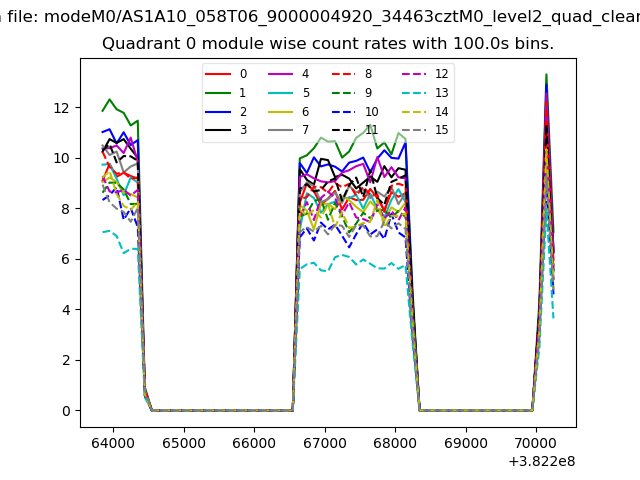 |
 |
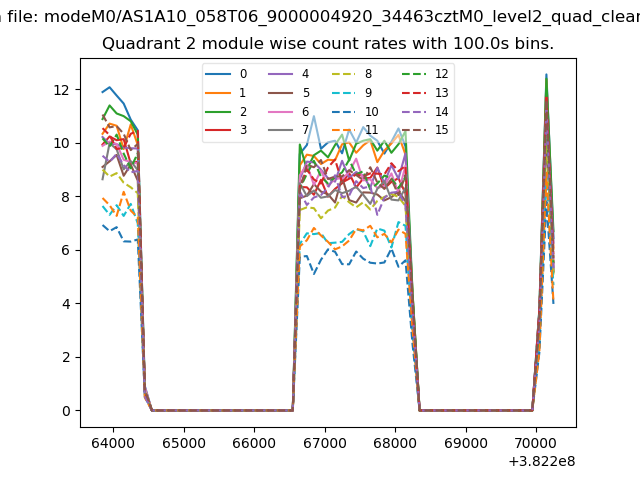
| Module-wise count rates for Quadrant B Data is divided into 100 sec bins |
 |
 |
| Module-wise count rates for Quadrant C Data is divided into 100 sec bins |
 |
 |
| Module-wise count rates for Quadrant D Data is divided into 100 sec bins |
 |
 |
| Parameter | Plot |
|---|---|
| CZT HV Monitor |  |
| D_VDD | 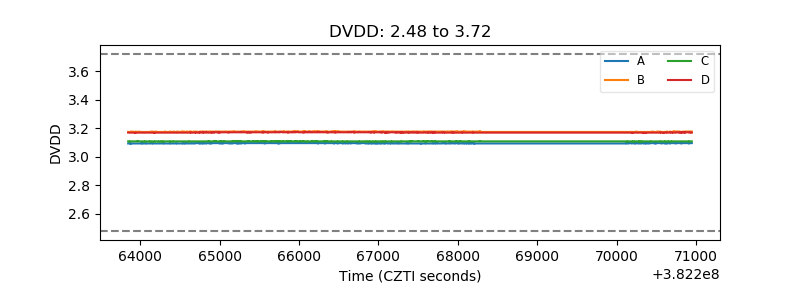 |
| Temperature 1 | 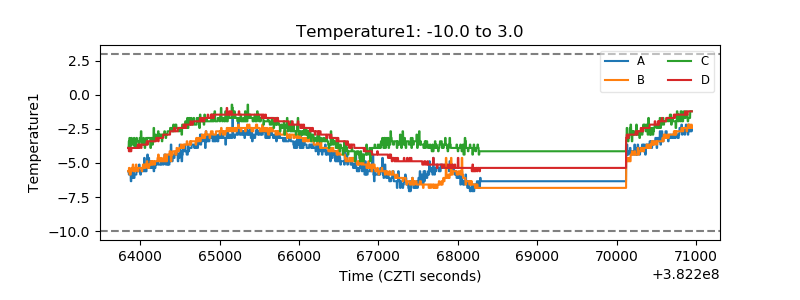 |
| Veto HV Monitor | 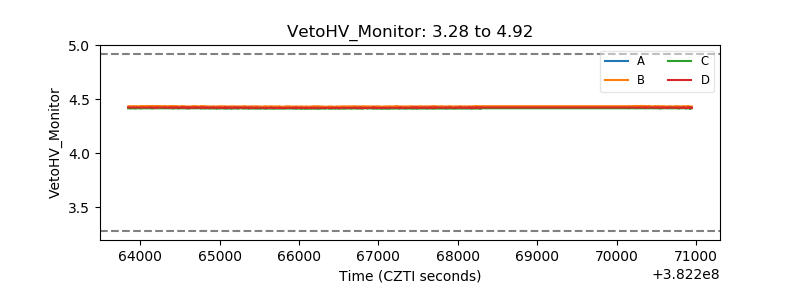 |
| Veto LLD | 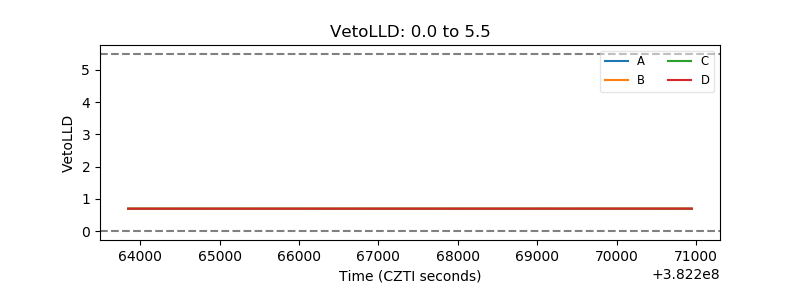 |
| Alpha Counter | 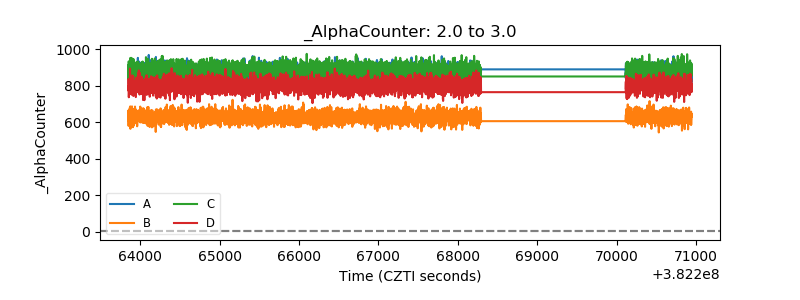 |
| _CPM_Rate | 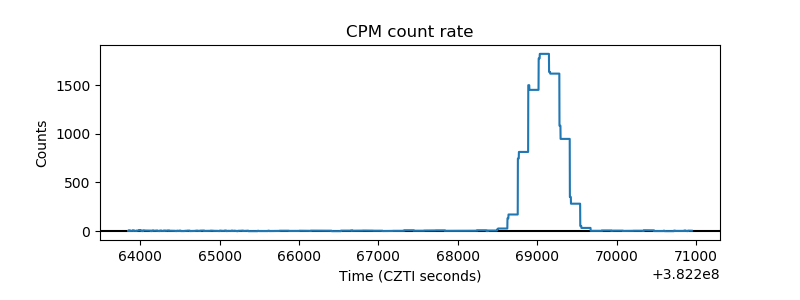 |
| CZT Counter | 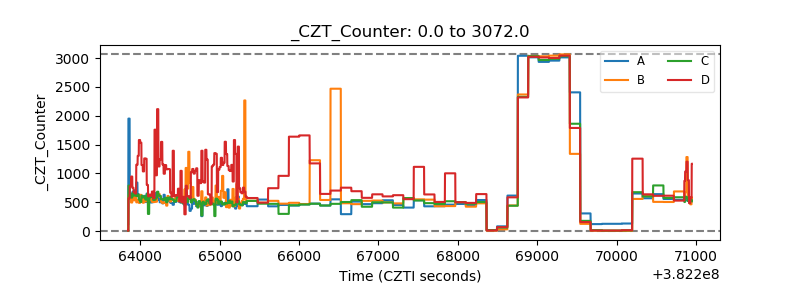 |
| +2.5 Volts monitor | 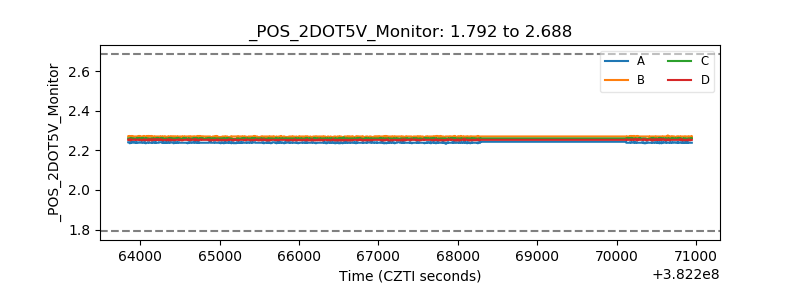 |
| +5 Volts monitor | 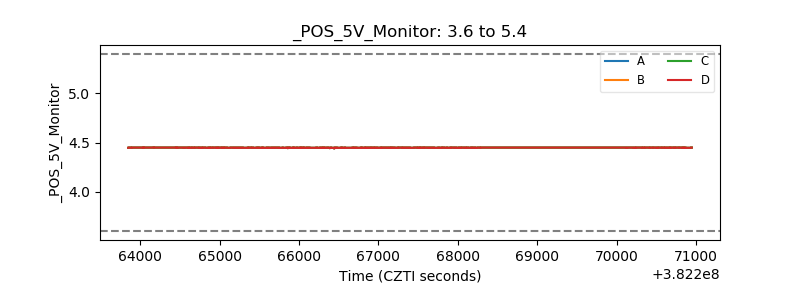 |
| _ROLL_ROT | 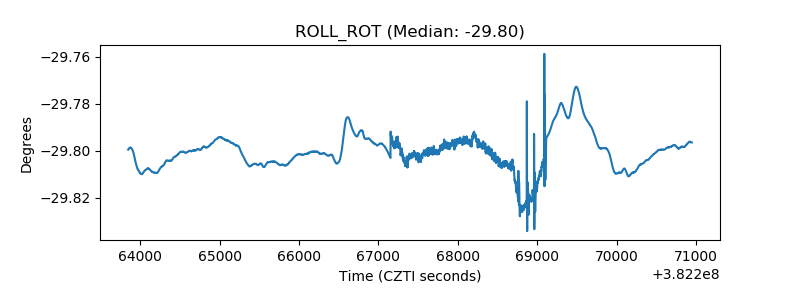 |
| _Roll_DEC | 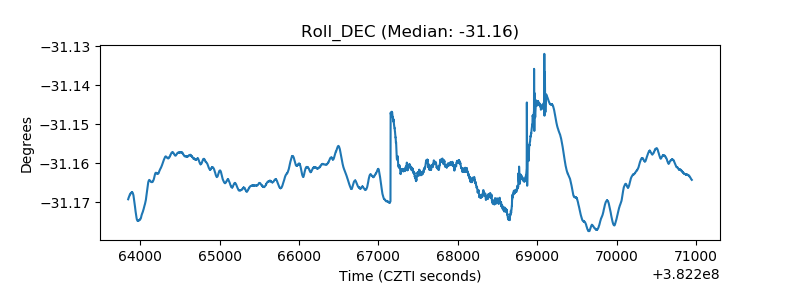 |
| _Roll_RA | 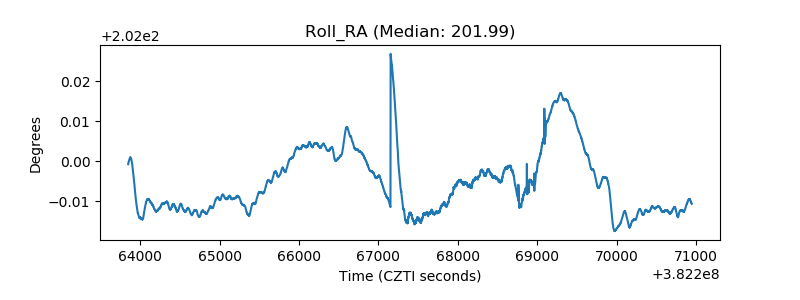 |
| Veto Counter | 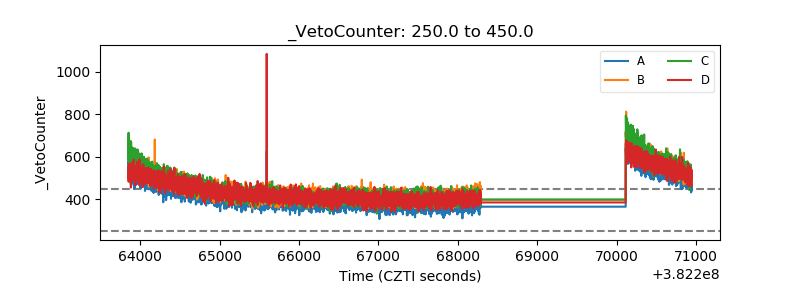 |