| Param | Original file | Final file |
|---|---|---|
| Filename | modeM0/AS1A10_058T06_9000004920_34461cztM0_level2.evt | modeM0/AS1A10_058T06_9000004920_34461cztM0_level2_quad_clean.evt |
| Size (bytes) | 625,052,160 | 61,197,120 |
| Size | 596.1 MB | 58.4 MB |
| Events in quadrant A | 3,149,575 | 402,964 |
| Events in quadrant B | 2,901,699 | 408,710 |
| Events in quadrant C | 2,943,031 | 401,149 |
| Events in quadrant D | 9,570,032 | 261,299 |
| Mode SS | |||
|---|---|---|---|
| Quadrant | BADHDUFLAG | Total packets | Discarded packets |
| A | 0 | 110 | 0 |
| B | 0 | 110 | 0 |
| C | 0 | 110 | 0 |
| D | 0 | 110 | 0 |
| Mode M0 | |||
|---|---|---|---|
| Quadrant | BADHDUFLAG | Total packets | Discarded packets |
| A | 0 | 12682 | 3 |
| B | 0 | 11939 | 2 |
| C | 0 | 11740 | 2 |
| D | 0 | 32046 | 2 |
| Mode M9 | |||
|---|---|---|---|
| Quadrant | BADHDUFLAG | Total packets | Discarded packets |
| A | 0 | 17 | 0 |
| B | 0 | 17 | 0 |
| C | 0 | 17 | 0 |
| D | 0 | 18 | 0 |
| Quadrant | Total seconds | Saturated seconds | Saturation percentage |
|---|---|---|---|
| A | 5400 | 174 | 3.222222% |
| B | 5400 | 44 | 0.814815% |
| C | 5400 | 27 | 0.500000% |
| D | 5400 | 2403 | 44.500000% |
Noise dominated data is calculated using 1-second bins in cleaned event files. If a bin has >2000 counts, and if more than 50% of those come from <1% of pixels, then it is considered to be noise-dominated and hence unusable.
| Quadrant | # 1 sec bins | Bins with >0 counts | Bins with >2000 counts | High rate bins dominated by noise | Noise dominated (total time) | Noise dominated (detector-on time) | Marked lightcurve |
|---|---|---|---|---|---|---|---|
| A | 7103 | 5401 | 126 | 126 | 1.77% | 2.33% | 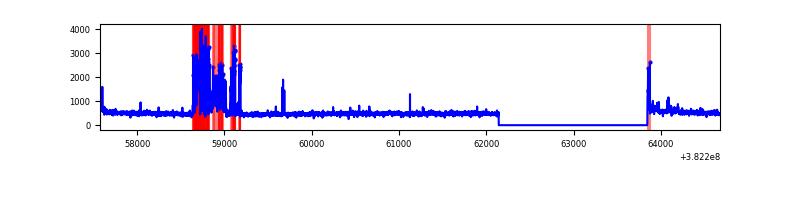 |
| B | 7103 | 5401 | 28 | 28 | 0.39% | 0.52% | 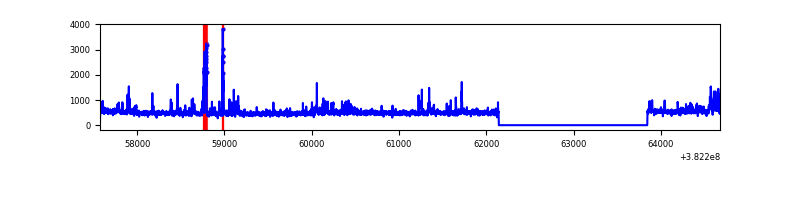 |
| C | 7103 | 5401 | 19 | 19 | 0.27% | 0.35% |  |
| D | 7103 | 5401 | 2336 | 2336 | 32.89% | 43.25% | 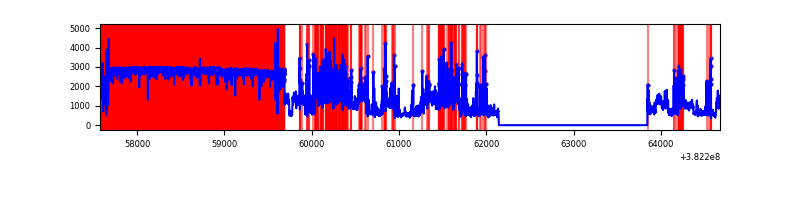 |
Top three noisy pixels from each quadrant. If the there are fewer than three noisy pixels in the level2.evt file, extra rows are filled as -1
| Pixel properties | Quadrant properties | ||||||
|---|---|---|---|---|---|---|---|
| Quadrant | DetID | PixID | Counts | Sigma | Mean | Median | Sigma |
| A | 15 | 169 | 596306 | 4579.28 | 648 | 635 | 130.1 |
| A | 10 | 83 | 36184 | 273.29 | 648 | 635 | 130.1 |
| A | 13 | 6 | 12537 | 91.5 | 648 | 635 | 130.1 |
| B | 5 | 172 | 148546 | 1172.98 | 648 | 631 | 126.1 |
| B | 5 | 31 | 139303 | 1099.68 | 648 | 631 | 126.1 |
| B | 5 | 15 | 22457 | 173.08 | 648 | 631 | 126.1 |
| C | 15 | 214 | 228644 | 1534.95 | 640 | 644 | 148.5 |
| C | 0 | 10 | 82821 | 553.23 | 640 | 644 | 148.5 |
| C | 15 | 208 | 62690 | 417.71 | 640 | 644 | 148.5 |
| D | 7 | 223 | 5465695 | 51715.47 | 424 | 410 | 105.7 |
| D | 8 | 195 | 1308698 | 12379.73 | 424 | 410 | 105.7 |
| D | 7 | 80 | 481642 | 4553.68 | 424 | 410 | 105.7 |
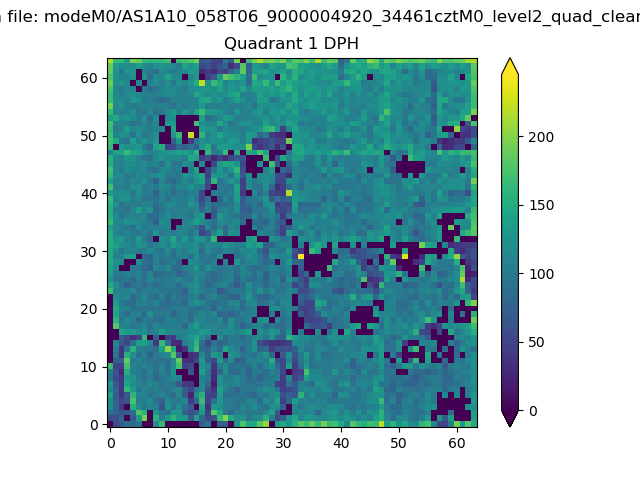
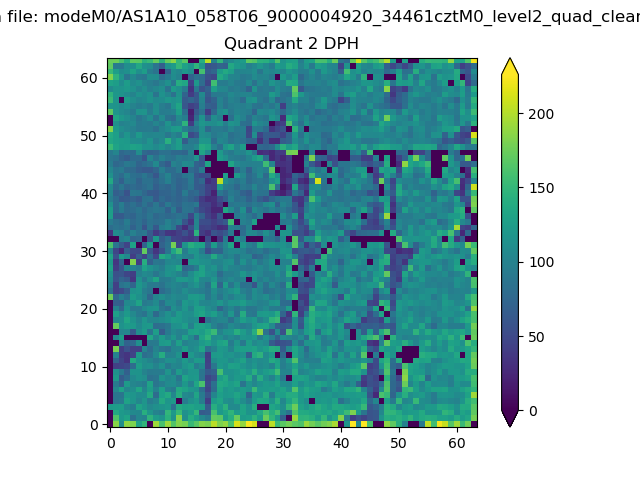
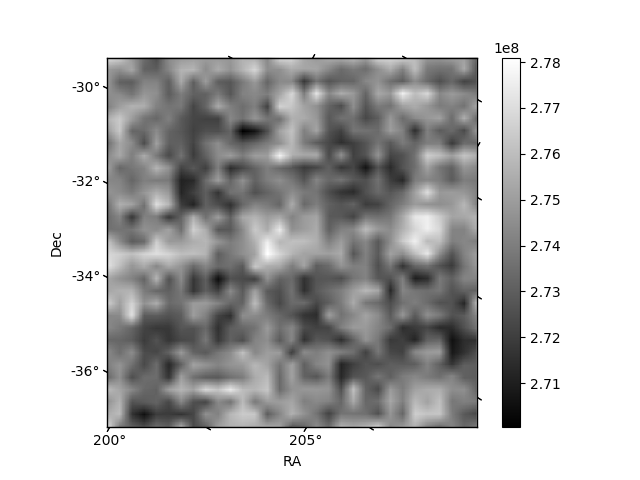
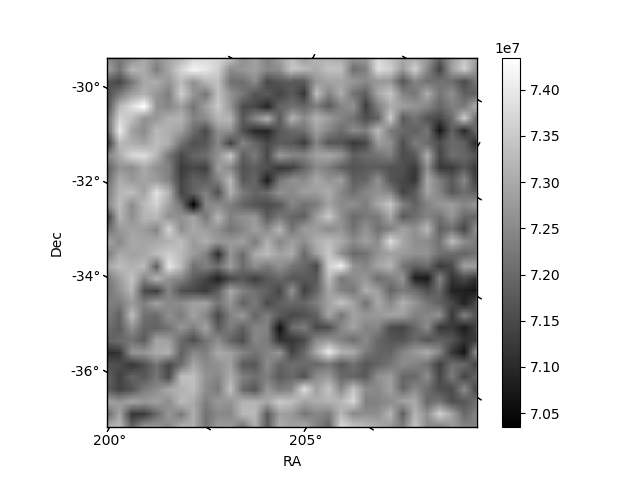
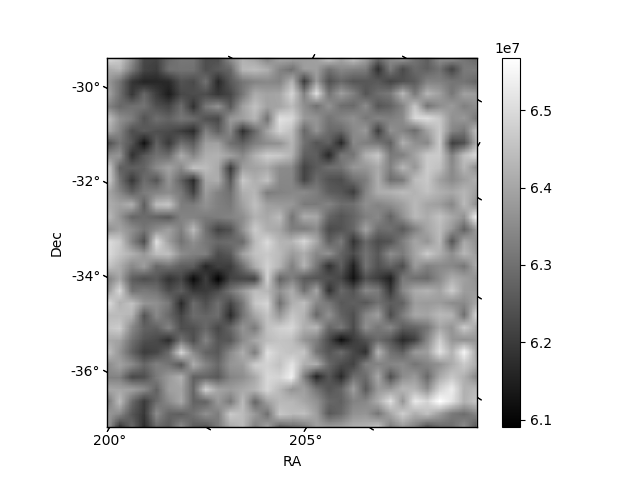
Histogram calculated using DETX and DETY for each event in the final _common_clean file
| Quadrant A | 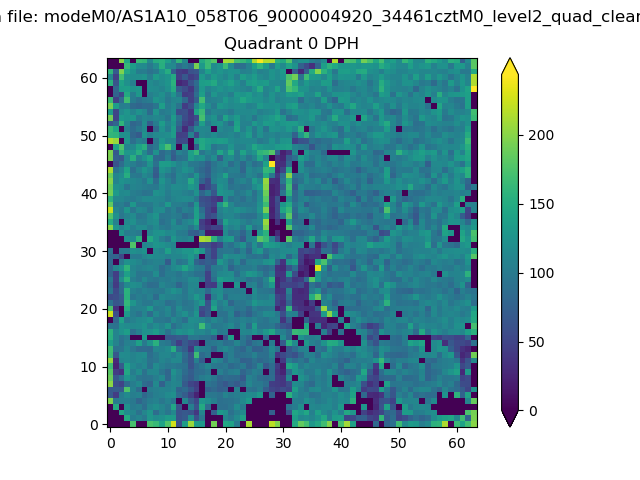 |
 |
Quadrant B |
|---|---|---|---|
| Quadrant D | 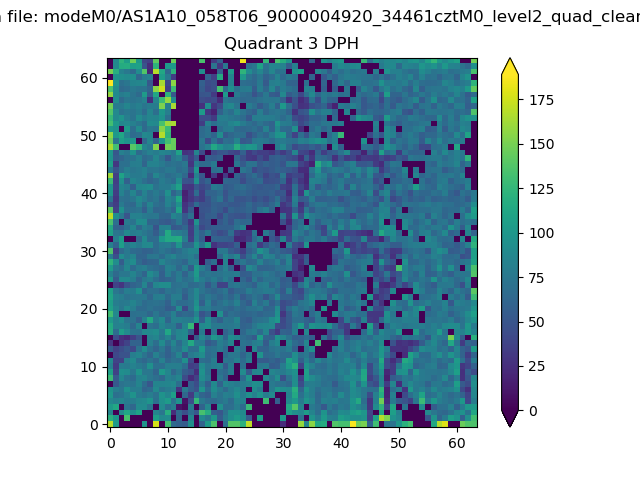 |
 |
Quadrant C |
| Plot type | Count rate plots | Images |
|---|---|---|
| Comparison with Poisson distribution Blue bars denote a histogram of data divided into 1 sec bins. Red curve is a Poisson curve with rate = median count rate of data. |
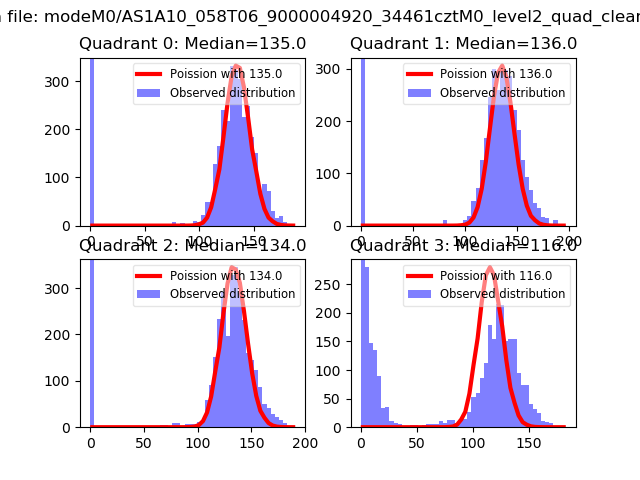 |
 |
| Quadrant-wise count rates Data is divided into 100 sec bins |
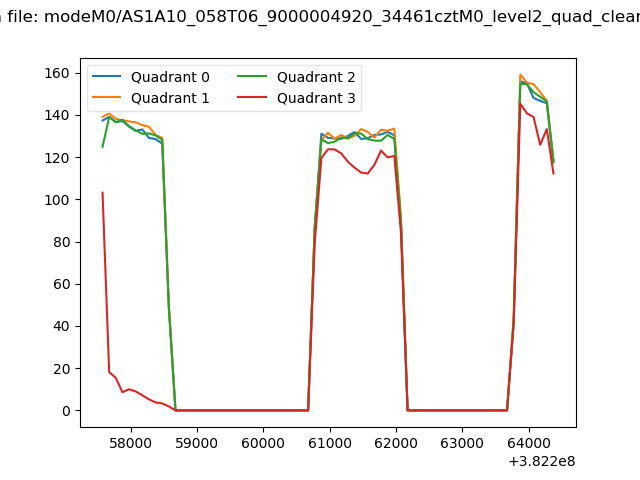 |
|
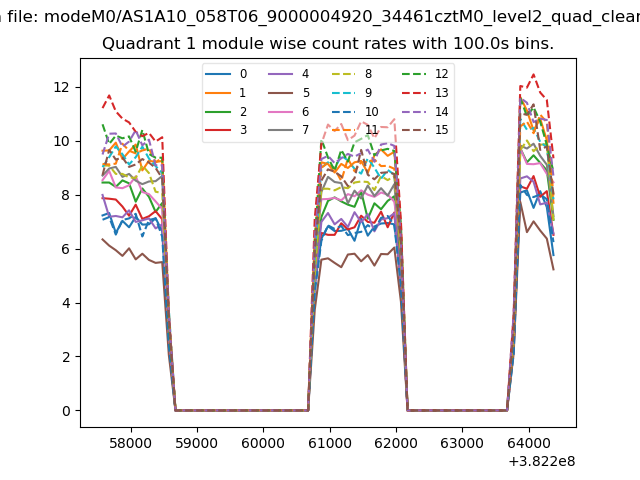
| Module-wise count rates for Quadrant A Data is divided into 100 sec bins |
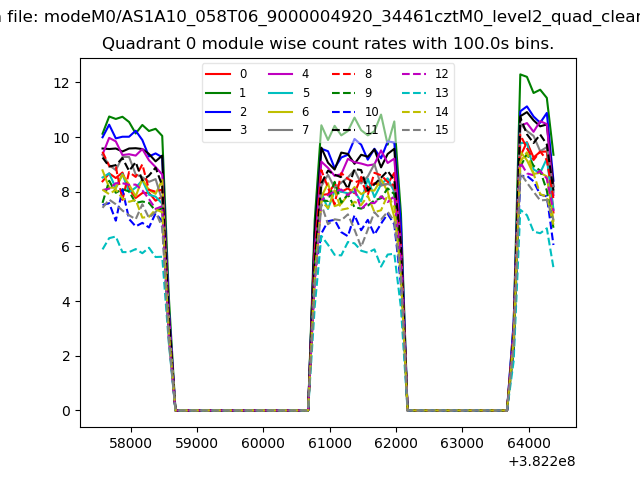 |
 |
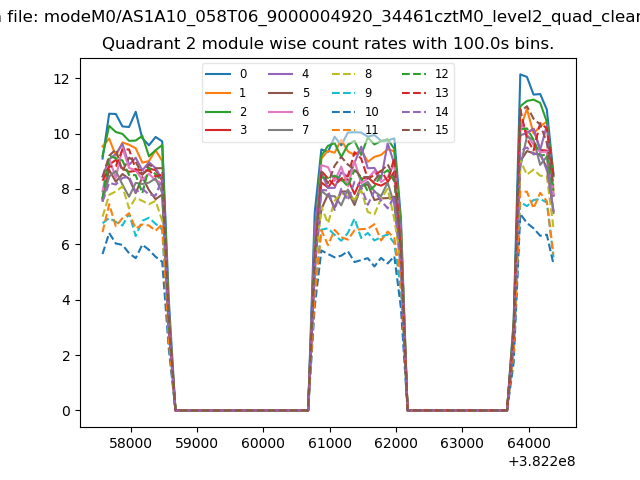
| Module-wise count rates for Quadrant B Data is divided into 100 sec bins |
 |
 |
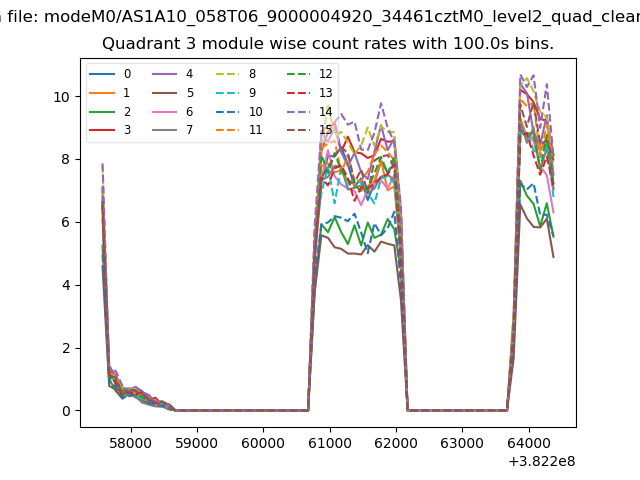
| Module-wise count rates for Quadrant C Data is divided into 100 sec bins |
 |
 |
| Module-wise count rates for Quadrant D Data is divided into 100 sec bins |
 |
 |
| Parameter | Plot |
|---|---|
| CZT HV Monitor | 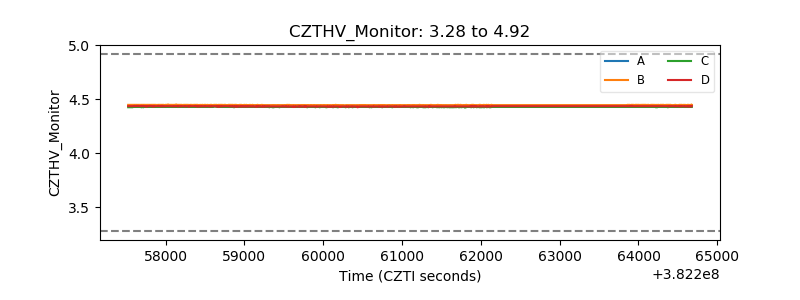 |
| D_VDD | 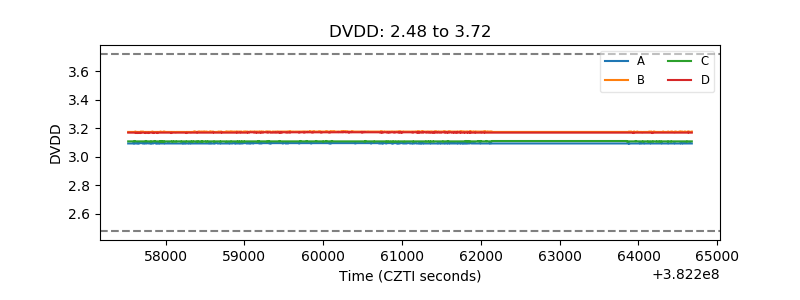 |
| Temperature 1 | 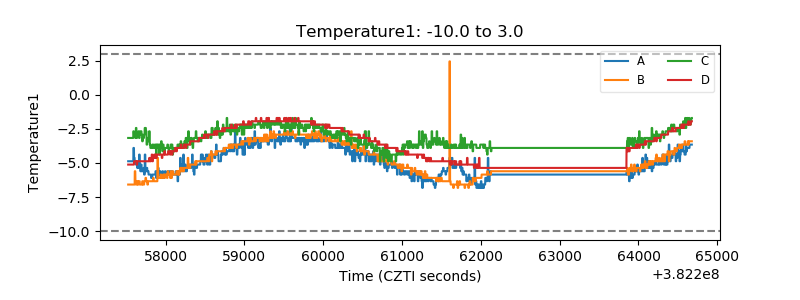 |
| Veto HV Monitor | 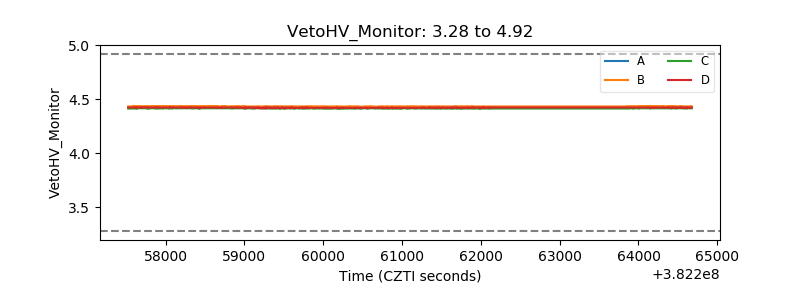 |
| Veto LLD | 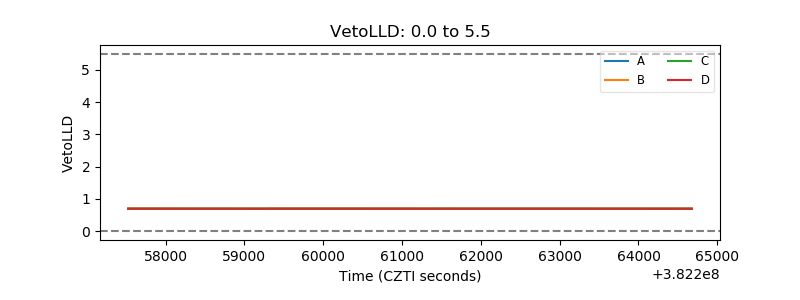 |
| Alpha Counter | 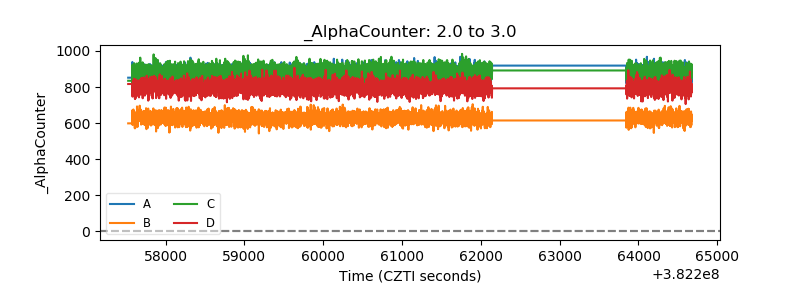 |
| _CPM_Rate | 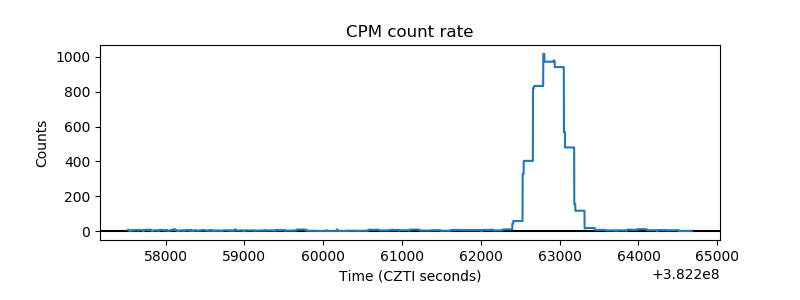 |
| CZT Counter | 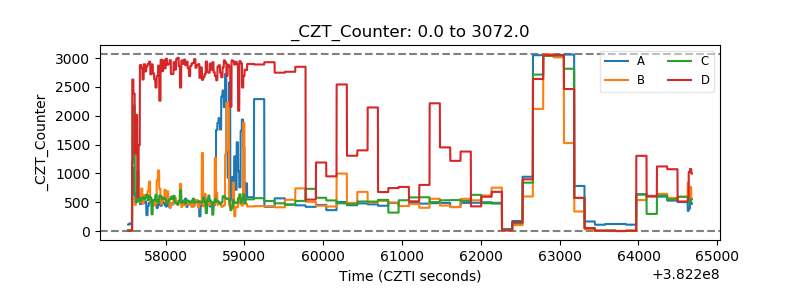 |
| +2.5 Volts monitor | 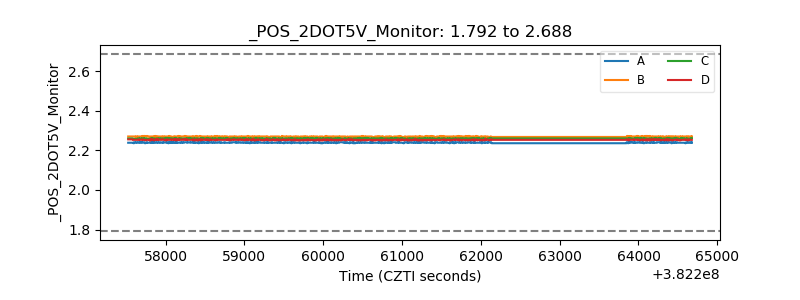 |
| +5 Volts monitor | 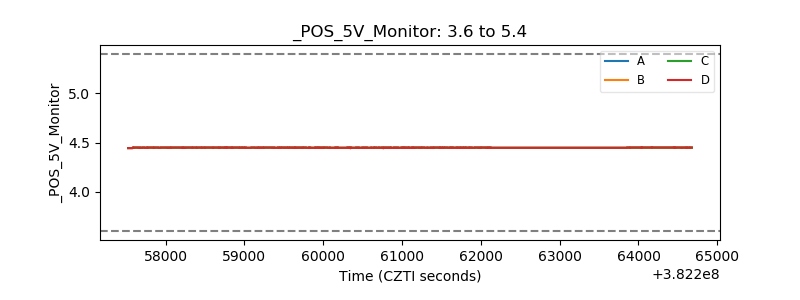 |
| _ROLL_ROT | 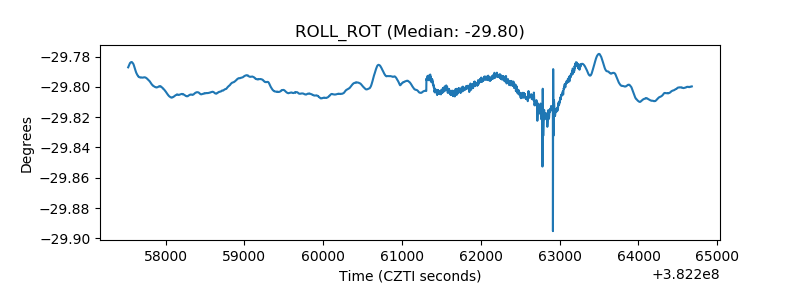 |
| _Roll_DEC | 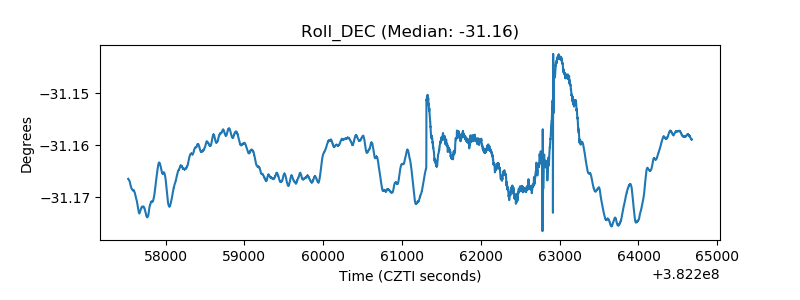 |
| _Roll_RA | 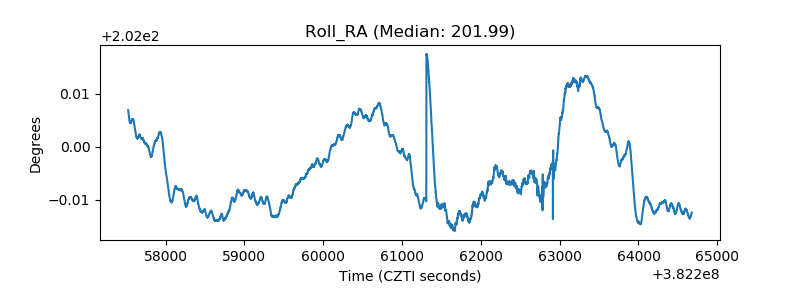 |
| Veto Counter | 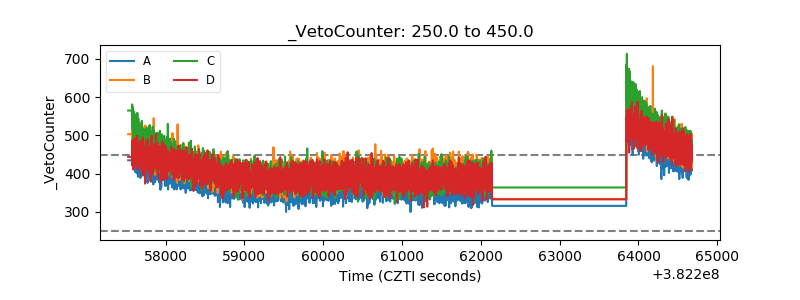 |