| Param | Original file | Final file |
|---|---|---|
| Filename | modeM0/AS1A10_058T06_9000004920_34460cztM0_level2.evt | modeM0/AS1A10_058T06_9000004920_34460cztM0_level2_quad_clean.evt |
| Size (bytes) | 1,060,329,600 | 82,025,280 |
| Size | 1011.2 MB | 78.2 MB |
| Events in quadrant A | 5,624,723 | 564,165 |
| Events in quadrant B | 4,492,884 | 572,891 |
| Events in quadrant C | 4,749,182 | 557,567 |
| Events in quadrant D | 16,656,202 | 180,648 |
| Mode SS | |||
|---|---|---|---|
| Quadrant | BADHDUFLAG | Total packets | Discarded packets |
| A | 0 | 178 | 0 |
| B | 0 | 178 | 0 |
| C | 0 | 178 | 0 |
| D | 0 | 178 | 0 |
| Mode M0 | |||
|---|---|---|---|
| Quadrant | BADHDUFLAG | Total packets | Discarded packets |
| A | 0 | 22306 | 3 |
| B | 0 | 18732 | 2 |
| C | 0 | 18982 | 2 |
| D | 0 | 55211 | 2 |
| Mode M9 | |||
|---|---|---|---|
| Quadrant | BADHDUFLAG | Total packets | Discarded packets |
| A | 0 | 30 | 0 |
| B | 0 | 30 | 0 |
| C | 0 | 30 | 0 |
| D | 0 | 30 | 0 |
| Quadrant | Total seconds | Saturated seconds | Saturation percentage |
|---|---|---|---|
| A | 8744 | 169 | 1.932754% |
| B | 8744 | 73 | 0.834858% |
| C | 8744 | 58 | 0.663312% |
| D | 8744 | 4923 | 56.301464% |
Noise dominated data is calculated using 1-second bins in cleaned event files. If a bin has >2000 counts, and if more than 50% of those come from <1% of pixels, then it is considered to be noise-dominated and hence unusable.
| Quadrant | # 1 sec bins | Bins with >0 counts | Bins with >2000 counts | High rate bins dominated by noise | Noise dominated (total time) | Noise dominated (detector-on time) | Marked lightcurve |
|---|---|---|---|---|---|---|---|
| A | 11729 | 8746 | 110 | 110 | 0.94% | 1.26% | 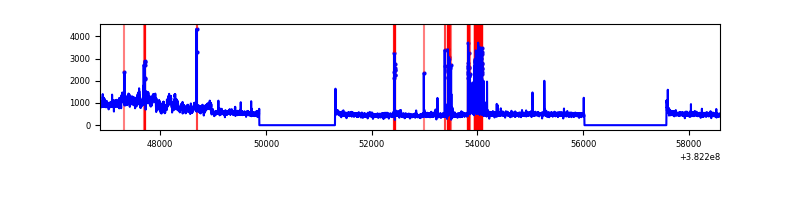 |
| B | 11729 | 8746 | 35 | 35 | 0.30% | 0.40% | 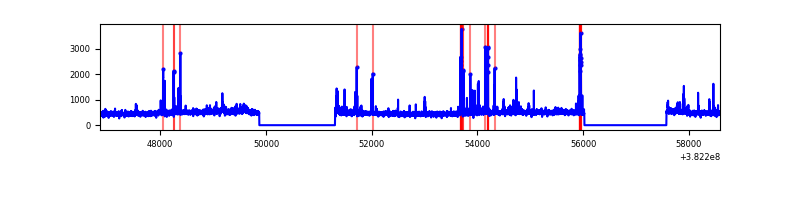 |
| C | 11729 | 8745 | 48 | 48 | 0.41% | 0.55% | 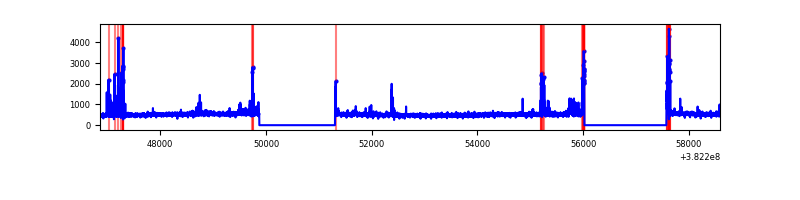 |
| D | 11728 | 8744 | 4760 | 4760 | 40.59% | 54.44% | 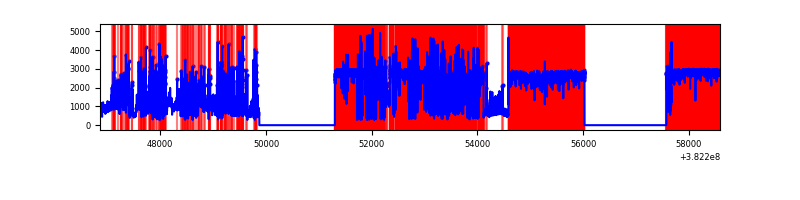 |
Top three noisy pixels from each quadrant. If the there are fewer than three noisy pixels in the level2.evt file, extra rows are filled as -1
| Pixel properties | Quadrant properties | ||||||
|---|---|---|---|---|---|---|---|
| Quadrant | DetID | PixID | Counts | Sigma | Mean | Median | Sigma |
| A | 15 | 169 | 1445808 | 6866.41 | 1048 | 1026 | 210.4 |
| A | 10 | 83 | 42872 | 198.88 | 1048 | 1026 | 210.4 |
| A | 12 | 227 | 42554 | 197.36 | 1048 | 1026 | 210.4 |
| B | 0 | 229 | 94381 | 455.86 | 1047 | 1018 | 204.8 |
| B | 5 | 255 | 92246 | 445.44 | 1047 | 1018 | 204.8 |
| B | 5 | 172 | 73449 | 353.66 | 1047 | 1018 | 204.8 |
| C | 15 | 214 | 360147 | 1504.56 | 1025 | 1033 | 238.7 |
| C | 15 | 208 | 205062 | 854.81 | 1025 | 1033 | 238.7 |
| C | 4 | 254 | 70441 | 290.79 | 1025 | 1033 | 238.7 |
| D | 7 | 223 | 11869420 | 83241.84 | 574 | 556 | 142.6 |
| D | 8 | 195 | 1559564 | 10934.05 | 574 | 556 | 142.6 |
| D | 7 | 80 | 365183 | 2557.3 | 574 | 556 | 142.6 |
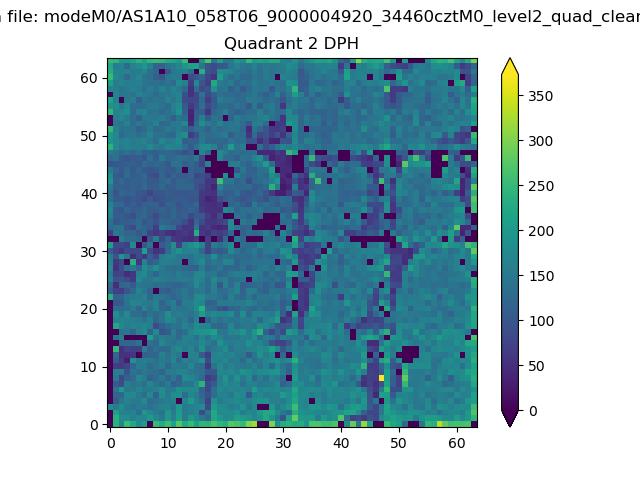
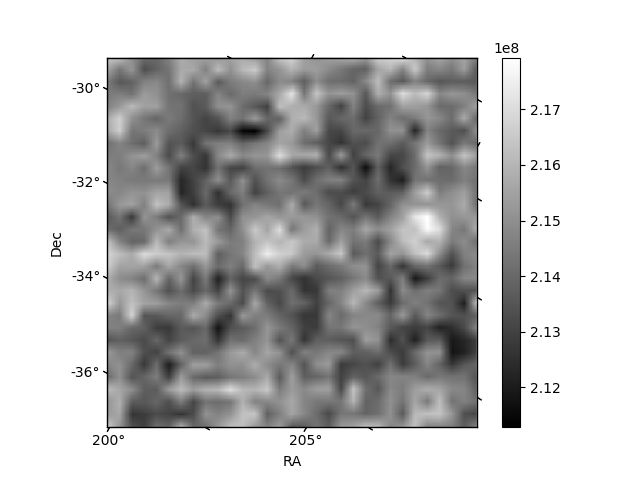
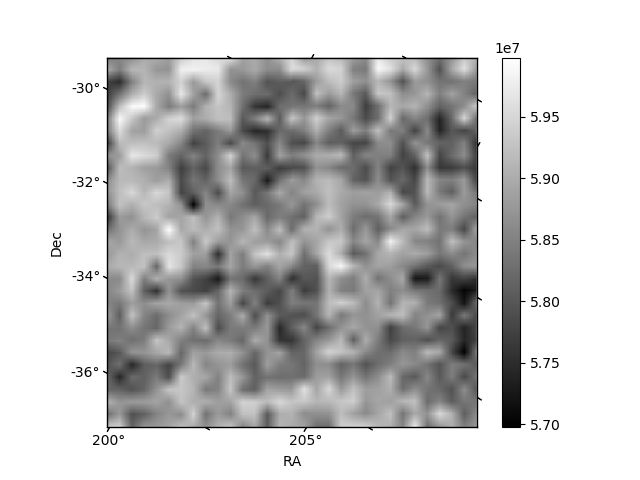
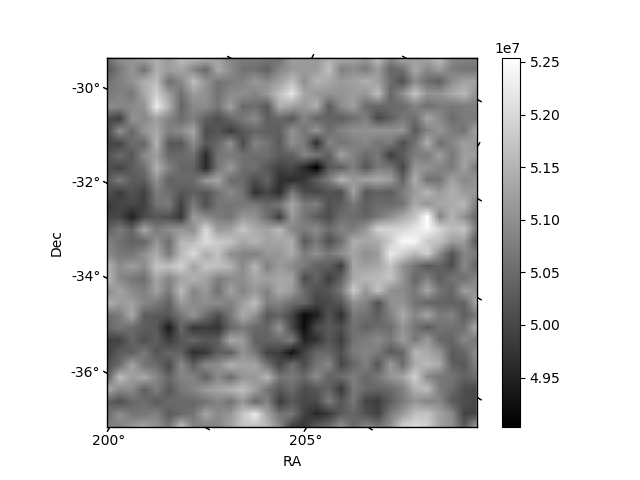
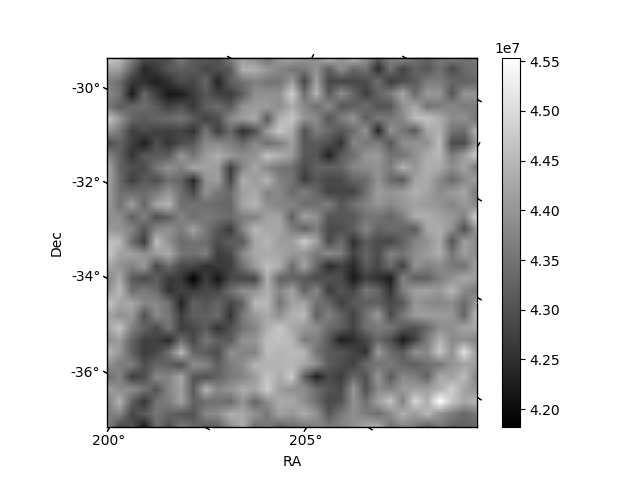
Histogram calculated using DETX and DETY for each event in the final _common_clean file
| Quadrant A | 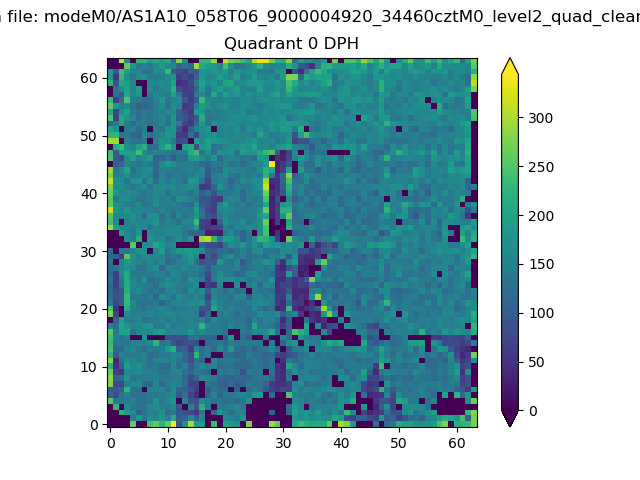 |
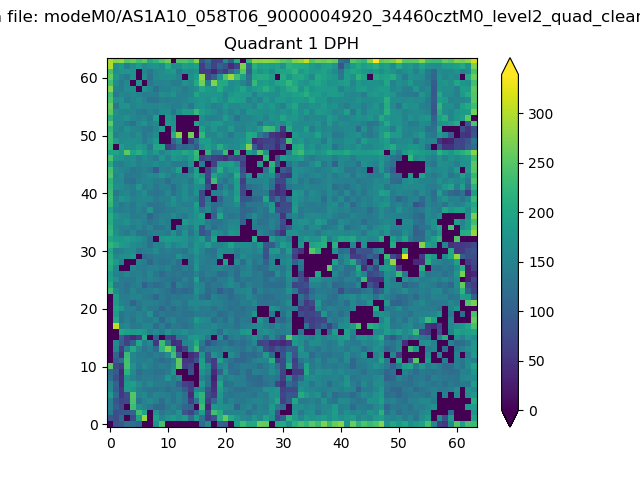 |
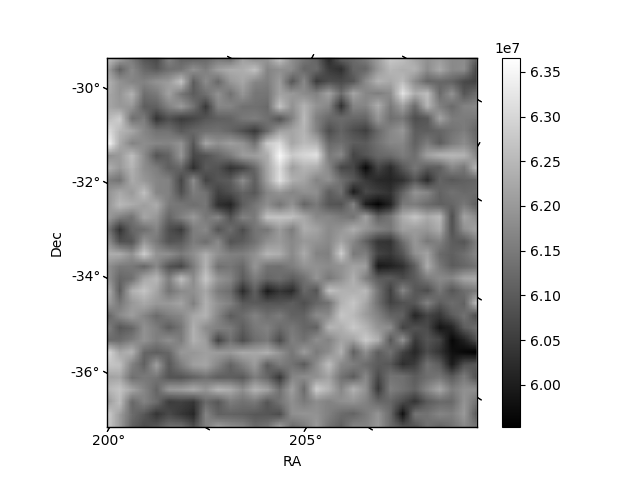
Quadrant B |
|---|---|---|---|
| Quadrant D | 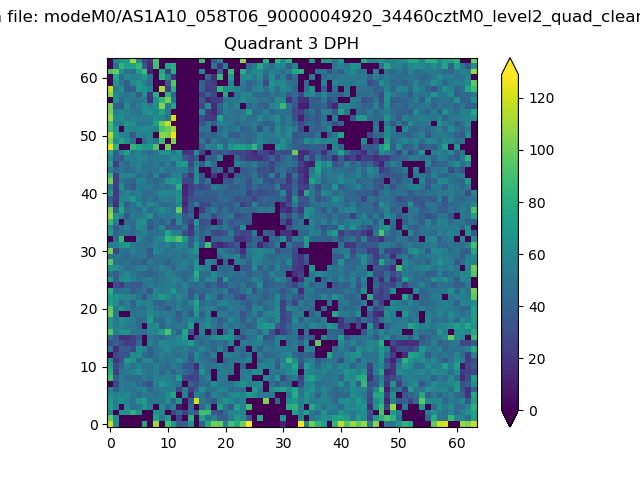 |
 |
Quadrant C |
| Plot type | Count rate plots | Images |
|---|---|---|
| Comparison with Poisson distribution Blue bars denote a histogram of data divided into 1 sec bins. Red curve is a Poisson curve with rate = median count rate of data. |
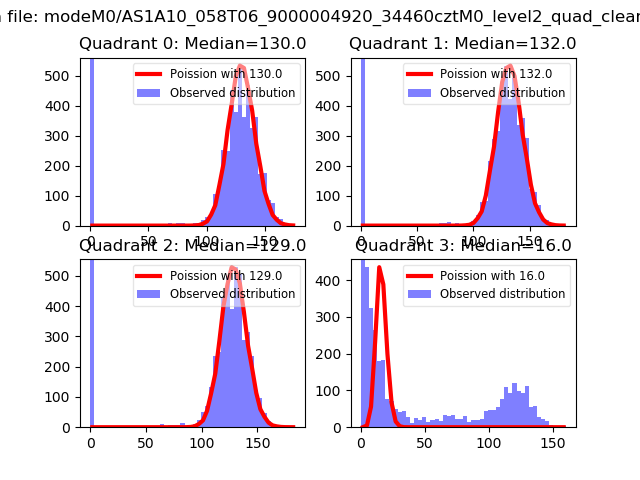 |
 |
| Quadrant-wise count rates Data is divided into 100 sec bins |
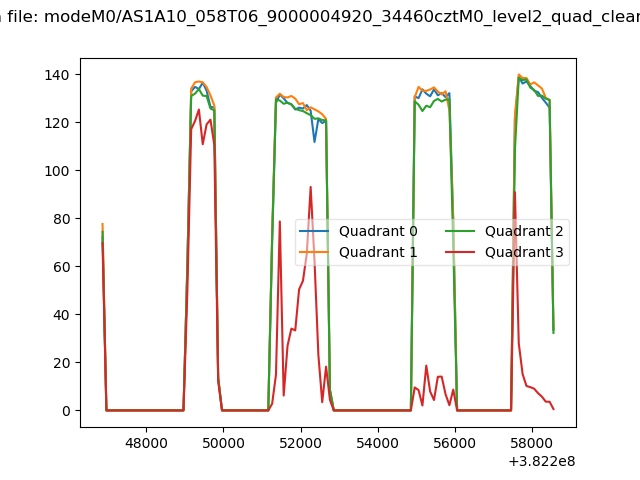 |
|
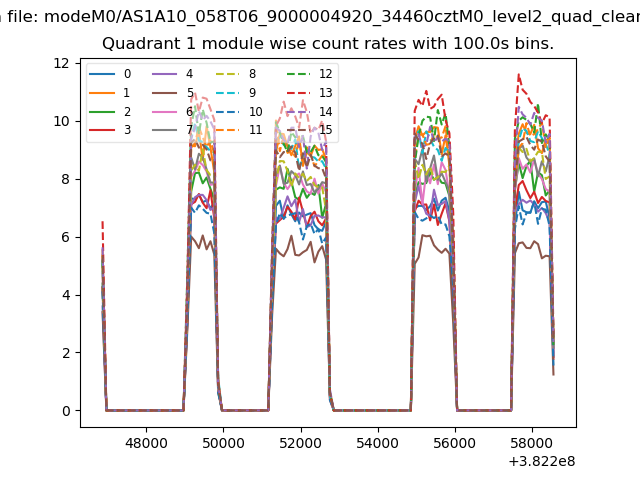
| Module-wise count rates for Quadrant A Data is divided into 100 sec bins |
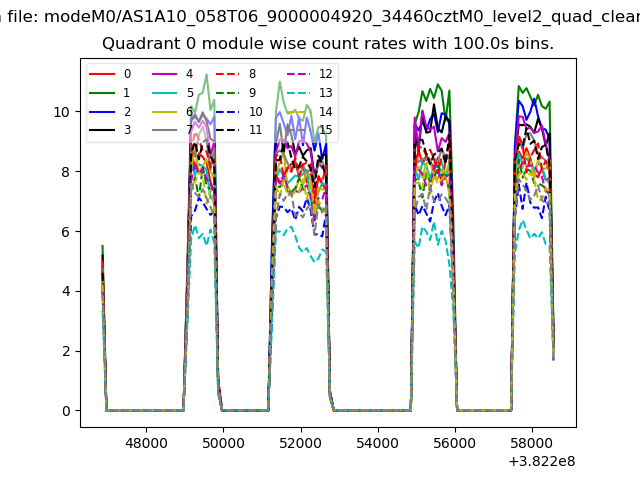 |
 |
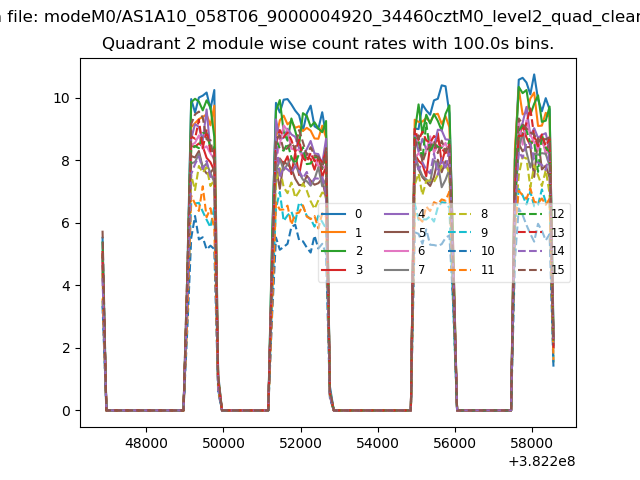
| Module-wise count rates for Quadrant B Data is divided into 100 sec bins |
 |
 |
| Module-wise count rates for Quadrant C Data is divided into 100 sec bins |
 |
 |
| Module-wise count rates for Quadrant D Data is divided into 100 sec bins |
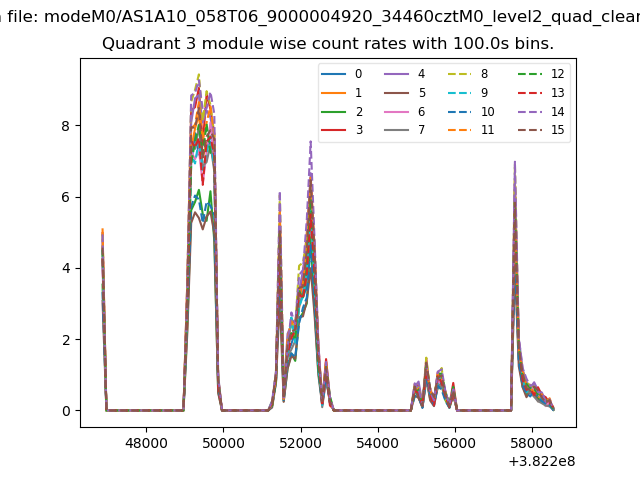 |
 |
| Parameter | Plot |
|---|---|
| CZT HV Monitor | 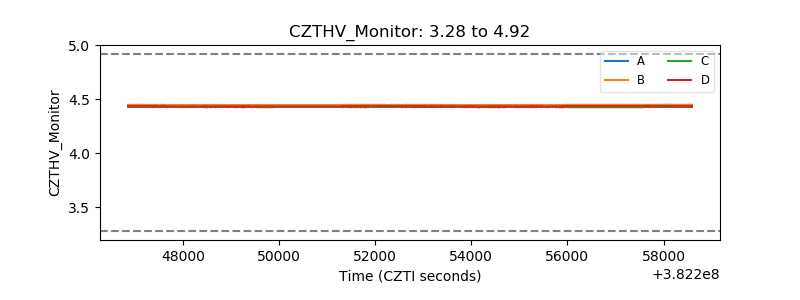 |
| D_VDD | 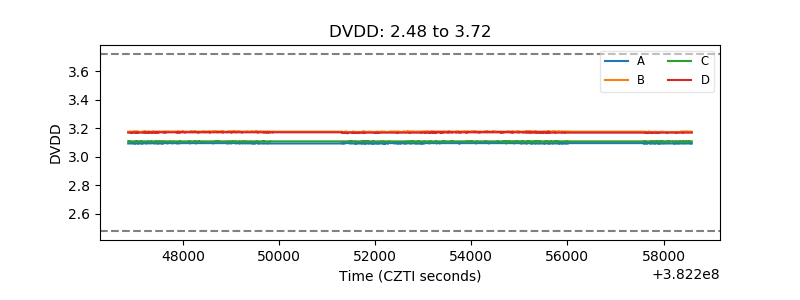 |
| Temperature 1 | 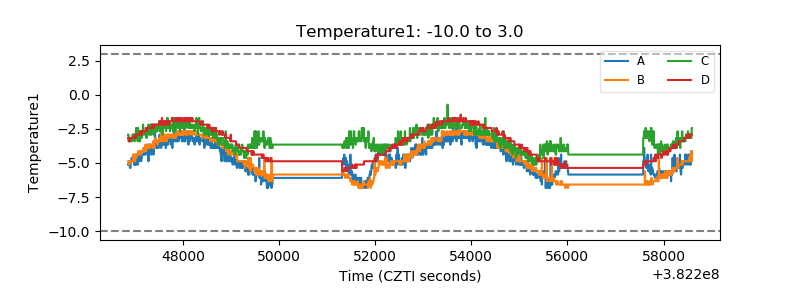 |
| Veto HV Monitor |  |
| Veto LLD | 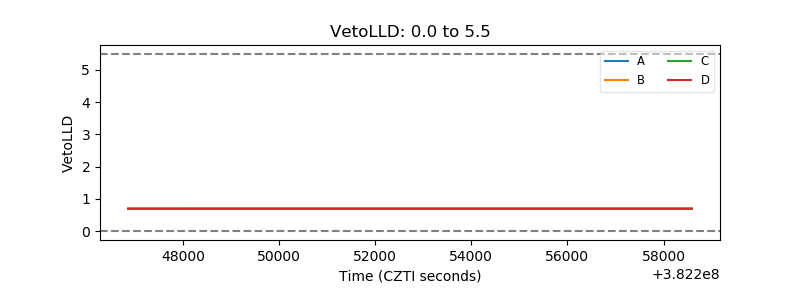 |
| Alpha Counter | 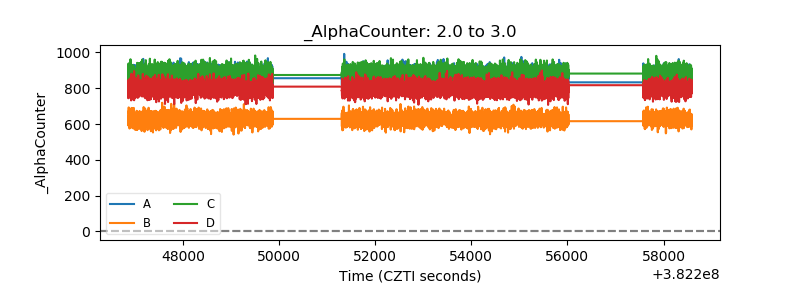 |
| _CPM_Rate | 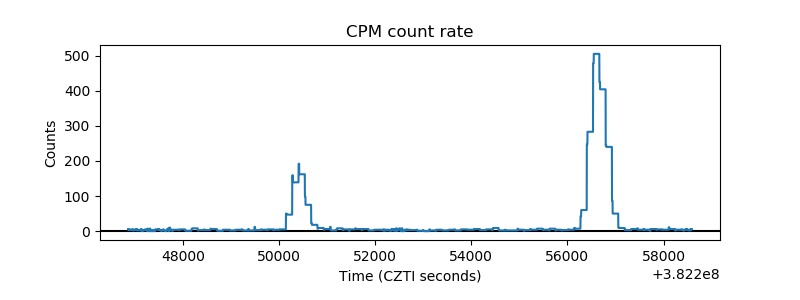 |
| CZT Counter | 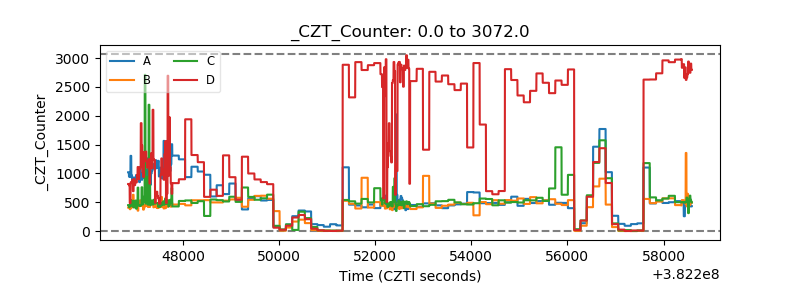 |
| +2.5 Volts monitor | 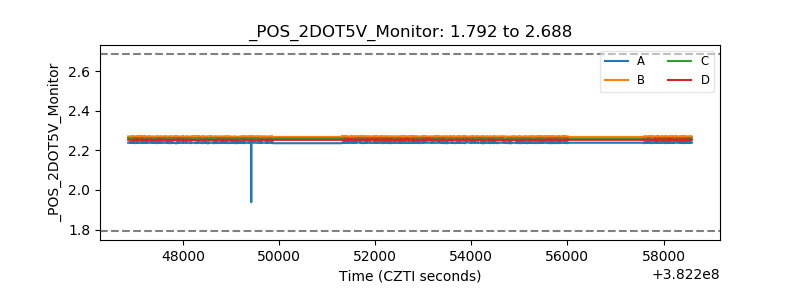 |
| +5 Volts monitor | 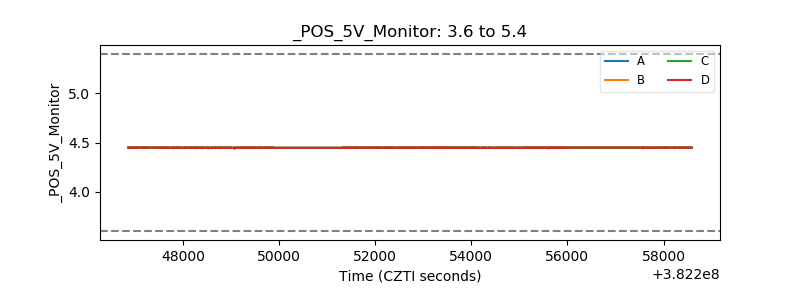 |
| _ROLL_ROT | 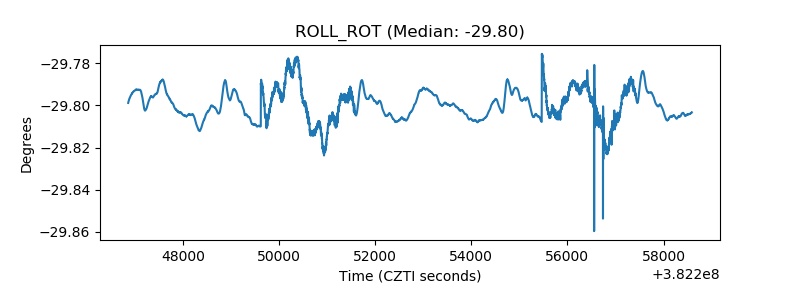 |
| _Roll_DEC | 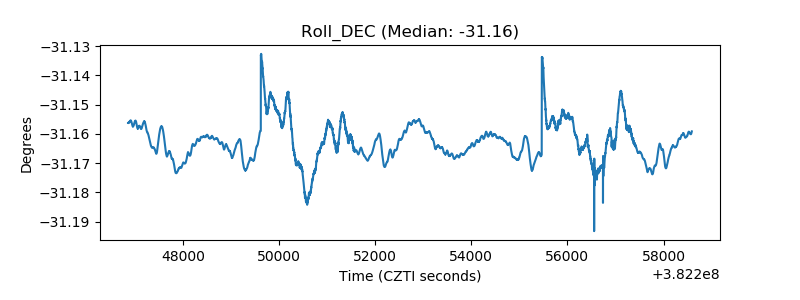 |
| _Roll_RA | 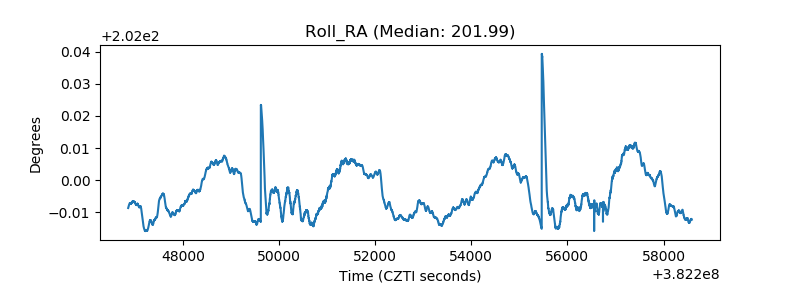 |
| Veto Counter | 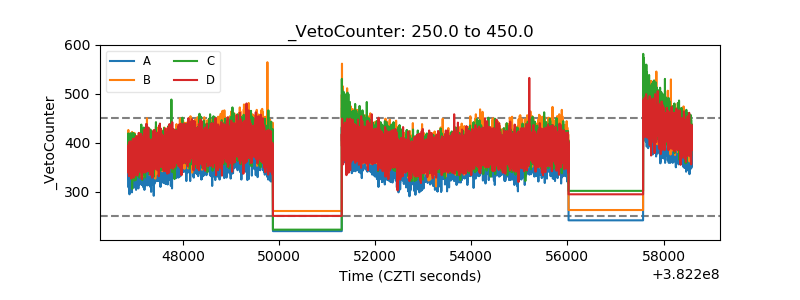 |