| Param | Original file | Final file |
|---|---|---|
| Filename | modeM0/AS1A10_058T06_9000004920_34456cztM0_level2.evt | modeM0/AS1A10_058T06_9000004920_34456cztM0_level2_quad_clean.evt |
| Size (bytes) | 433,923,840 | 62,648,640 |
| Size | 413.8 MB | 59.7 MB |
| Events in quadrant A | 2,480,230 | 392,464 |
| Events in quadrant B | 3,051,853 | 399,570 |
| Events in quadrant C | 2,542,186 | 393,573 |
| Events in quadrant D | 4,732,588 | 365,573 |
| Mode SS | |||
|---|---|---|---|
| Quadrant | BADHDUFLAG | Total packets | Discarded packets |
| A | 0 | 100 | 0 |
| B | 0 | 100 | 0 |
| C | 0 | 100 | 0 |
| D | 0 | 100 | 0 |
| Mode M0 | |||
|---|---|---|---|
| Quadrant | BADHDUFLAG | Total packets | Discarded packets |
| A | 0 | 10610 | 2 |
| B | 0 | 12356 | 1 |
| C | 0 | 10552 | 1 |
| D | 0 | 17577 | 1 |
| Mode M9 | |||
|---|---|---|---|
| Quadrant | BADHDUFLAG | Total packets | Discarded packets |
| A | 0 | 15 | 0 |
| B | 0 | 15 | 0 |
| C | 0 | 15 | 0 |
| D | 0 | 15 | 0 |
| Quadrant | Total seconds | Saturated seconds | Saturation percentage |
|---|---|---|---|
| A | 4931 | 68 | 1.379031% |
| B | 4931 | 159 | 3.224498% |
| C | 4931 | 5 | 0.101399% |
| D | 4931 | 168 | 3.407017% |
Noise dominated data is calculated using 1-second bins in cleaned event files. If a bin has >2000 counts, and if more than 50% of those come from <1% of pixels, then it is considered to be noise-dominated and hence unusable.
| Quadrant | # 1 sec bins | Bins with >0 counts | Bins with >2000 counts | High rate bins dominated by noise | Noise dominated (total time) | Noise dominated (detector-on time) | Marked lightcurve |
|---|---|---|---|---|---|---|---|
| A | 6452 | 4932 | 51 | 51 | 0.79% | 1.03% | 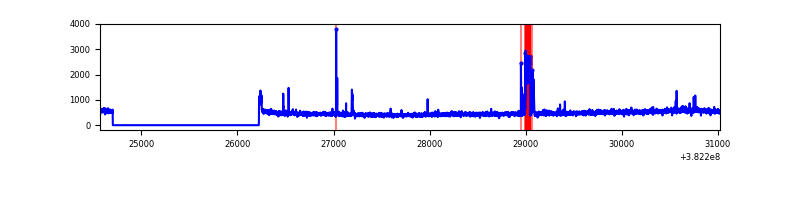 |
| B | 6452 | 4932 | 92 | 92 | 1.43% | 1.87% | 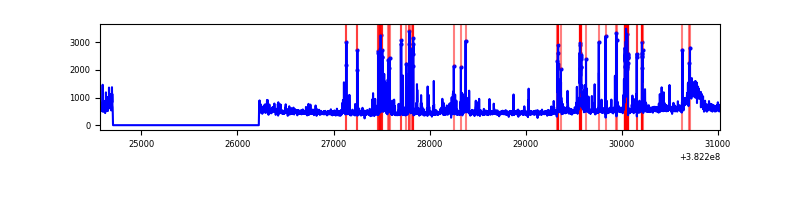 |
| C | 6452 | 4932 | 0 | 0 | 0.00% | 0.00% | 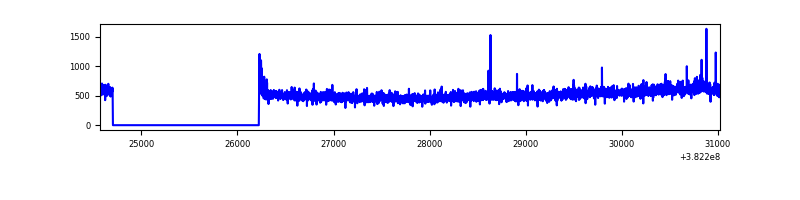 |
| D | 6452 | 4932 | 170 | 170 | 2.63% | 3.45% | 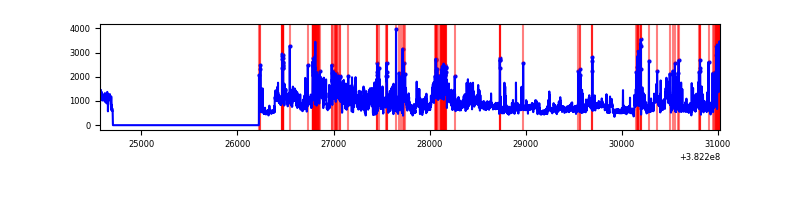 |
Top three noisy pixels from each quadrant. If the there are fewer than three noisy pixels in the level2.evt file, extra rows are filled as -1
| Pixel properties | Quadrant properties | ||||||
|---|---|---|---|---|---|---|---|
| Quadrant | DetID | PixID | Counts | Sigma | Mean | Median | Sigma |
| A | 15 | 169 | 192955 | 1607.12 | 584 | 571 | 119.7 |
| A | 10 | 83 | 21409 | 174.07 | 584 | 571 | 119.7 |
| A | 13 | 254 | 8810 | 68.83 | 584 | 571 | 119.7 |
| B | 5 | 172 | 496234 | 4407.46 | 580 | 565 | 112.5 |
| B | 14 | 207 | 111140 | 983.23 | 580 | 565 | 112.5 |
| B | 4 | 171 | 38953 | 341.34 | 580 | 565 | 112.5 |
| C | 15 | 214 | 205172 | 1533.39 | 575 | 578 | 133.4 |
| C | 3 | 233 | 41547 | 307.05 | 575 | 578 | 133.4 |
| C | 14 | 67 | 27101 | 198.78 | 575 | 578 | 133.4 |
| D | 14 | 52 | 942267 | 6769.33 | 566 | 548 | 139.1 |
| D | 8 | 195 | 850715 | 6111.23 | 566 | 548 | 139.1 |
| D | 7 | 80 | 208584 | 1495.42 | 566 | 548 | 139.1 |
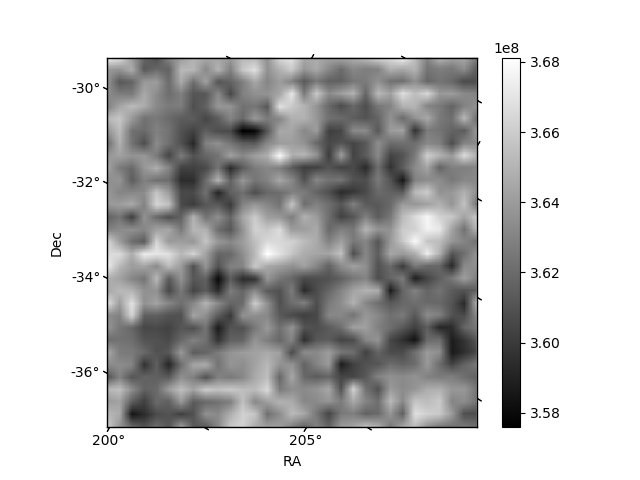
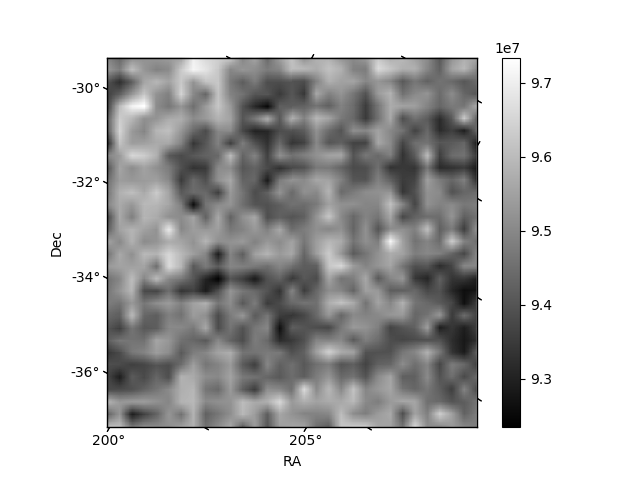
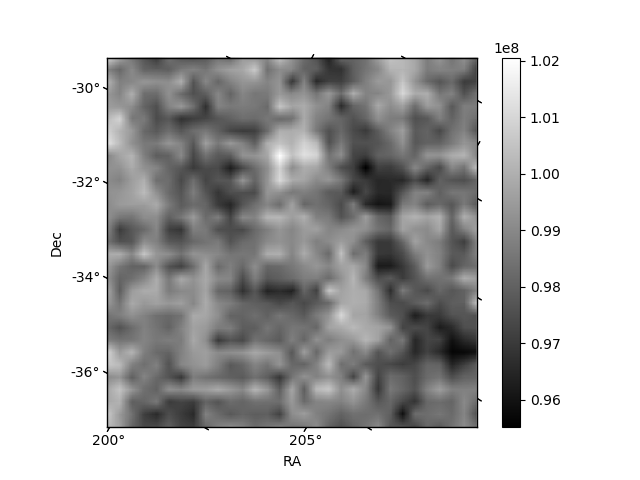
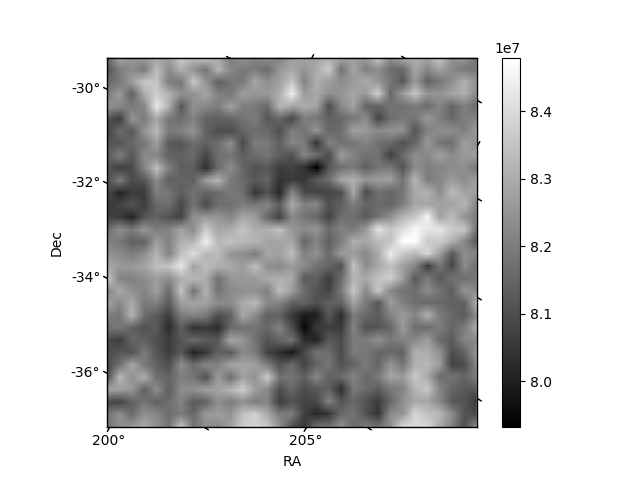
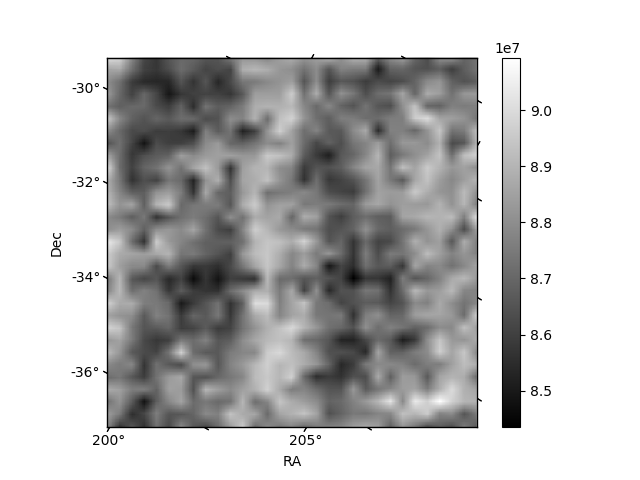
Histogram calculated using DETX and DETY for each event in the final _common_clean file
| Quadrant A | 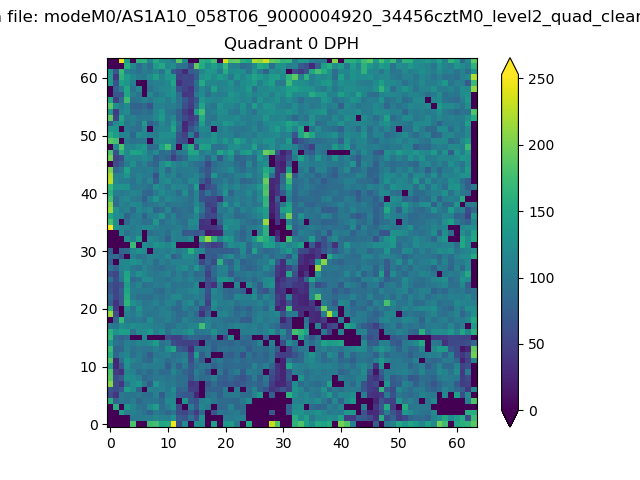 |
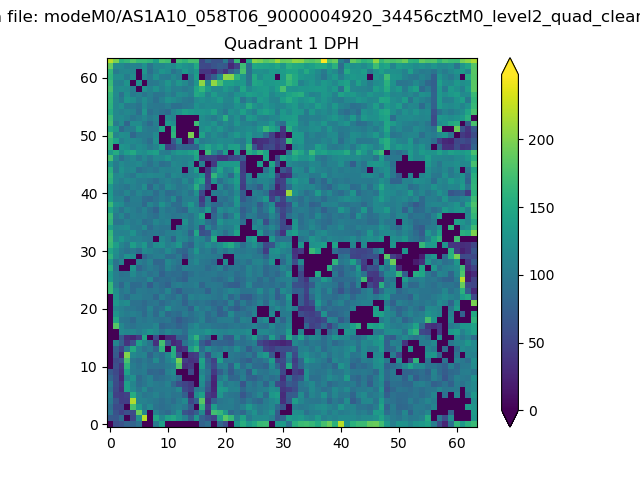 |
Quadrant B |
|---|---|---|---|
| Quadrant D | 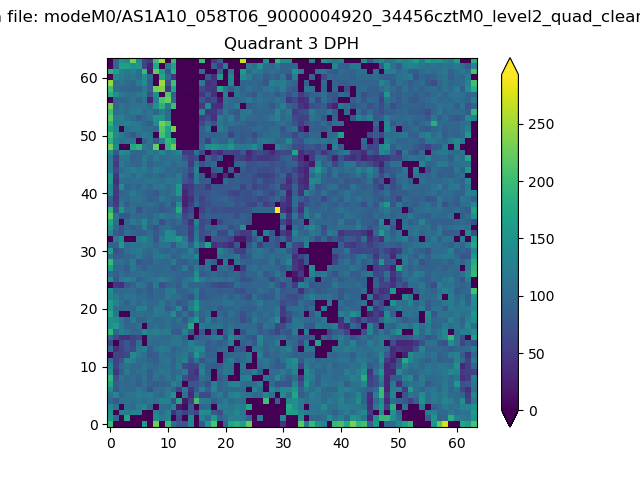 |
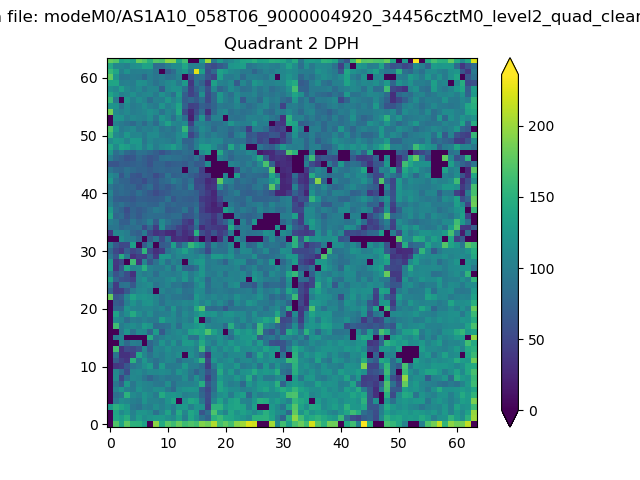 |
Quadrant C |
| Plot type | Count rate plots | Images |
|---|---|---|
| Comparison with Poisson distribution Blue bars denote a histogram of data divided into 1 sec bins. Red curve is a Poisson curve with rate = median count rate of data. |
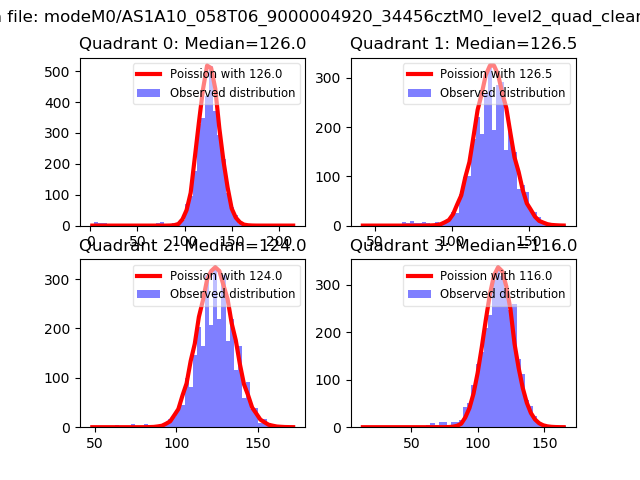 |
 |
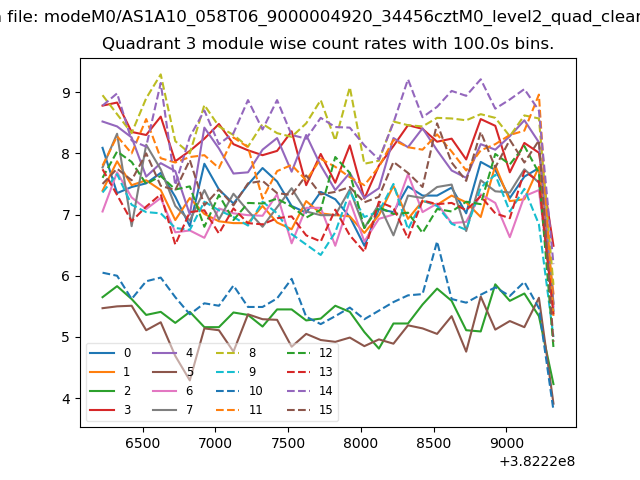
| Quadrant-wise count rates Data is divided into 100 sec bins |
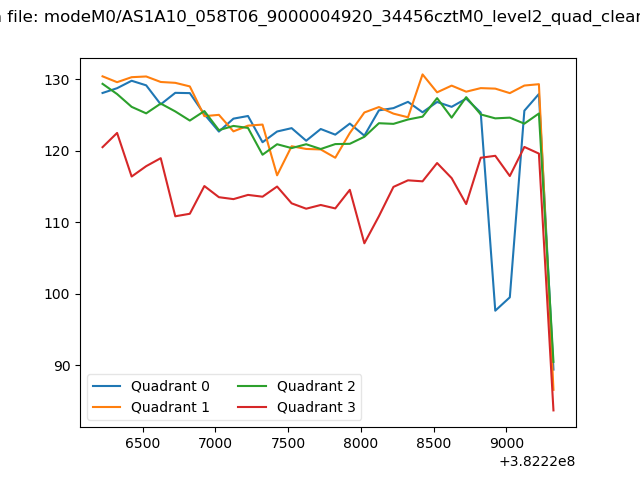 |
|
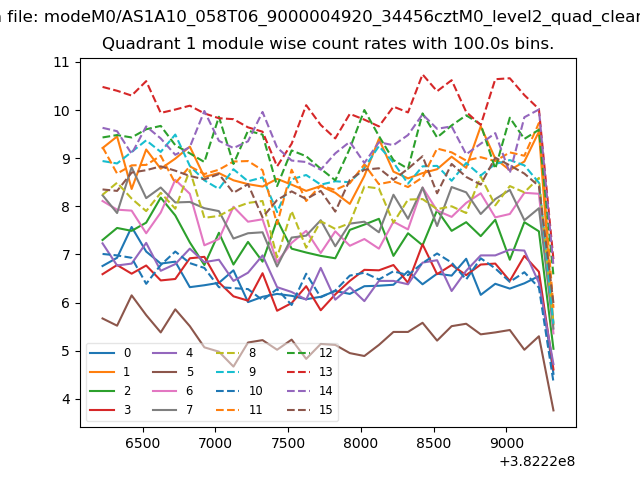
| Module-wise count rates for Quadrant A Data is divided into 100 sec bins |
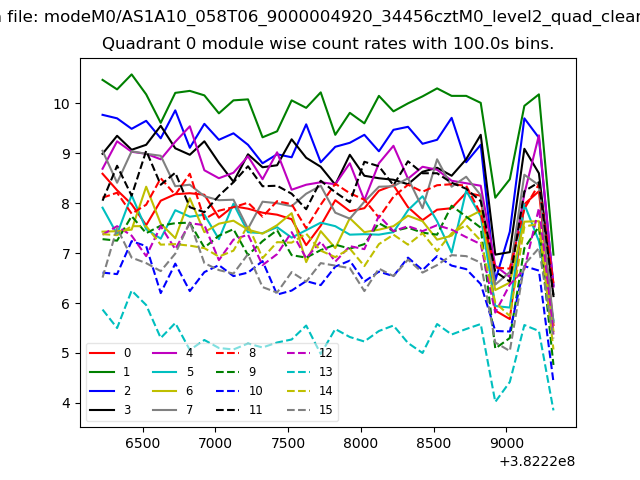 |
 |
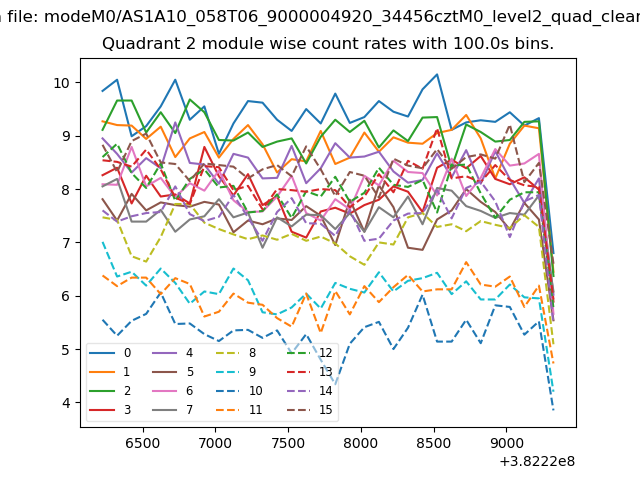
| Module-wise count rates for Quadrant B Data is divided into 100 sec bins |
 |
 |
| Module-wise count rates for Quadrant C Data is divided into 100 sec bins |
 |
 |
| Module-wise count rates for Quadrant D Data is divided into 100 sec bins |
 |
 |
| Parameter | Plot |
|---|---|
| CZT HV Monitor | 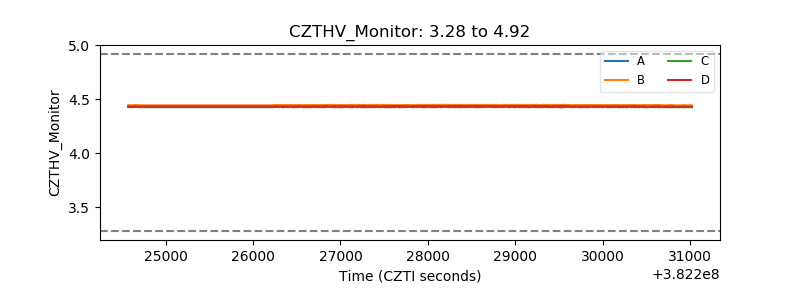 |
| D_VDD | 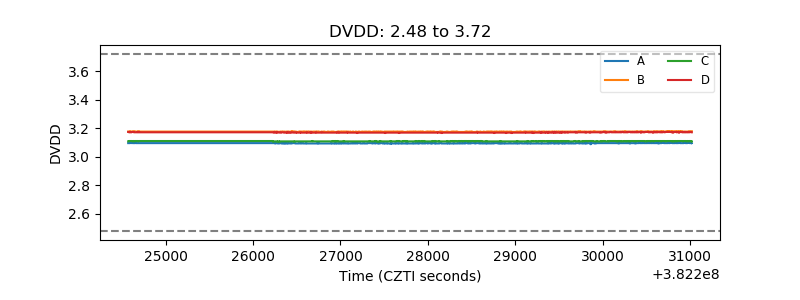 |
| Temperature 1 | 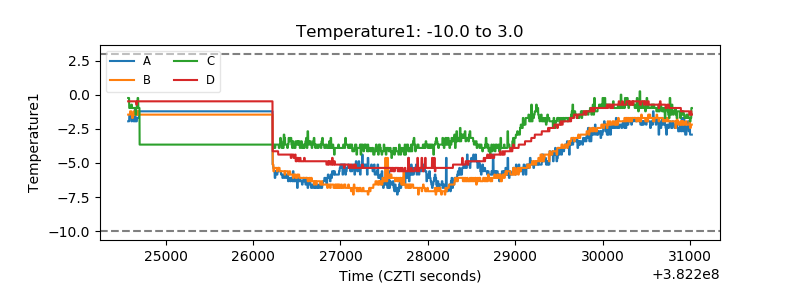 |
| Veto HV Monitor | 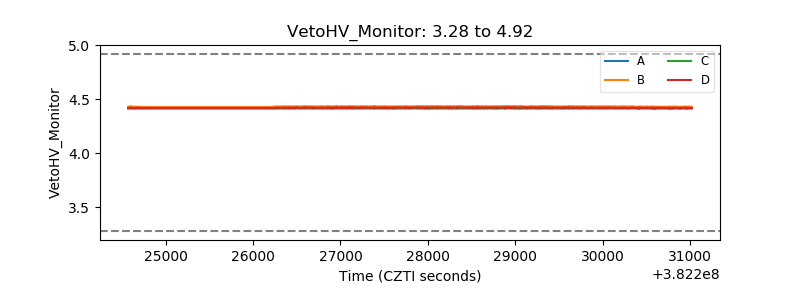 |
| Veto LLD | 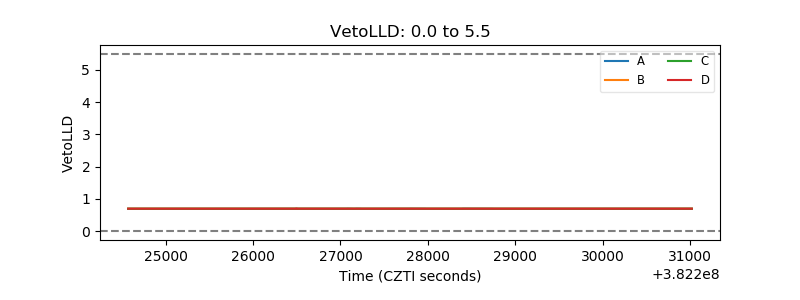 |
| Alpha Counter | 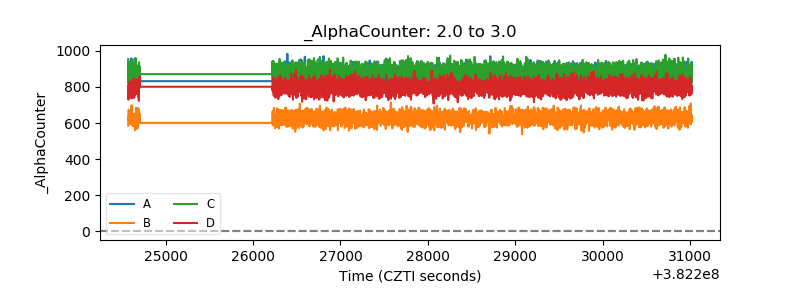 |
| _CPM_Rate | 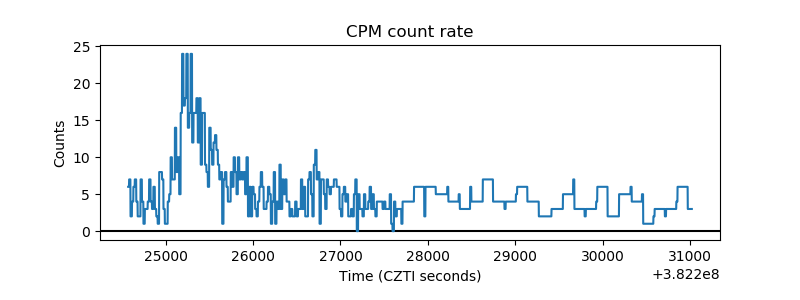 |
| CZT Counter | 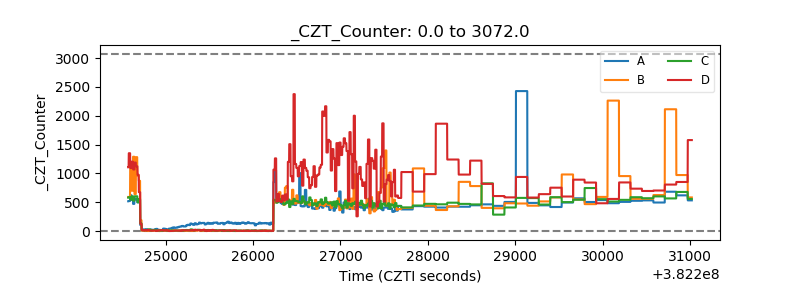 |
| +2.5 Volts monitor | 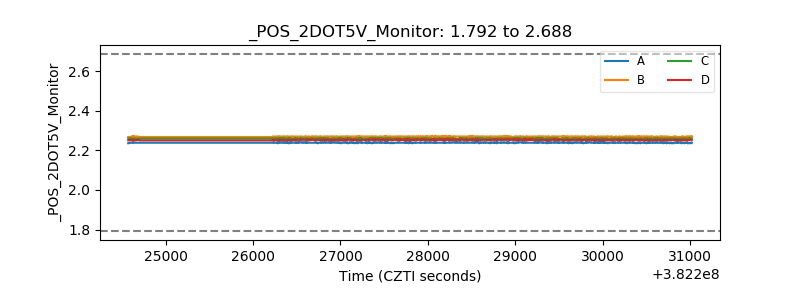 |
| +5 Volts monitor | 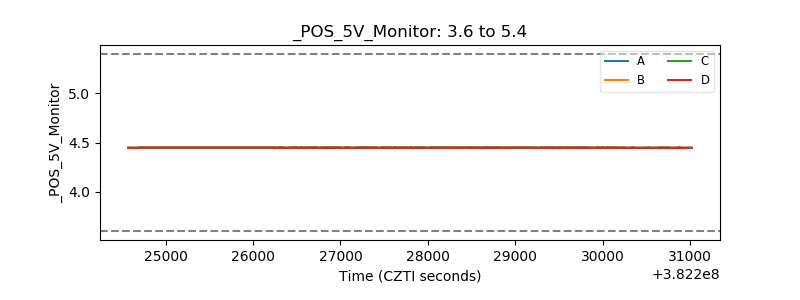 |
| _ROLL_ROT | 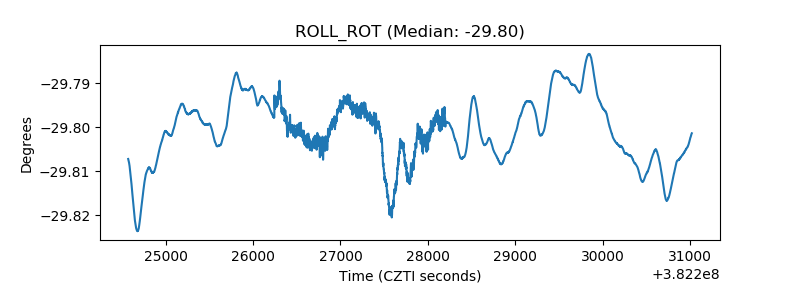 |
| _Roll_DEC | 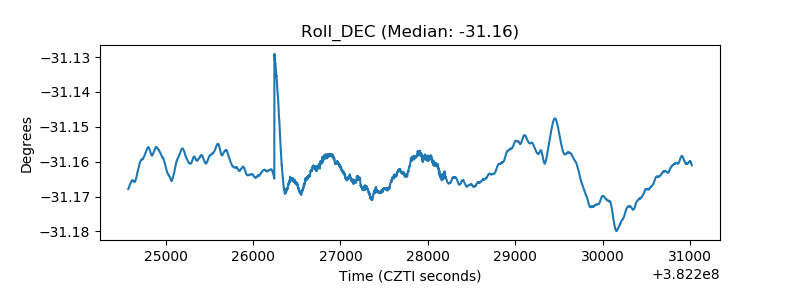 |
| _Roll_RA | 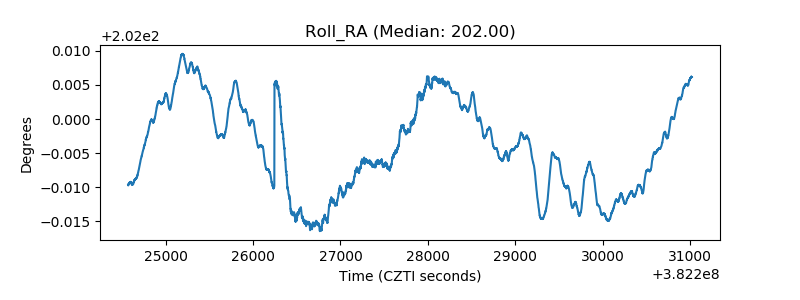 |
| Veto Counter | 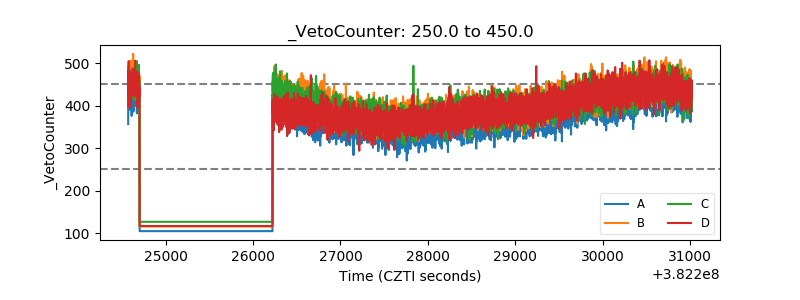 |