| Param | Original file | Final file |
|---|---|---|
| Filename | modeM0/AS1A10_058T06_9000004920_34455cztM0_level2.evt | modeM0/AS1A10_058T06_9000004920_34455cztM0_level2_quad_clean.evt |
| Size (bytes) | 600,269,760 | 84,381,120 |
| Size | 572.5 MB | 80.5 MB |
| Events in quadrant A | 2,690,560 | 577,514 |
| Events in quadrant B | 3,601,273 | 571,616 |
| Events in quadrant C | 4,818,561 | 518,118 |
| Events in quadrant D | 6,686,120 | 491,825 |
| Mode SS | |||
|---|---|---|---|
| Quadrant | BADHDUFLAG | Total packets | Discarded packets |
| A | 0 | 116 | 0 |
| B | 0 | 116 | 0 |
| C | 0 | 116 | 0 |
| D | 0 | 116 | 0 |
| Mode M0 | |||
|---|---|---|---|
| Quadrant | BADHDUFLAG | Total packets | Discarded packets |
| A | 0 | 11685 | 3 |
| B | 0 | 14364 | 2 |
| C | 0 | 17753 | 2 |
| D | 0 | 23782 | 2 |
| Mode M9 | |||
|---|---|---|---|
| Quadrant | BADHDUFLAG | Total packets | Discarded packets |
| A | 0 | 22 | 0 |
| B | 0 | 22 | 0 |
| C | 0 | 22 | 0 |
| D | 0 | 23 | 0 |
| Quadrant | Total seconds | Saturated seconds | Saturation percentage |
|---|---|---|---|
| A | 5653 | 10 | 0.176897% |
| B | 5653 | 310 | 5.483814% |
| C | 5653 | 697 | 12.329736% |
| D | 5653 | 780 | 13.797983% |
Noise dominated data is calculated using 1-second bins in cleaned event files. If a bin has >2000 counts, and if more than 50% of those come from <1% of pixels, then it is considered to be noise-dominated and hence unusable.
| Quadrant | # 1 sec bins | Bins with >0 counts | Bins with >2000 counts | High rate bins dominated by noise | Noise dominated (total time) | Noise dominated (detector-on time) | Marked lightcurve |
|---|---|---|---|---|---|---|---|
| A | 7174 | 5654 | 1 | 1 | 0.01% | 0.02% | 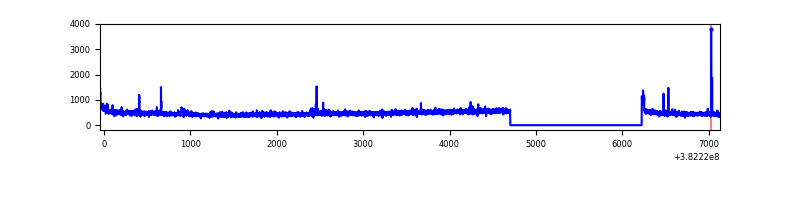 |
| B | 7174 | 5654 | 225 | 225 | 3.14% | 3.98% | 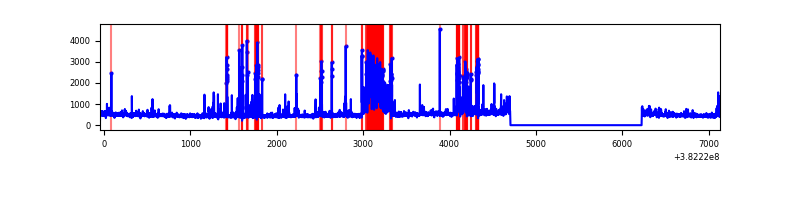 |
| C | 7174 | 5654 | 602 | 602 | 8.39% | 10.65% | 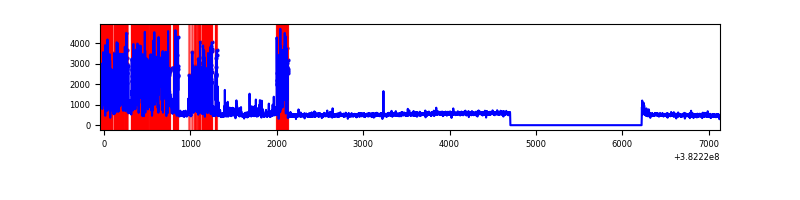 |
| D | 7174 | 5654 | 758 | 758 | 10.57% | 13.41% | 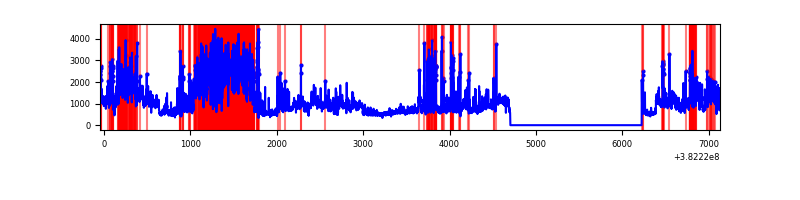 |
Top three noisy pixels from each quadrant. If the there are fewer than three noisy pixels in the level2.evt file, extra rows are filled as -1
| Pixel properties | Quadrant properties | ||||||
|---|---|---|---|---|---|---|---|
| Quadrant | DetID | PixID | Counts | Sigma | Mean | Median | Sigma |
| A | 15 | 169 | 42331 | 308.11 | 668 | 655 | 135.3 |
| A | 10 | 83 | 36971 | 268.48 | 668 | 655 | 135.3 |
| A | 12 | 227 | 14685 | 103.72 | 668 | 655 | 135.3 |
| B | 5 | 172 | 848767 | 6728.48 | 653 | 637 | 126.1 |
| B | 4 | 171 | 65045 | 510.97 | 653 | 637 | 126.1 |
| B | 0 | 229 | 54749 | 429.29 | 653 | 637 | 126.1 |
| C | 4 | 254 | 2107718 | 14656.65 | 615 | 622 | 143.8 |
| C | 15 | 214 | 224962 | 1560.48 | 615 | 622 | 143.8 |
| C | 3 | 233 | 47254 | 324.37 | 615 | 622 | 143.8 |
| D | 7 | 80 | 1478378 | 9765.86 | 613 | 596 | 151.3 |
| D | 8 | 195 | 1466393 | 9686.65 | 613 | 596 | 151.3 |
| D | 12 | 235 | 578546 | 3819.36 | 613 | 596 | 151.3 |
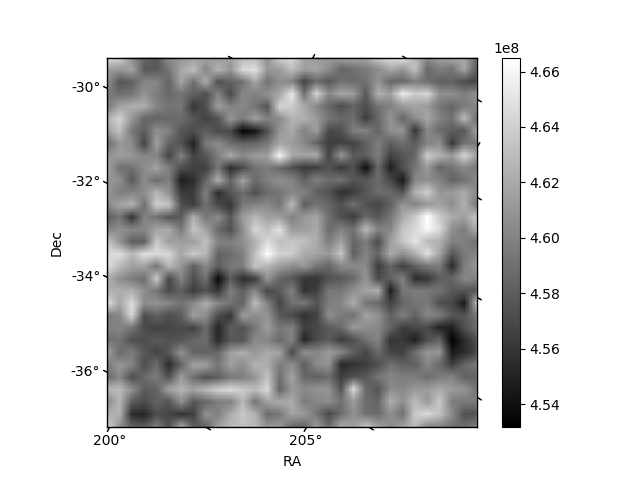
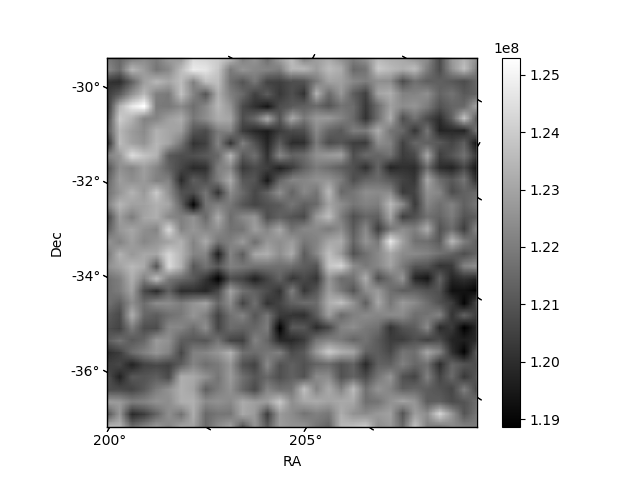
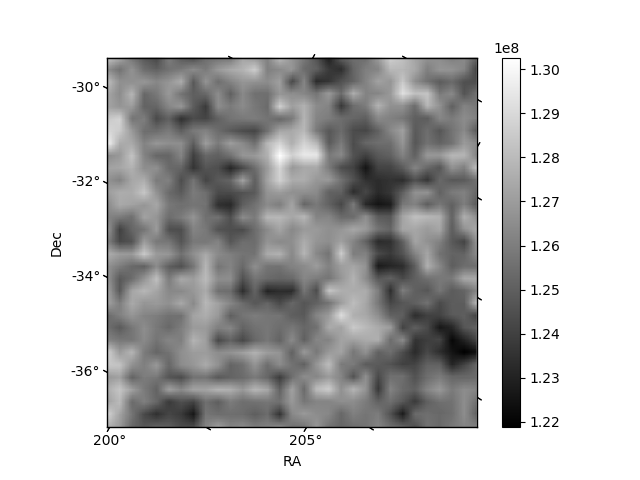
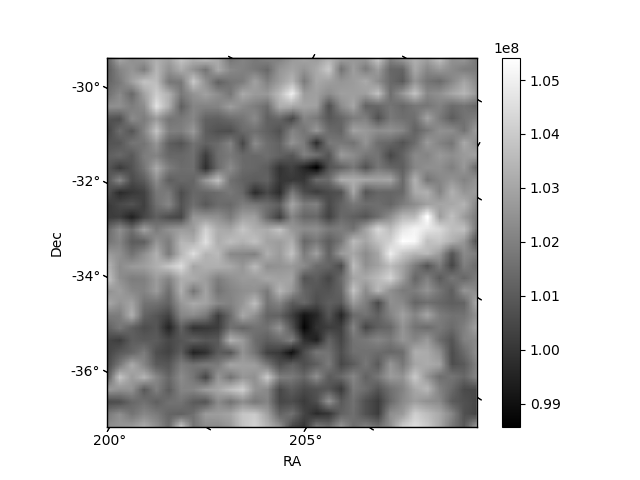
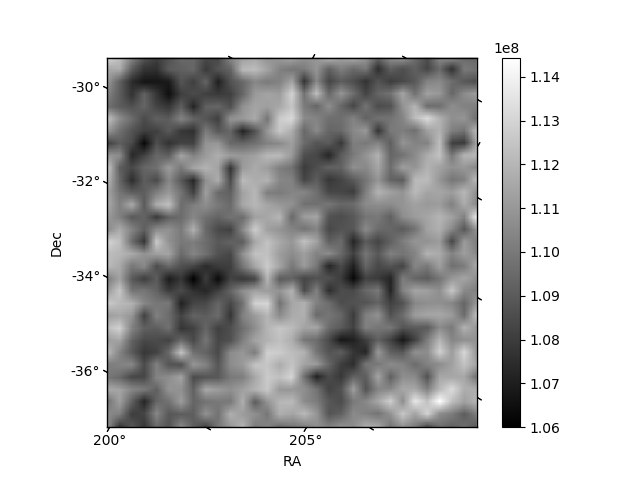
Histogram calculated using DETX and DETY for each event in the final _common_clean file
| Quadrant A | 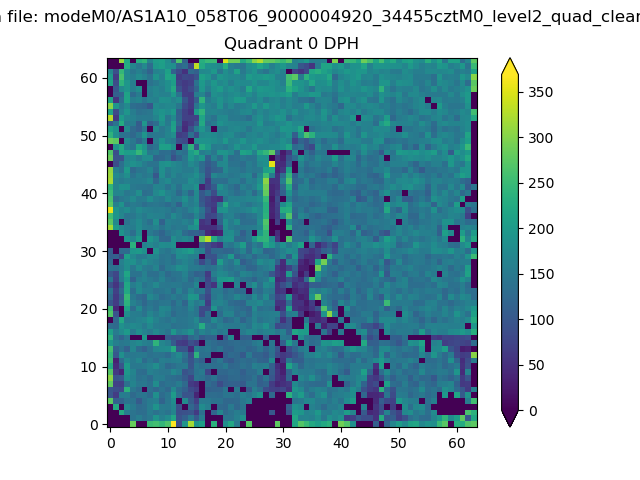 |
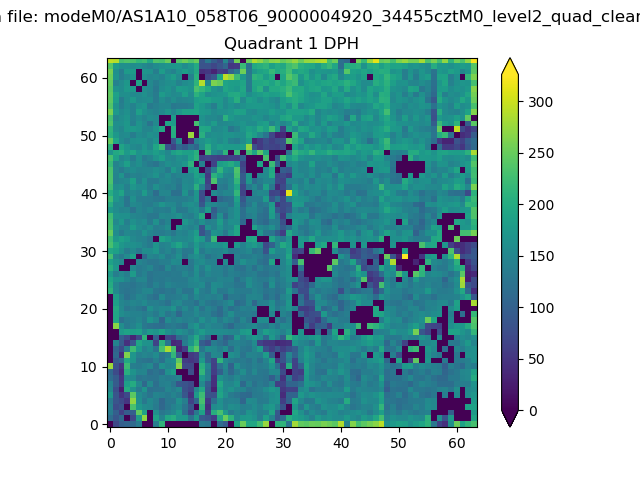 |
Quadrant B |
|---|---|---|---|
| Quadrant D | 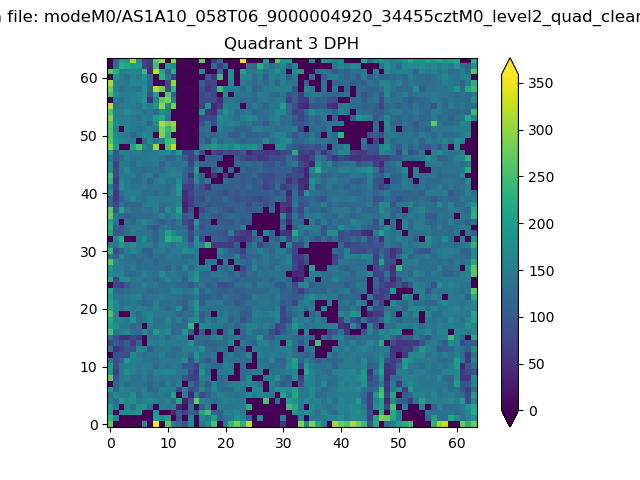 |
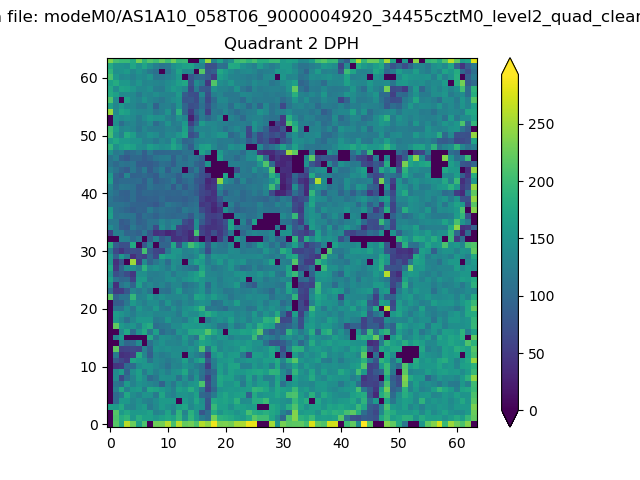 |
Quadrant C |
| Plot type | Count rate plots | Images |
|---|---|---|
| Comparison with Poisson distribution Blue bars denote a histogram of data divided into 1 sec bins. Red curve is a Poisson curve with rate = median count rate of data. |
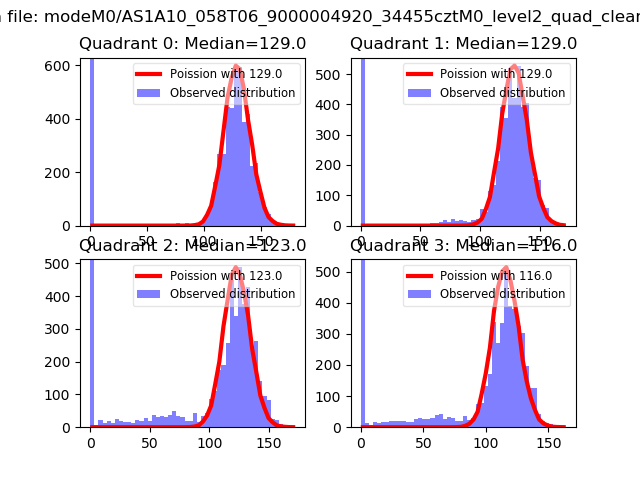 |
 |
| Quadrant-wise count rates Data is divided into 100 sec bins |
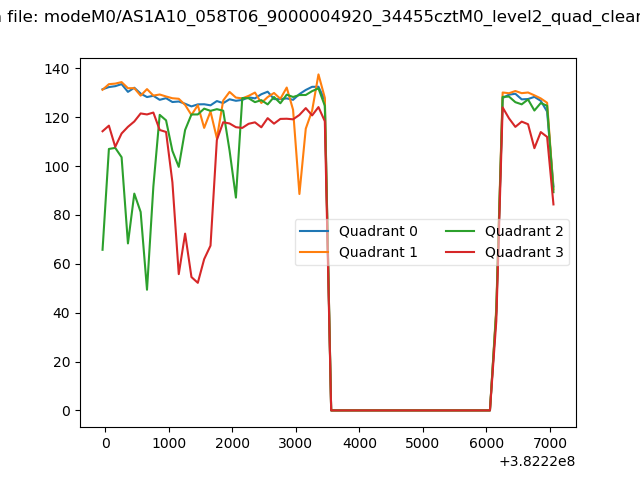 |
|
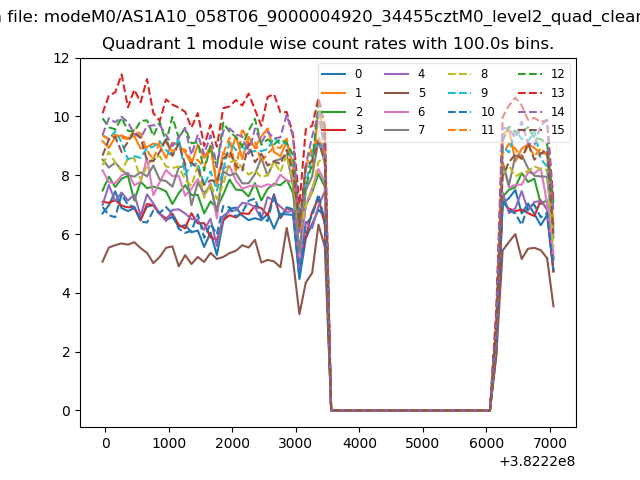
| Module-wise count rates for Quadrant A Data is divided into 100 sec bins |
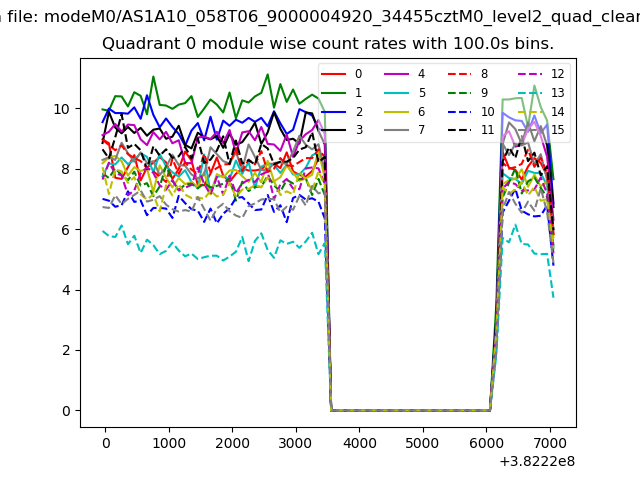 |
 |
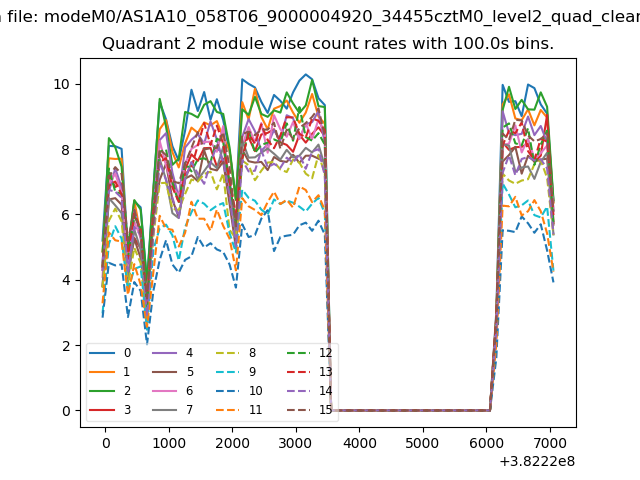
| Module-wise count rates for Quadrant B Data is divided into 100 sec bins |
 |
 |
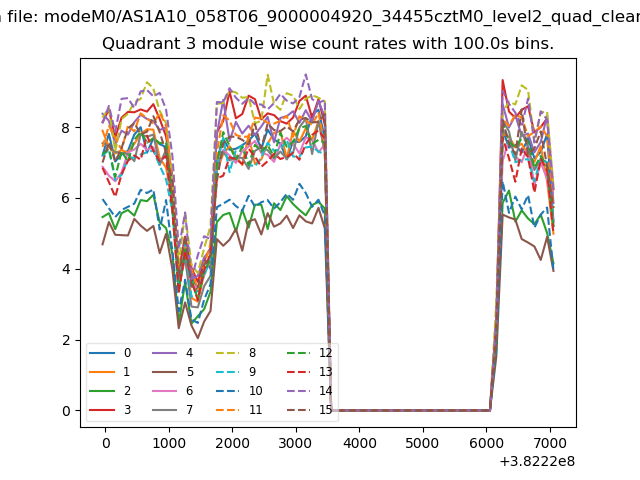
| Module-wise count rates for Quadrant C Data is divided into 100 sec bins |
 |
 |
| Module-wise count rates for Quadrant D Data is divided into 100 sec bins |
 |
 |
| Parameter | Plot |
|---|---|
| CZT HV Monitor | 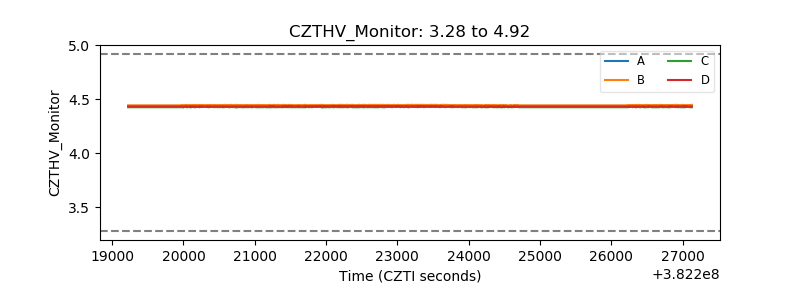 |
| D_VDD | 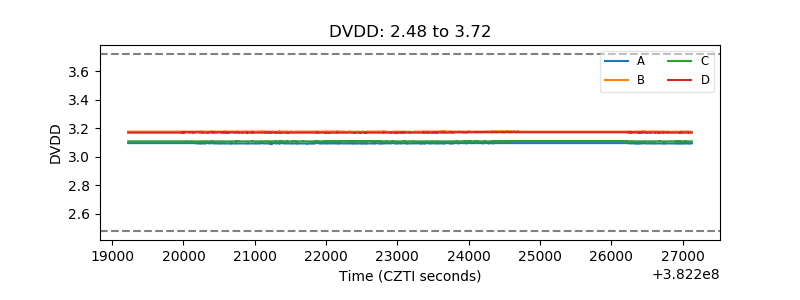 |
| Temperature 1 | 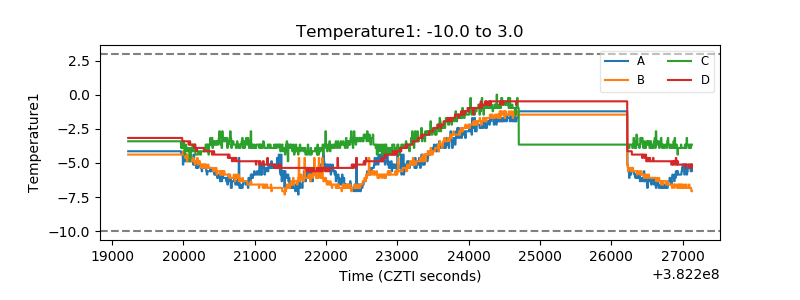 |
| Veto HV Monitor | 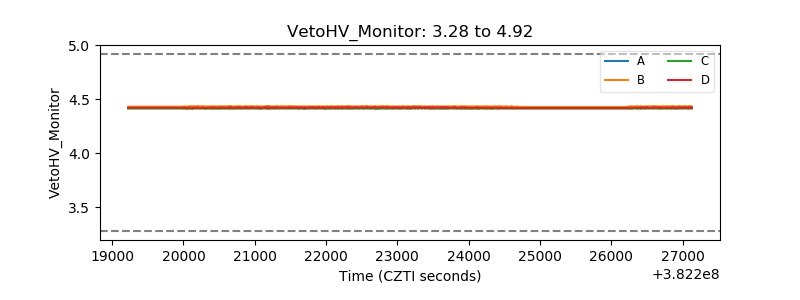 |
| Veto LLD | 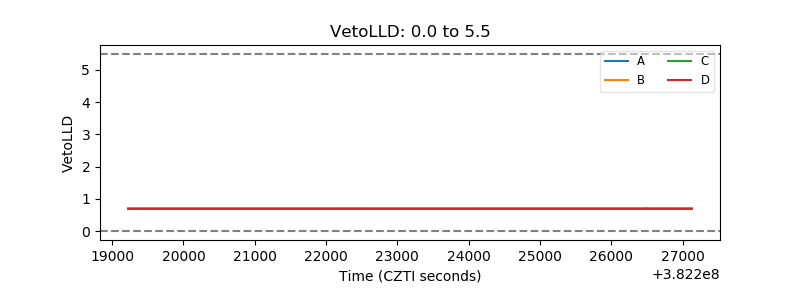 |
| Alpha Counter |  |
| _CPM_Rate | 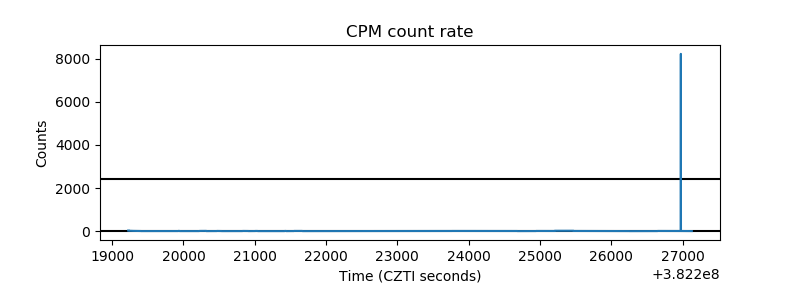 |
| CZT Counter | 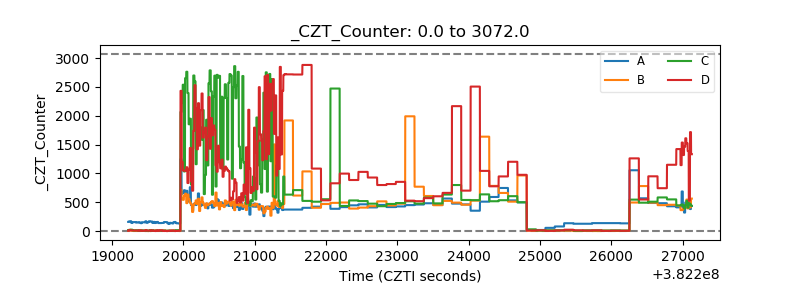 |
| +2.5 Volts monitor | 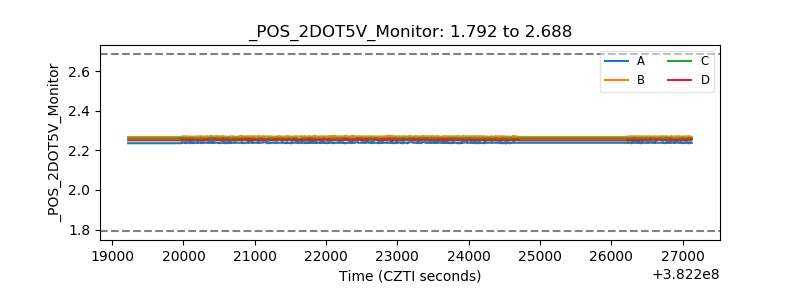 |
| +5 Volts monitor | 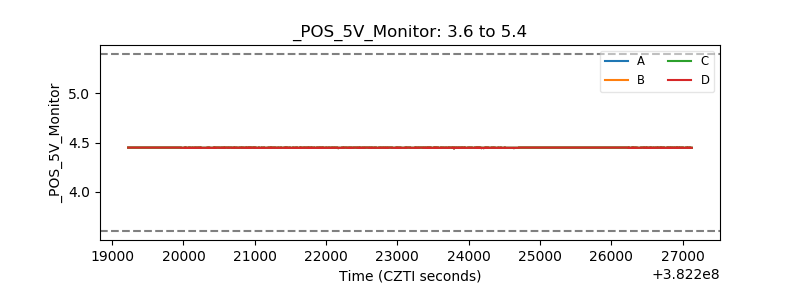 |
| _ROLL_ROT |  |
| _Roll_DEC | 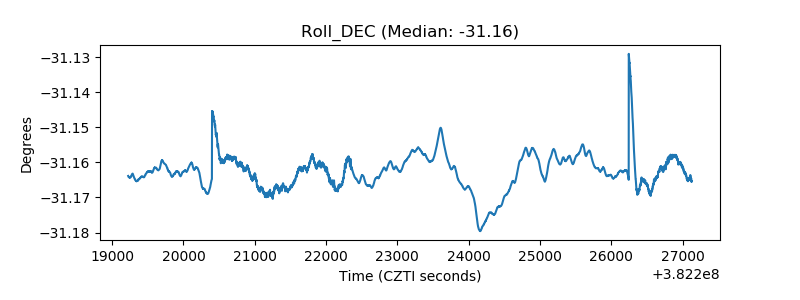 |
| _Roll_RA | 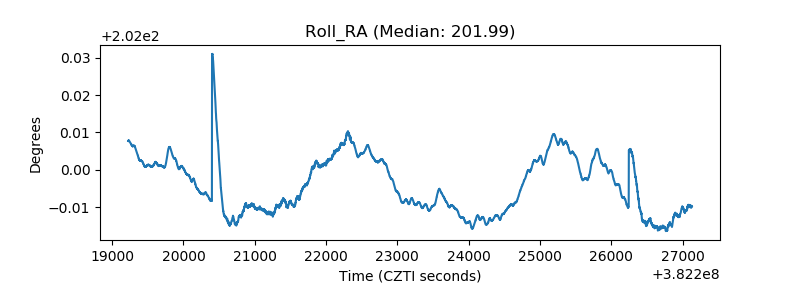 |
| Veto Counter | 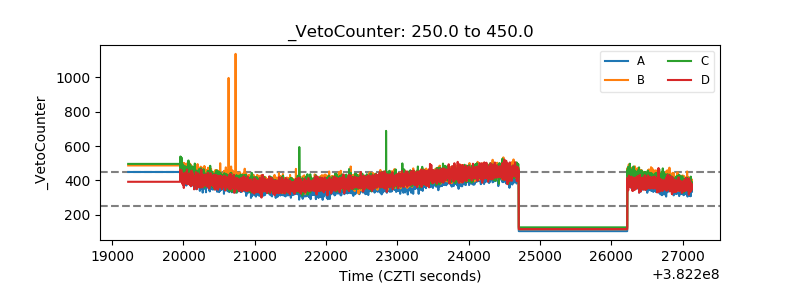 |