| Param | Original file | Final file |
|---|---|---|
| Filename | modeM0/AS1A10_058T06_9000004920_34454cztM0_level2.evt | modeM0/AS1A10_058T06_9000004920_34454cztM0_level2_quad_clean.evt |
| Size (bytes) | 567,368,640 | 86,932,800 |
| Size | 541.1 MB | 82.9 MB |
| Events in quadrant A | 2,528,954 | 603,736 |
| Events in quadrant B | 2,981,299 | 604,513 |
| Events in quadrant C | 6,227,653 | 522,324 |
| Events in quadrant D | 5,088,305 | 532,525 |
| Mode SS | |||
|---|---|---|---|
| Quadrant | BADHDUFLAG | Total packets | Discarded packets |
| A | 0 | 106 | 0 |
| B | 0 | 106 | 0 |
| C | 0 | 106 | 0 |
| D | 0 | 106 | 0 |
| Mode M0 | |||
|---|---|---|---|
| Quadrant | BADHDUFLAG | Total packets | Discarded packets |
| A | 0 | 10896 | 3 |
| B | 0 | 12212 | 2 |
| C | 0 | 22210 | 2 |
| D | 0 | 18776 | 2 |
| Mode M9 | |||
|---|---|---|---|
| Quadrant | BADHDUFLAG | Total packets | Discarded packets |
| A | 0 | 21 | 0 |
| B | 0 | 21 | 0 |
| C | 0 | 21 | 0 |
| D | 0 | 22 | 0 |
| Quadrant | Total seconds | Saturated seconds | Saturation percentage |
|---|---|---|---|
| A | 5275 | 8 | 0.151659% |
| B | 5275 | 116 | 2.199052% |
| C | 5275 | 1085 | 20.568720% |
| D | 5275 | 485 | 9.194313% |
Noise dominated data is calculated using 1-second bins in cleaned event files. If a bin has >2000 counts, and if more than 50% of those come from <1% of pixels, then it is considered to be noise-dominated and hence unusable.
| Quadrant | # 1 sec bins | Bins with >0 counts | Bins with >2000 counts | High rate bins dominated by noise | Noise dominated (total time) | Noise dominated (detector-on time) | Marked lightcurve |
|---|---|---|---|---|---|---|---|
| A | 7128 | 5276 | 2 | 2 | 0.03% | 0.04% | 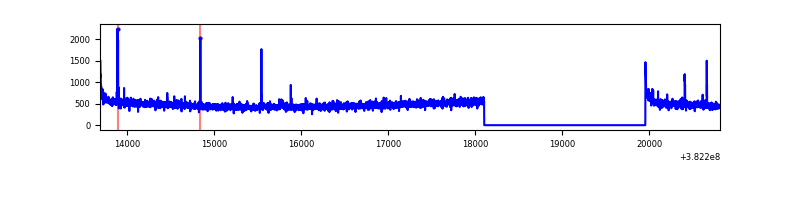 |
| B | 7128 | 5276 | 67 | 67 | 0.94% | 1.27% | 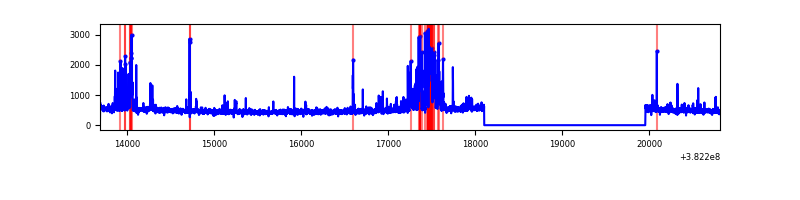 |
| C | 7128 | 5276 | 916 | 916 | 12.85% | 17.36% | 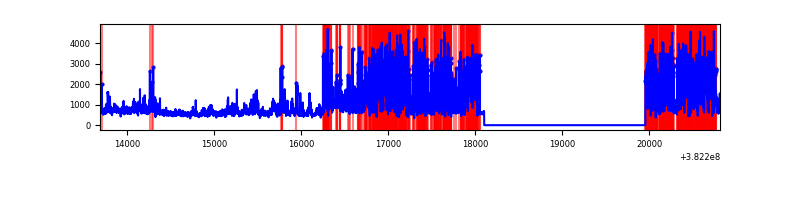 |
| D | 7128 | 5276 | 465 | 465 | 6.52% | 8.81% |  |
Top three noisy pixels from each quadrant. If the there are fewer than three noisy pixels in the level2.evt file, extra rows are filled as -1
| Pixel properties | Quadrant properties | ||||||
|---|---|---|---|---|---|---|---|
| Quadrant | DetID | PixID | Counts | Sigma | Mean | Median | Sigma |
| A | 10 | 83 | 36864 | 287.77 | 632 | 620 | 125.9 |
| A | 15 | 169 | 21431 | 165.23 | 632 | 620 | 125.9 |
| A | 12 | 227 | 9063 | 67.04 | 632 | 620 | 125.9 |
| B | 5 | 172 | 415095 | 3454.86 | 628 | 612 | 120.0 |
| B | 0 | 229 | 25923 | 210.98 | 628 | 612 | 120.0 |
| B | 5 | 255 | 21653 | 175.38 | 628 | 612 | 120.0 |
| C | 4 | 254 | 3794564 | 29310.07 | 557 | 562 | 129.4 |
| C | 15 | 214 | 204837 | 1578.1 | 557 | 562 | 129.4 |
| C | 0 | 10 | 30092 | 228.13 | 557 | 562 | 129.4 |
| D | 8 | 195 | 1233827 | 7798.73 | 581 | 570 | 158.1 |
| D | 7 | 80 | 987060 | 6238.26 | 581 | 570 | 158.1 |
| D | 12 | 235 | 248637 | 1568.7 | 581 | 570 | 158.1 |
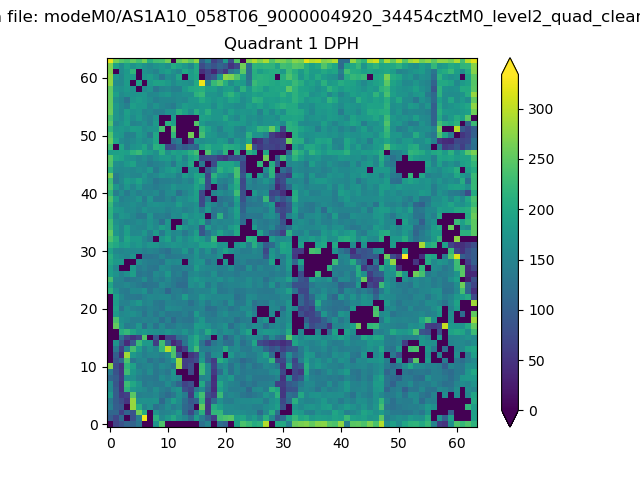
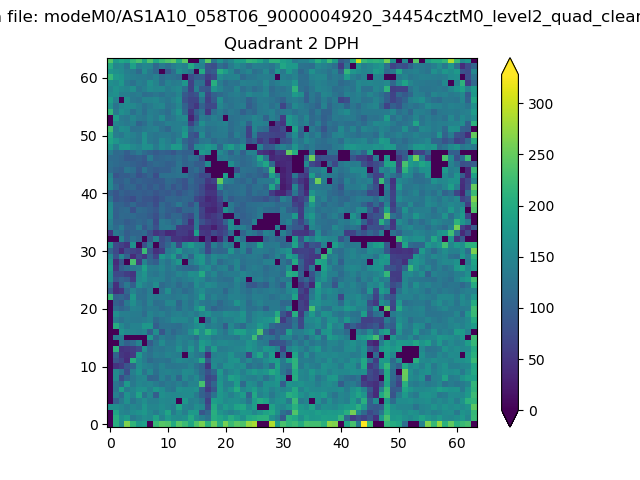
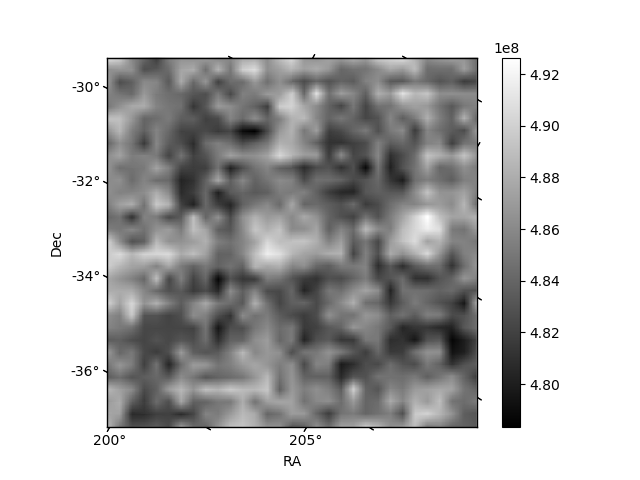
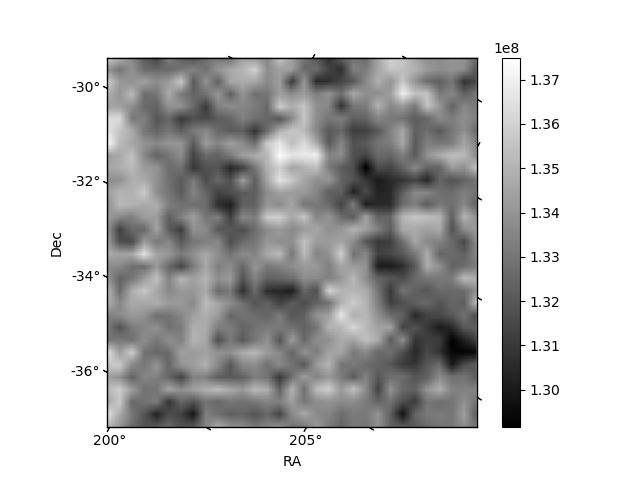
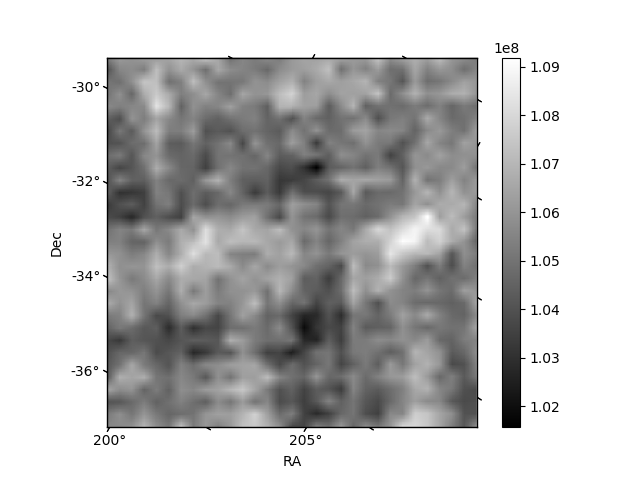
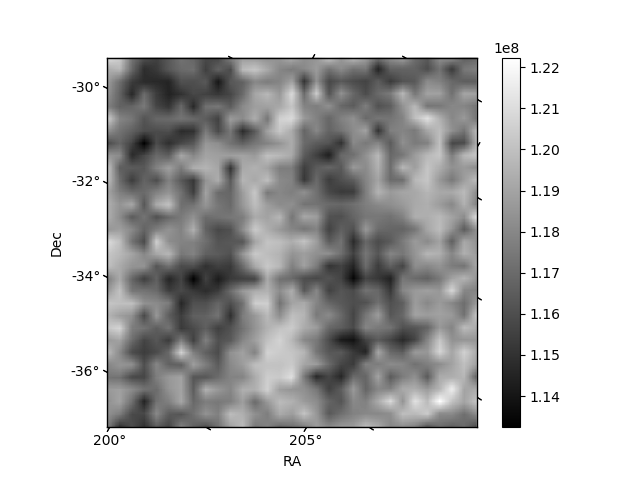
Histogram calculated using DETX and DETY for each event in the final _common_clean file
| Quadrant A | 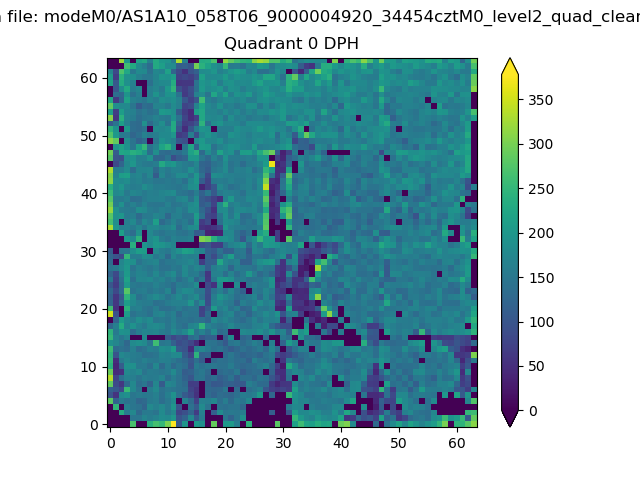 |
 |
Quadrant B |
|---|---|---|---|
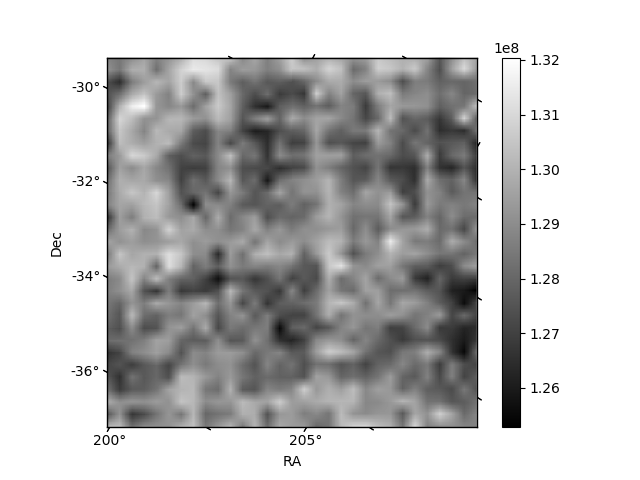
| Quadrant D | 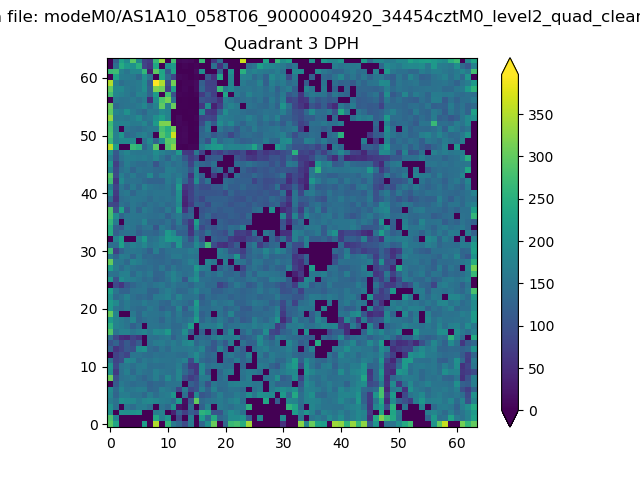 |
 |
Quadrant C |
| Plot type | Count rate plots | Images |
|---|---|---|
| Comparison with Poisson distribution Blue bars denote a histogram of data divided into 1 sec bins. Red curve is a Poisson curve with rate = median count rate of data. |
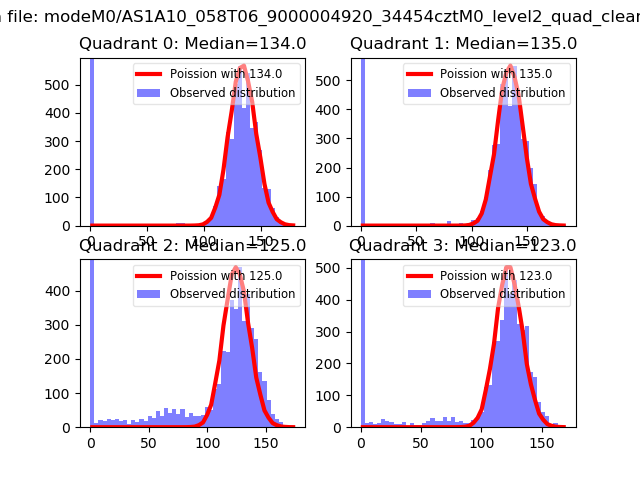 |
 |
| Quadrant-wise count rates Data is divided into 100 sec bins |
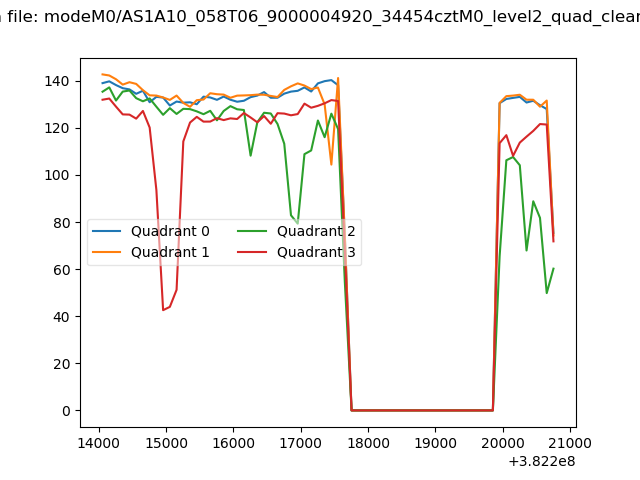 |
|
| Module-wise count rates for Quadrant A Data is divided into 100 sec bins |
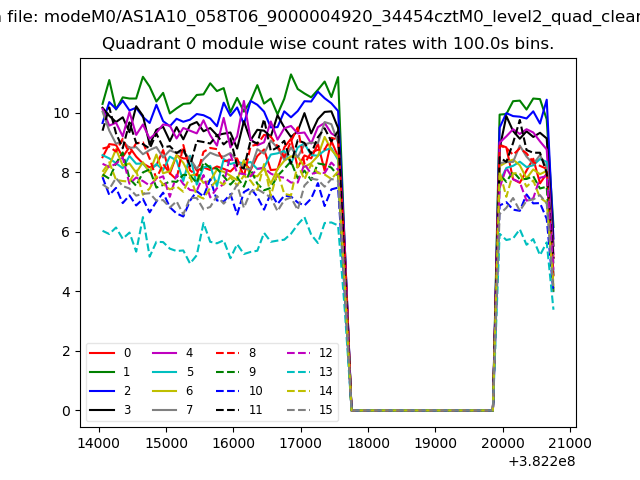 |
 |
| Module-wise count rates for Quadrant B Data is divided into 100 sec bins |
 |
 |
| Module-wise count rates for Quadrant C Data is divided into 100 sec bins |
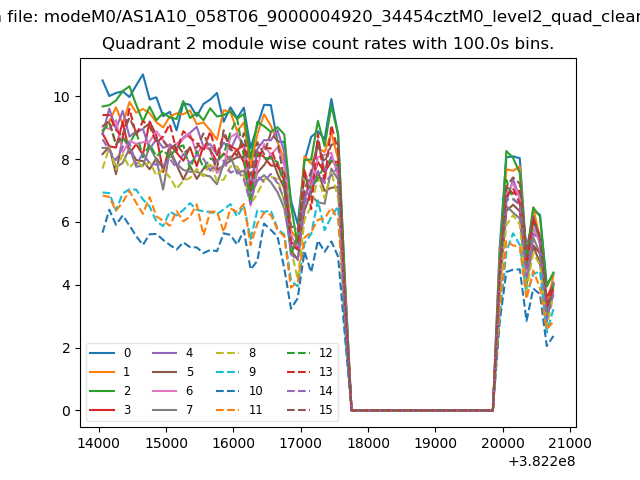 |
 |
| Module-wise count rates for Quadrant D Data is divided into 100 sec bins |
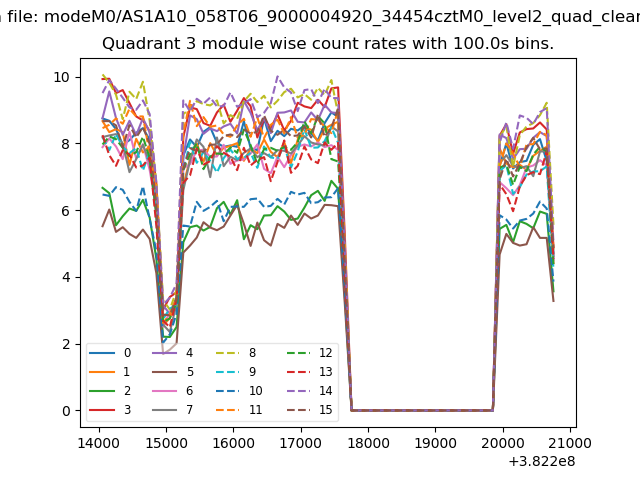 |
 |
| Parameter | Plot |
|---|---|
| CZT HV Monitor | 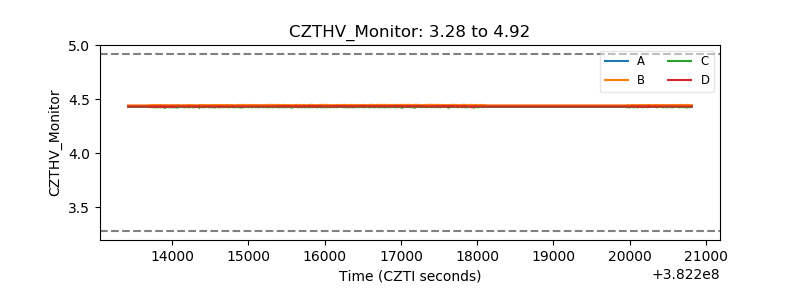 |
| D_VDD | 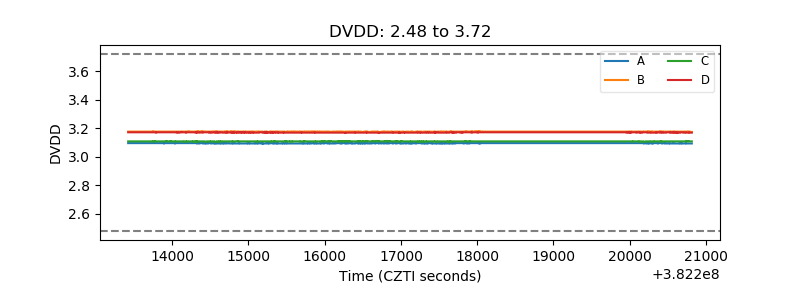 |
| Temperature 1 | 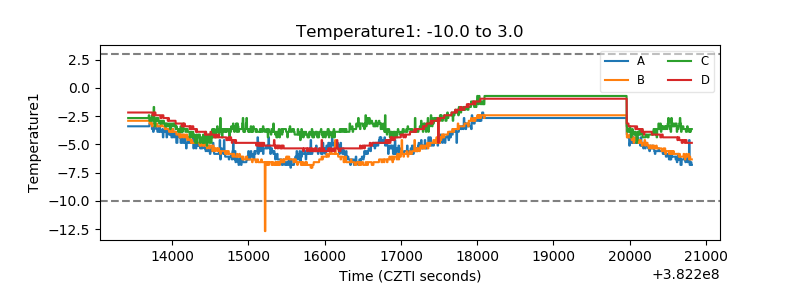 |
| Veto HV Monitor | 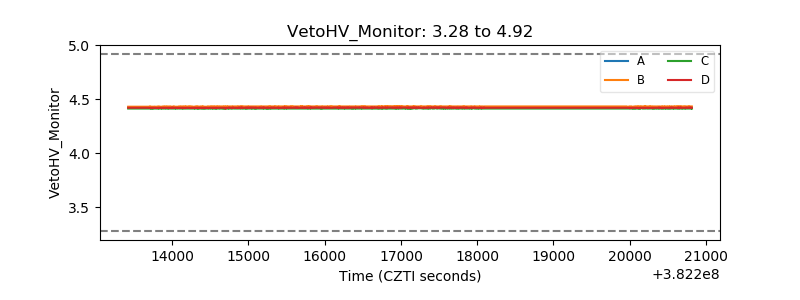 |
| Veto LLD |  |
| Alpha Counter | 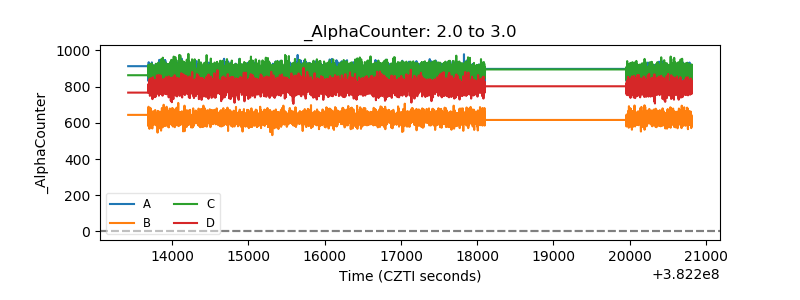 |
| _CPM_Rate | 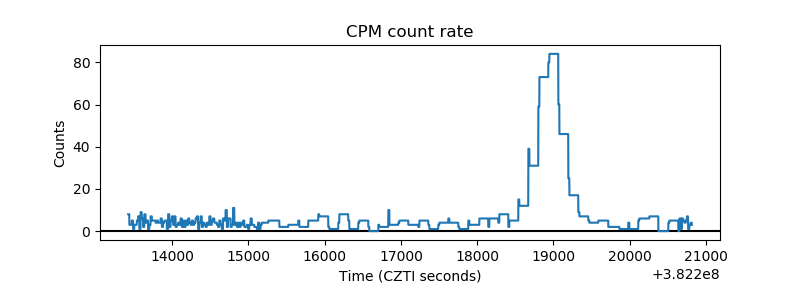 |
| CZT Counter |  |
| +2.5 Volts monitor | 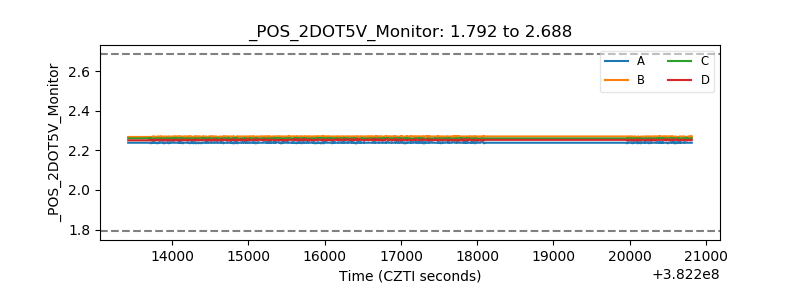 |
| +5 Volts monitor |  |
| _ROLL_ROT | 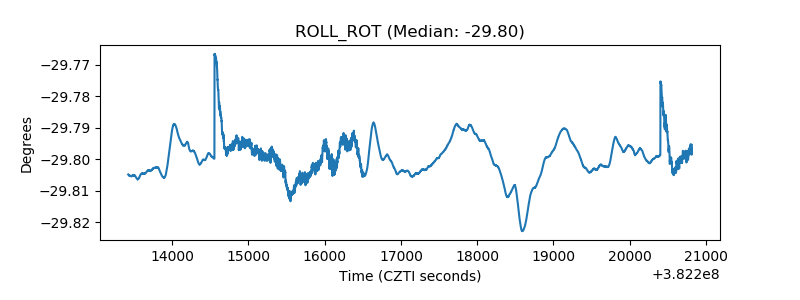 |
| _Roll_DEC | 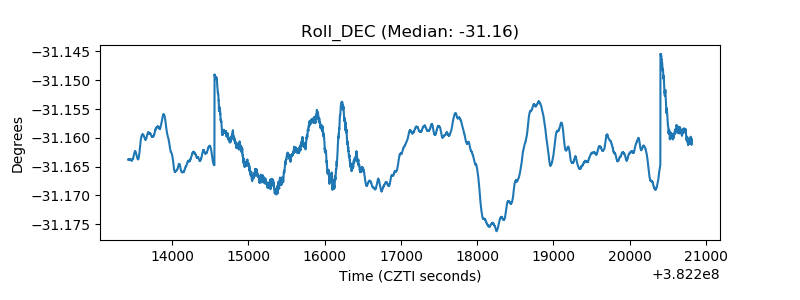 |
| _Roll_RA | 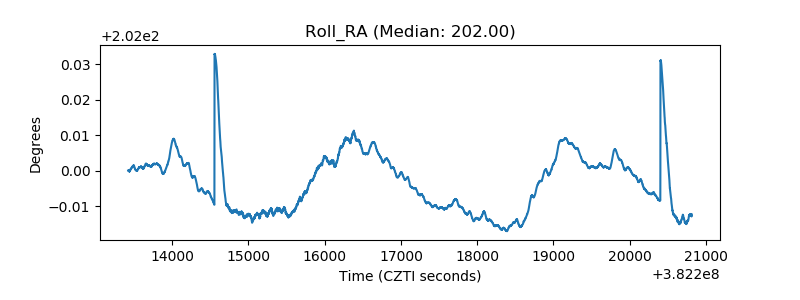 |
| Veto Counter | 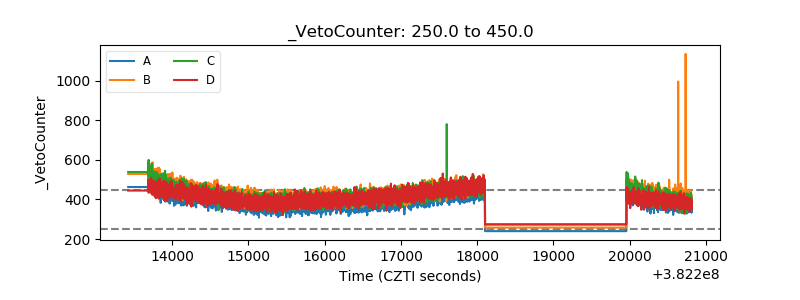 |