| Param | Original file | Final file |
|---|---|---|
| Filename | modeM0/AS1A10_058T06_9000004920_34452cztM0_level2.evt | modeM0/AS1A10_058T06_9000004920_34452cztM0_level2_quad_clean.evt |
| Size (bytes) | 528,456,960 | 70,611,840 |
| Size | 504.0 MB | 67.3 MB |
| Events in quadrant A | 2,704,198 | 463,505 |
| Events in quadrant B | 3,902,621 | 454,420 |
| Events in quadrant C | 4,035,979 | 444,192 |
| Events in quadrant D | 5,016,924 | 418,763 |
| Mode SS | |||
|---|---|---|---|
| Quadrant | BADHDUFLAG | Total packets | Discarded packets |
| A | 0 | 104 | 0 |
| B | 0 | 104 | 0 |
| C | 0 | 104 | 0 |
| D | 0 | 104 | 0 |
| Mode M0 | |||
|---|---|---|---|
| Quadrant | BADHDUFLAG | Total packets | Discarded packets |
| A | 0 | 11110 | 3 |
| B | 0 | 14870 | 2 |
| C | 0 | 15762 | 2 |
| D | 0 | 18467 | 2 |
| Mode M9 | |||
|---|---|---|---|
| Quadrant | BADHDUFLAG | Total packets | Discarded packets |
| A | 0 | 29 | 0 |
| B | 0 | 29 | 0 |
| C | 0 | 29 | 0 |
| D | 0 | 30 | 0 |
| Quadrant | Total seconds | Saturated seconds | Saturation percentage |
|---|---|---|---|
| A | 5097 | 11 | 0.215813% |
| B | 5097 | 354 | 6.945262% |
| C | 5097 | 64 | 1.255641% |
| D | 5097 | 361 | 7.082598% |
Noise dominated data is calculated using 1-second bins in cleaned event files. If a bin has >2000 counts, and if more than 50% of those come from <1% of pixels, then it is considered to be noise-dominated and hence unusable.
| Quadrant | # 1 sec bins | Bins with >0 counts | Bins with >2000 counts | High rate bins dominated by noise | Noise dominated (total time) | Noise dominated (detector-on time) | Marked lightcurve |
|---|---|---|---|---|---|---|---|
| A | 7220 | 5098 | 1 | 1 | 0.01% | 0.02% | 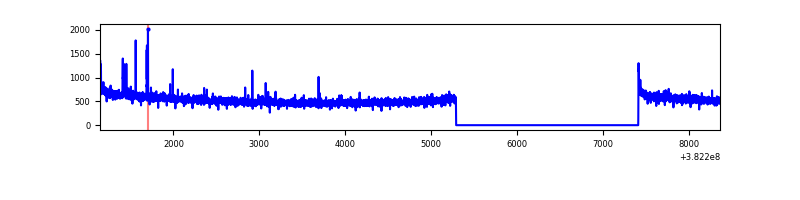 |
| B | 7220 | 5098 | 249 | 249 | 3.45% | 4.88% | 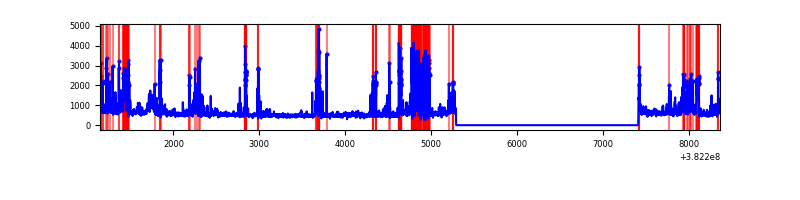 |
| C | 7220 | 5098 | 37 | 37 | 0.51% | 0.73% | 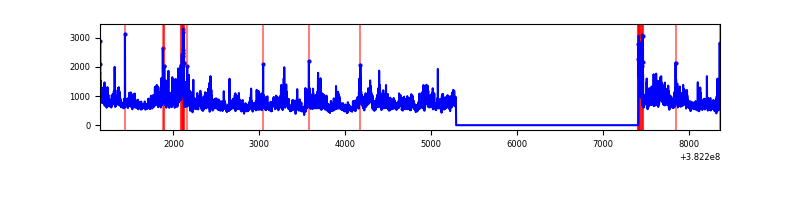 |
| D | 7220 | 5098 | 323 | 323 | 4.47% | 6.34% | 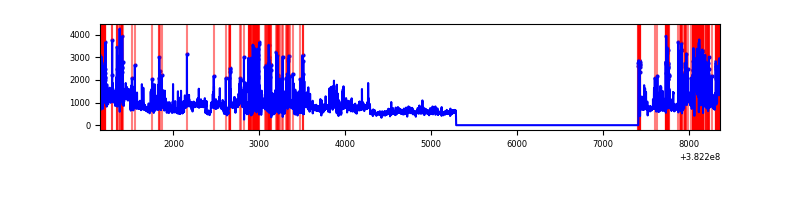 |
Top three noisy pixels from each quadrant. If the there are fewer than three noisy pixels in the level2.evt file, extra rows are filled as -1
| Pixel properties | Quadrant properties | ||||||
|---|---|---|---|---|---|---|---|
| Quadrant | DetID | PixID | Counts | Sigma | Mean | Median | Sigma |
| A | 10 | 83 | 37975 | 275.52 | 680 | 670 | 135.4 |
| A | 15 | 169 | 18666 | 132.91 | 680 | 670 | 135.4 |
| A | 13 | 254 | 8867 | 60.54 | 680 | 670 | 135.4 |
| B | 5 | 172 | 572033 | 4642.69 | 659 | 645 | 123.1 |
| B | 0 | 229 | 557662 | 4525.92 | 659 | 645 | 123.1 |
| B | 4 | 171 | 78320 | 631.13 | 659 | 645 | 123.1 |
| C | 4 | 254 | 1128310 | 7664.69 | 644 | 652 | 147.1 |
| C | 15 | 214 | 215452 | 1460.0 | 644 | 652 | 147.1 |
| C | 0 | 10 | 67057 | 451.35 | 644 | 652 | 147.1 |
| D | 8 | 195 | 1057574 | 6302.87 | 625 | 614 | 167.7 |
| D | 12 | 235 | 718094 | 4278.48 | 625 | 614 | 167.7 |
| D | 2 | 249 | 302676 | 1801.26 | 625 | 614 | 167.7 |
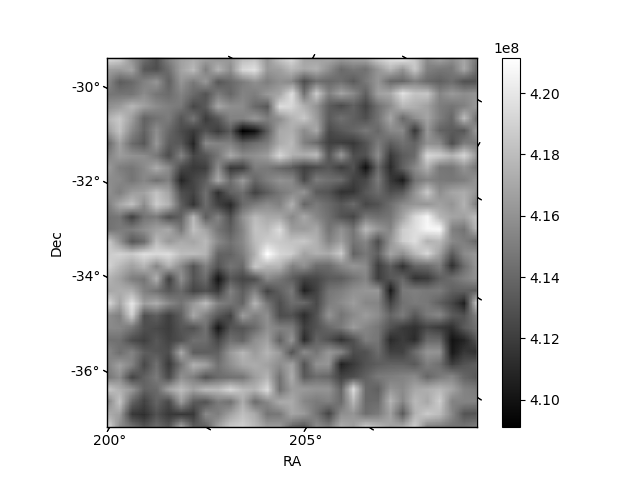
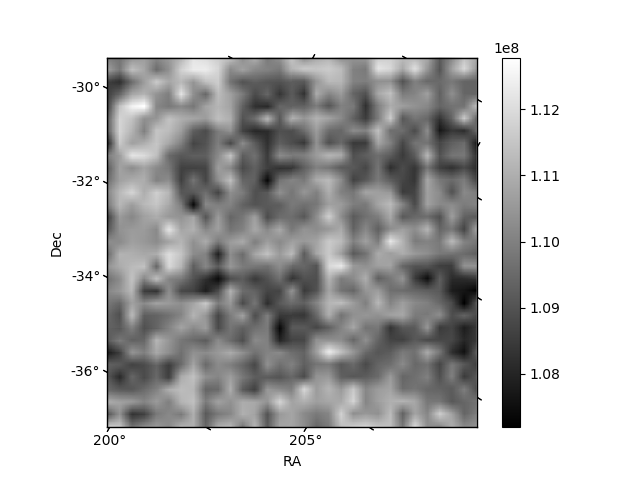
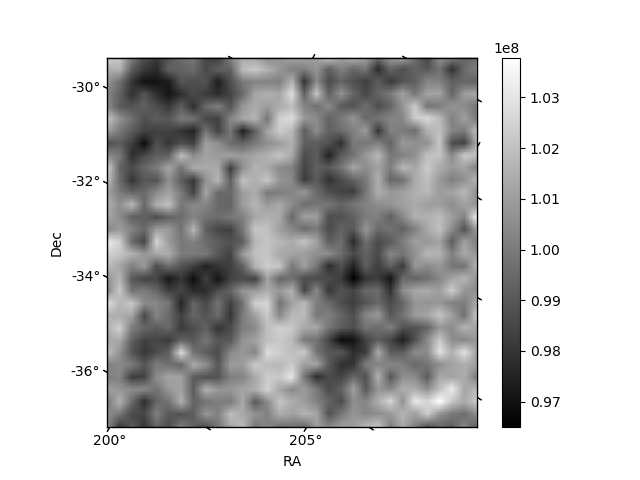
Histogram calculated using DETX and DETY for each event in the final _common_clean file
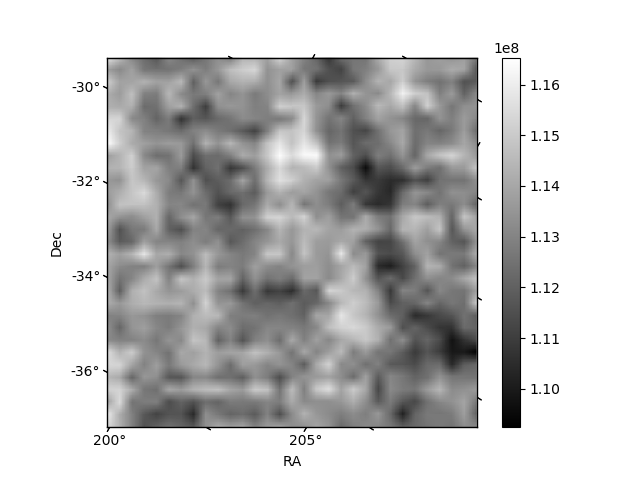
| Quadrant A | 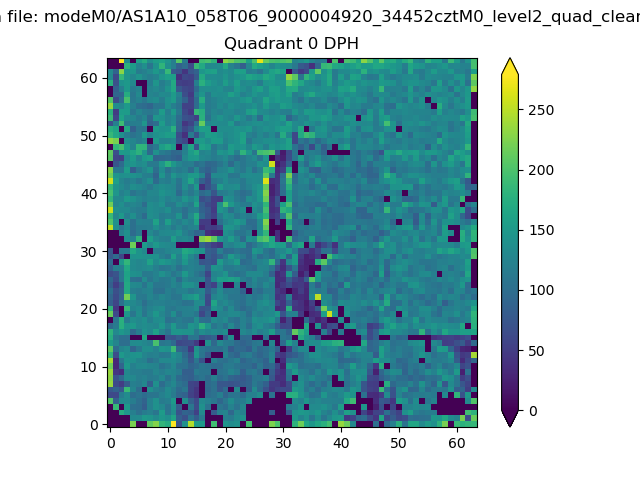 |
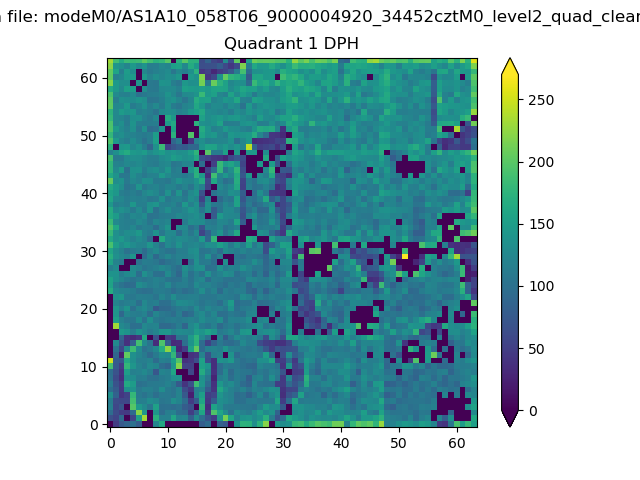 |
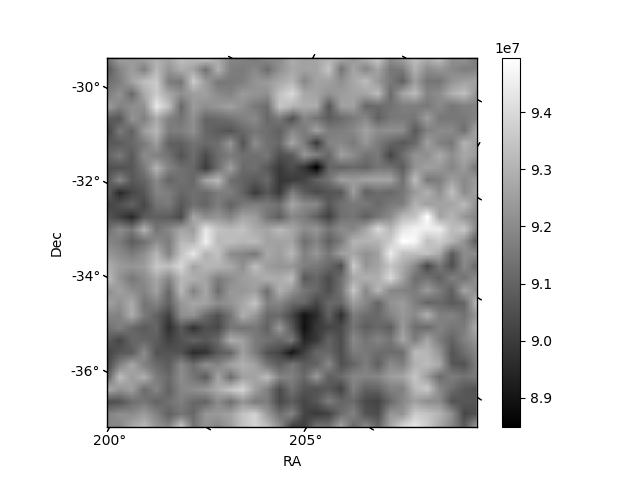
Quadrant B |
|---|---|---|---|
| Quadrant D |  |
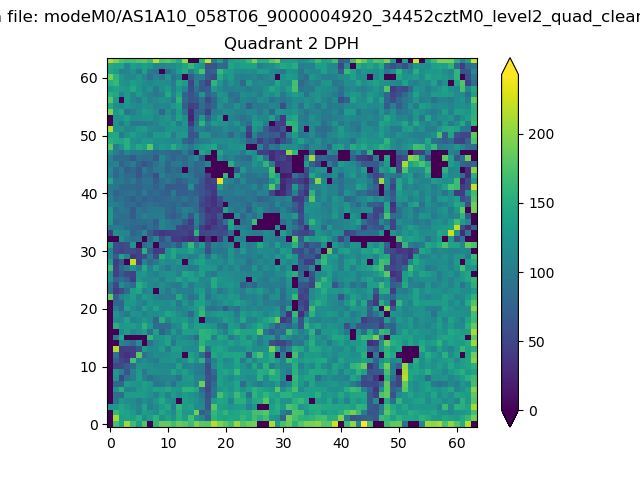 |
Quadrant C |
| Plot type | Count rate plots | Images |
|---|---|---|
| Comparison with Poisson distribution Blue bars denote a histogram of data divided into 1 sec bins. Red curve is a Poisson curve with rate = median count rate of data. |
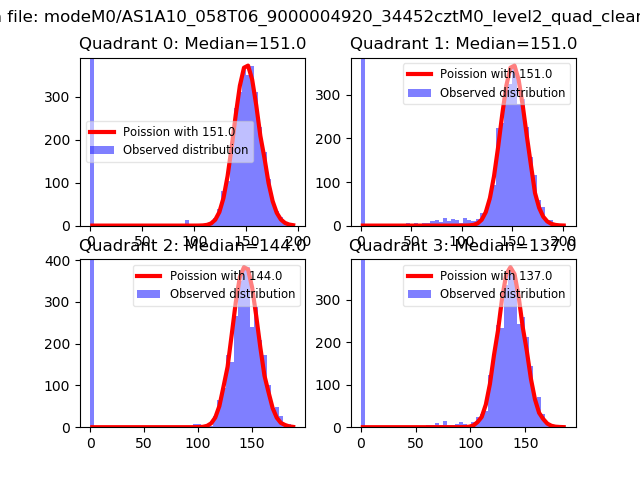 |
 |
| Quadrant-wise count rates Data is divided into 100 sec bins |
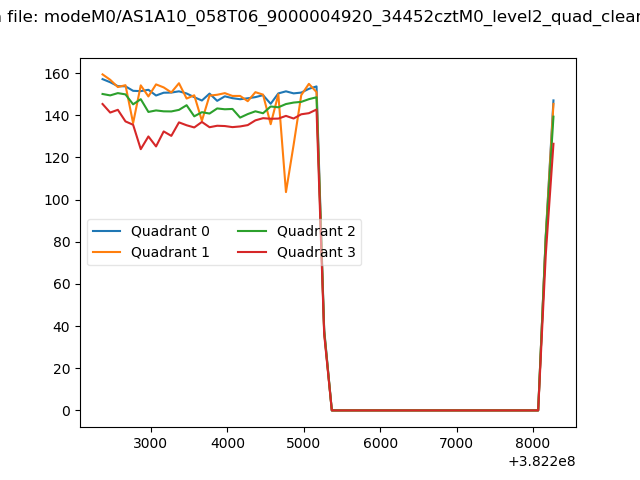 |
|
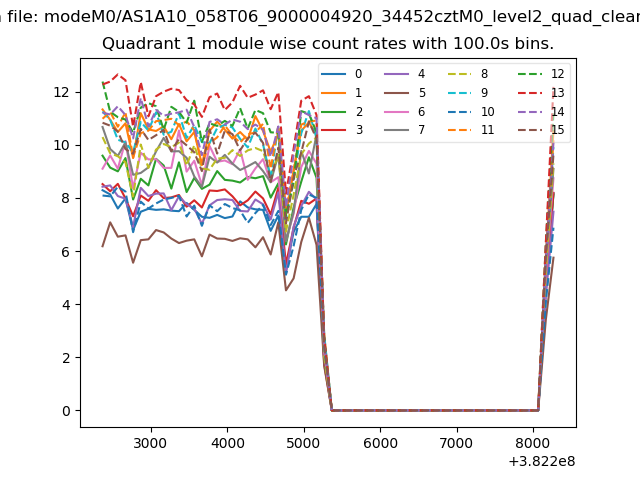
| Module-wise count rates for Quadrant A Data is divided into 100 sec bins |
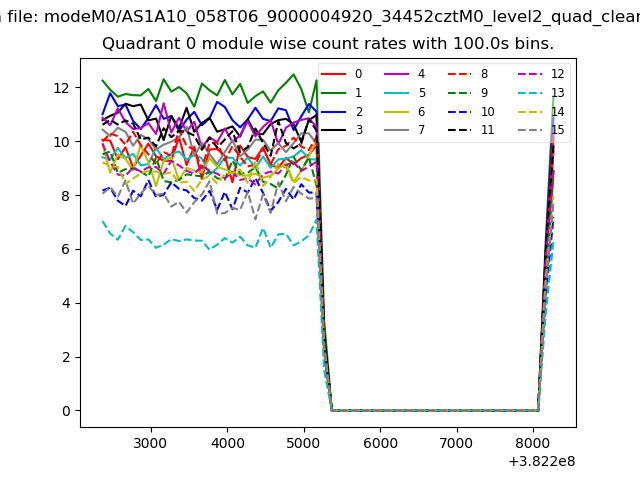 |
 |
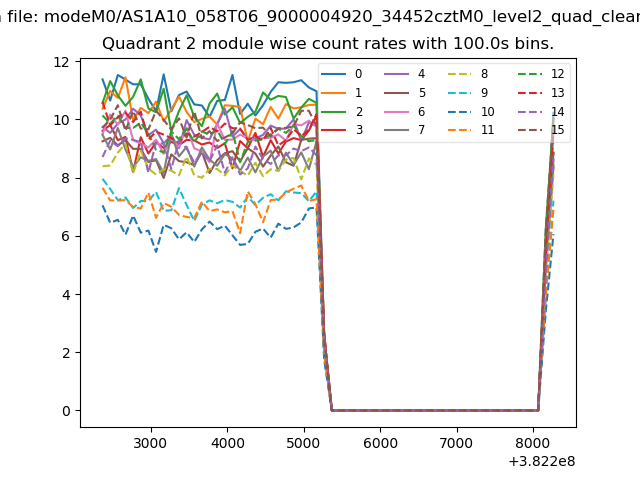
| Module-wise count rates for Quadrant B Data is divided into 100 sec bins |
 |
 |
| Module-wise count rates for Quadrant C Data is divided into 100 sec bins |
 |
 |
| Module-wise count rates for Quadrant D Data is divided into 100 sec bins |
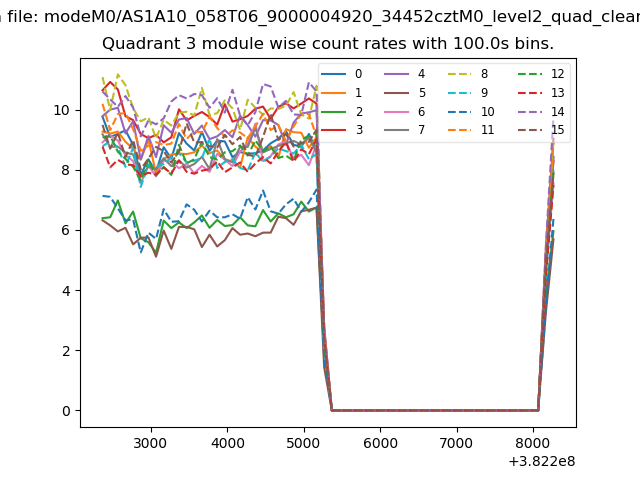 |
 |
| Parameter | Plot |
|---|---|
| CZT HV Monitor | 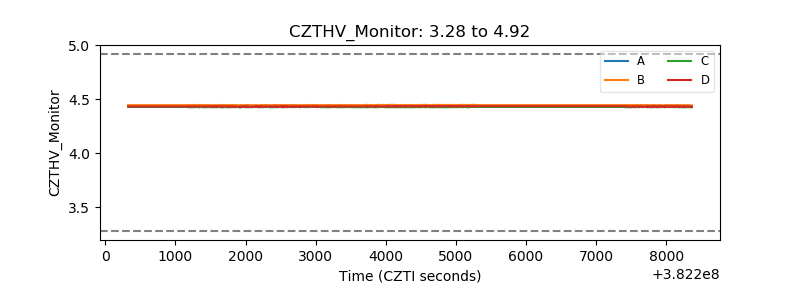 |
| D_VDD | 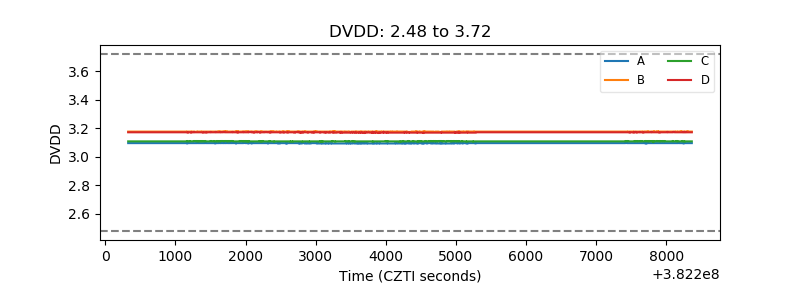 |
| Temperature 1 | 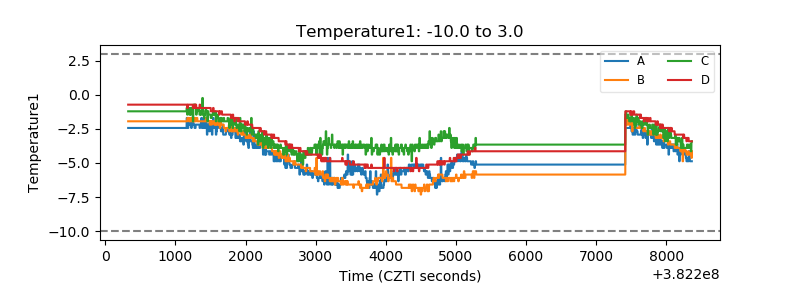 |
| Veto HV Monitor | 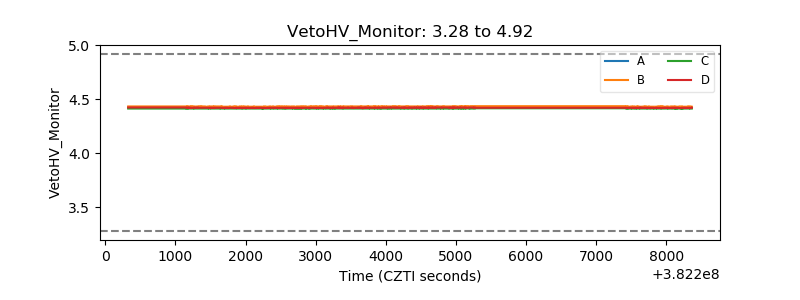 |
| Veto LLD | 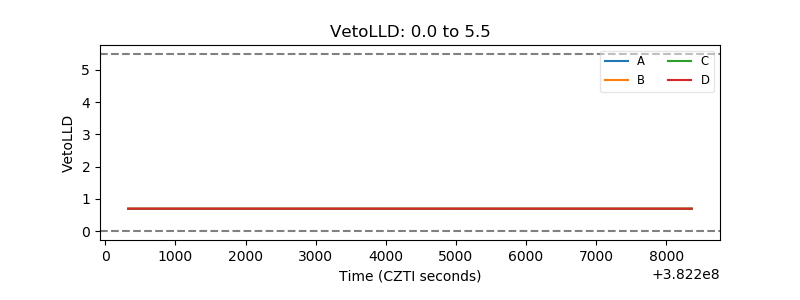 |
| Alpha Counter | 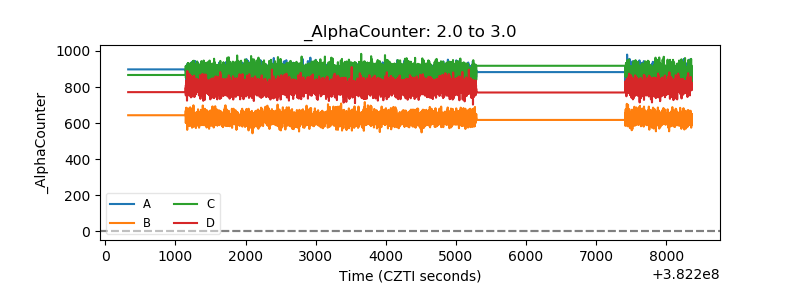 |
| _CPM_Rate | 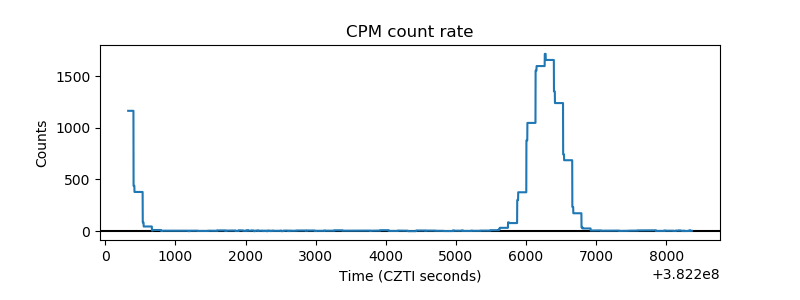 |
| CZT Counter | 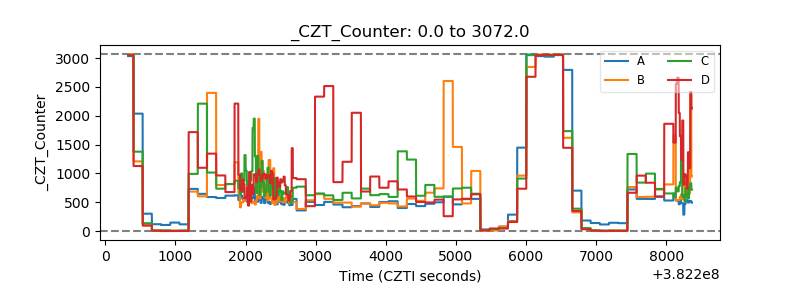 |
| +2.5 Volts monitor | 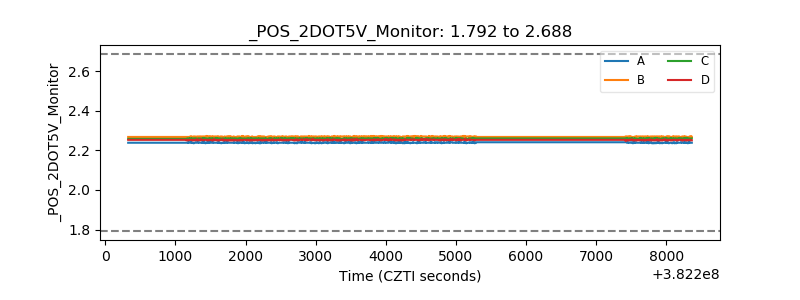 |
| +5 Volts monitor | 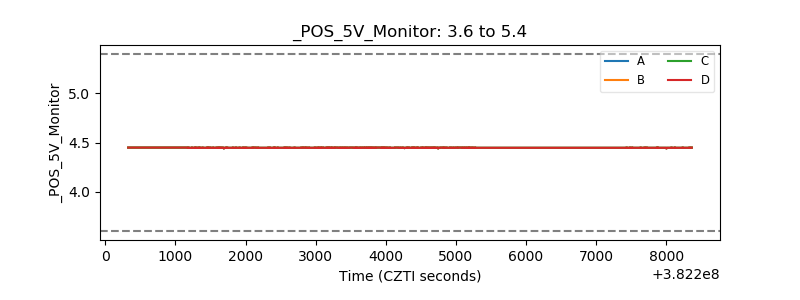 |
| _ROLL_ROT | 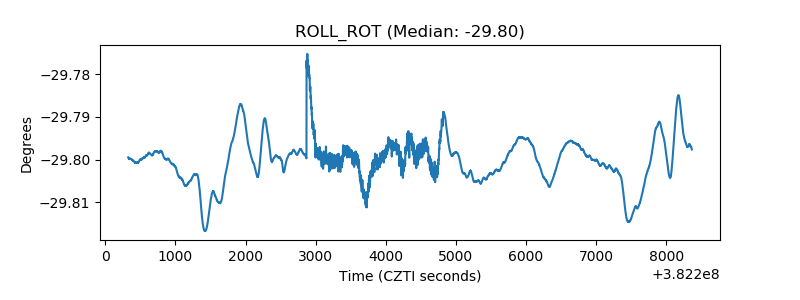 |
| _Roll_DEC | 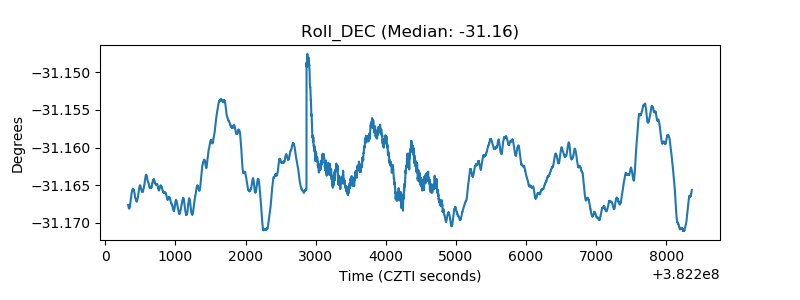 |
| _Roll_RA | 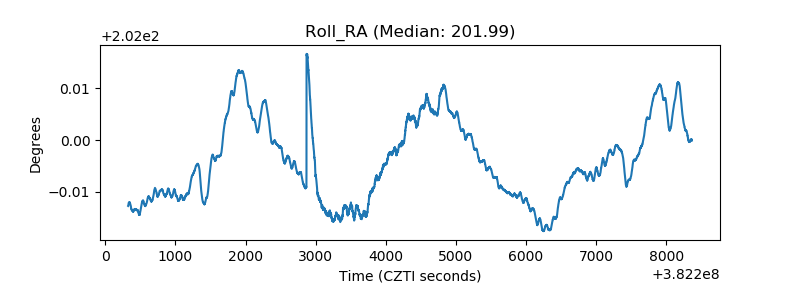 |
| Veto Counter | 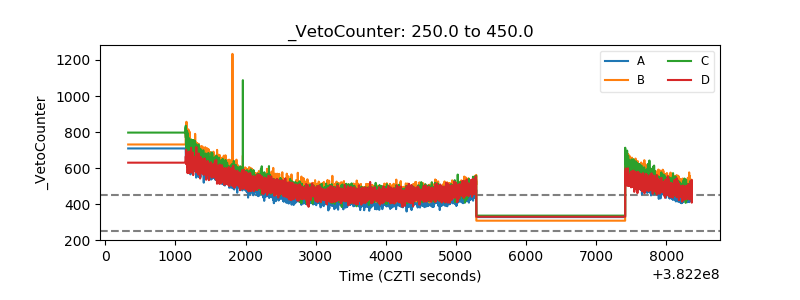 |