| Param | Original file | Final file |
|---|---|---|
| Filename | modeM0/AS1A10_058T06_9000004920_34451cztM0_level2.evt | modeM0/AS1A10_058T06_9000004920_34451cztM0_level2_quad_clean.evt |
| Size (bytes) | 515,033,280 | 61,009,920 |
| Size | 491.2 MB | 58.2 MB |
| Events in quadrant A | 2,878,895 | 380,783 |
| Events in quadrant B | 4,172,791 | 374,552 |
| Events in quadrant C | 3,690,917 | 367,882 |
| Events in quadrant D | 4,498,572 | 354,642 |
| Mode SS | |||
|---|---|---|---|
| Quadrant | BADHDUFLAG | Total packets | Discarded packets |
| A | 0 | 108 | 0 |
| B | 0 | 108 | 0 |
| C | 0 | 108 | 0 |
| D | 0 | 108 | 0 |
| Mode M0 | |||
|---|---|---|---|
| Quadrant | BADHDUFLAG | Total packets | Discarded packets |
| A | 0 | 11828 | 3 |
| B | 0 | 16044 | 2 |
| C | 0 | 14850 | 2 |
| D | 0 | 17031 | 2 |
| Mode M9 | |||
|---|---|---|---|
| Quadrant | BADHDUFLAG | Total packets | Discarded packets |
| A | 0 | 27 | 0 |
| B | 0 | 27 | 0 |
| C | 0 | 27 | 0 |
| D | 0 | 28 | 0 |
| Quadrant | Total seconds | Saturated seconds | Saturation percentage |
|---|---|---|---|
| A | 5271 | 17 | 0.322519% |
| B | 5271 | 343 | 6.507304% |
| C | 5271 | 43 | 0.815784% |
| D | 5271 | 111 | 2.105862% |
Noise dominated data is calculated using 1-second bins in cleaned event files. If a bin has >2000 counts, and if more than 50% of those come from <1% of pixels, then it is considered to be noise-dominated and hence unusable.
| Quadrant | # 1 sec bins | Bins with >0 counts | Bins with >2000 counts | High rate bins dominated by noise | Noise dominated (total time) | Noise dominated (detector-on time) | Marked lightcurve |
|---|---|---|---|---|---|---|---|
| A | 7364 | 5272 | 1 | 1 | 0.01% | 0.02% | 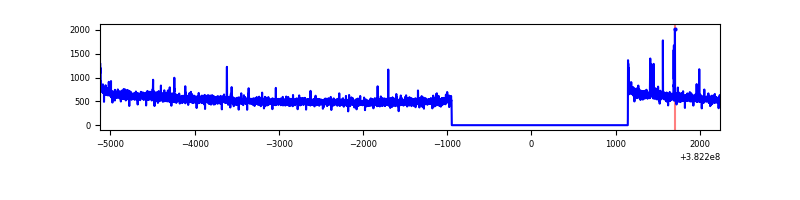 |
| B | 7364 | 5272 | 221 | 221 | 3.00% | 4.19% | 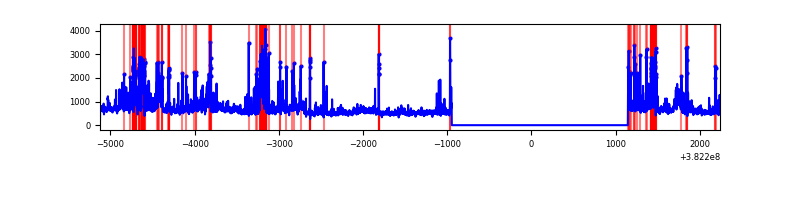 |
| C | 7364 | 5272 | 21 | 21 | 0.29% | 0.40% | 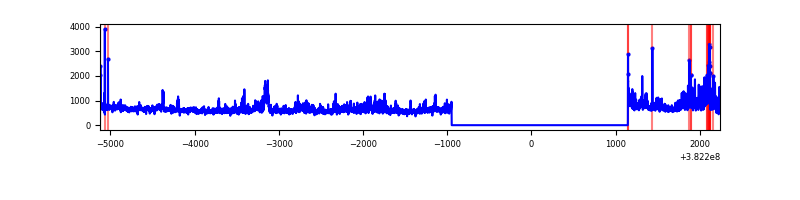 |
| D | 7364 | 5272 | 76 | 76 | 1.03% | 1.44% |  |
Top three noisy pixels from each quadrant. If the there are fewer than three noisy pixels in the level2.evt file, extra rows are filled as -1
| Pixel properties | Quadrant properties | ||||||
|---|---|---|---|---|---|---|---|
| Quadrant | DetID | PixID | Counts | Sigma | Mean | Median | Sigma |
| A | 10 | 83 | 37737 | 259.41 | 726 | 715 | 142.7 |
| A | 15 | 169 | 19639 | 132.6 | 726 | 715 | 142.7 |
| A | 9 | 143 | 11113 | 72.86 | 726 | 715 | 142.7 |
| B | 5 | 172 | 831599 | 6394.36 | 699 | 683 | 129.9 |
| B | 0 | 190 | 230090 | 1765.41 | 699 | 683 | 129.9 |
| B | 4 | 171 | 130369 | 998.01 | 699 | 683 | 129.9 |
| C | 4 | 254 | 685480 | 4366.47 | 688 | 697 | 156.8 |
| C | 15 | 214 | 224276 | 1425.63 | 688 | 697 | 156.8 |
| C | 3 | 233 | 51663 | 324.98 | 688 | 697 | 156.8 |
| D | 8 | 195 | 1121631 | 6085.7 | 681 | 670 | 184.2 |
| D | 12 | 235 | 178124 | 963.4 | 681 | 670 | 184.2 |
| D | 2 | 250 | 128738 | 695.28 | 681 | 670 | 184.2 |
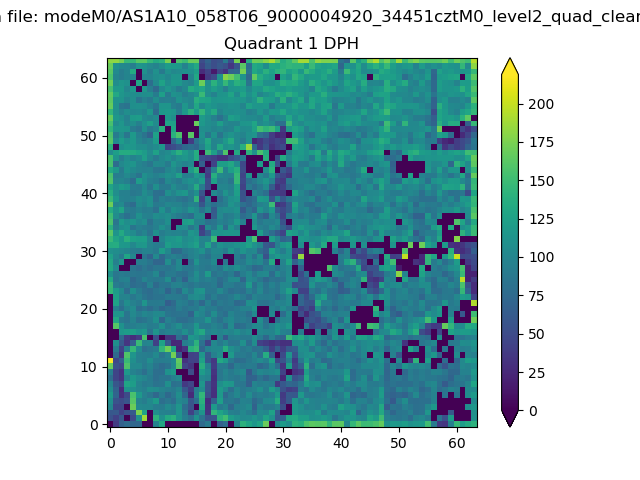
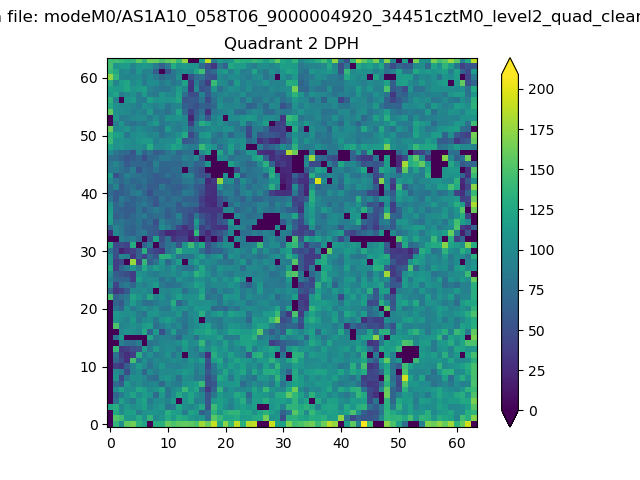
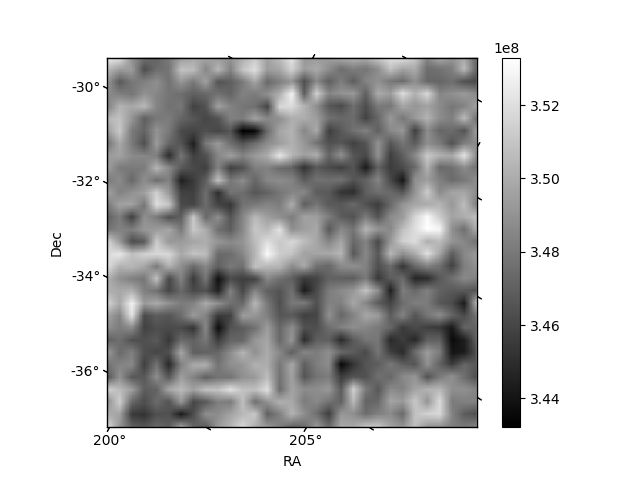
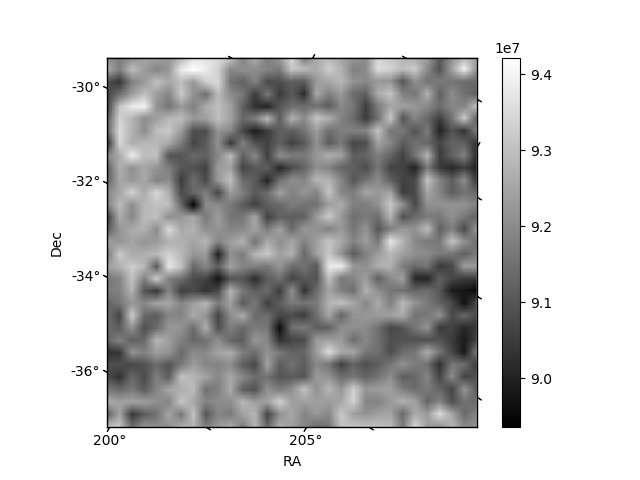
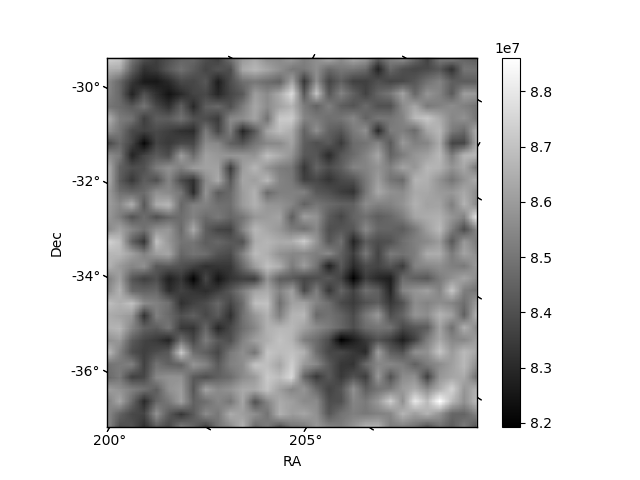
Histogram calculated using DETX and DETY for each event in the final _common_clean file
| Quadrant A | 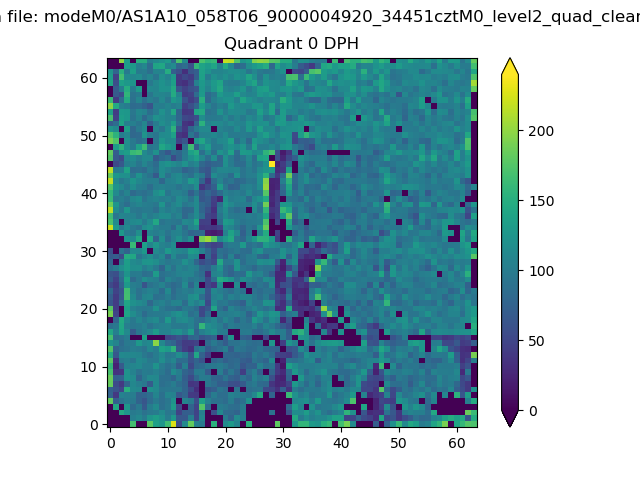 |
 |
Quadrant B |
|---|---|---|---|
| Quadrant D | 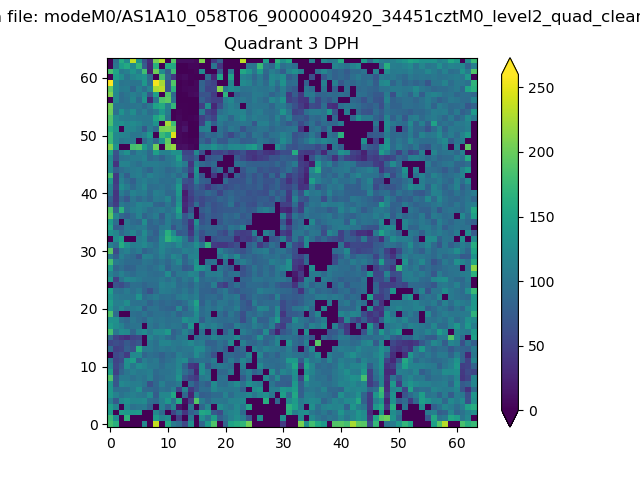 |
 |
Quadrant C |
| Plot type | Count rate plots | Images |
|---|---|---|
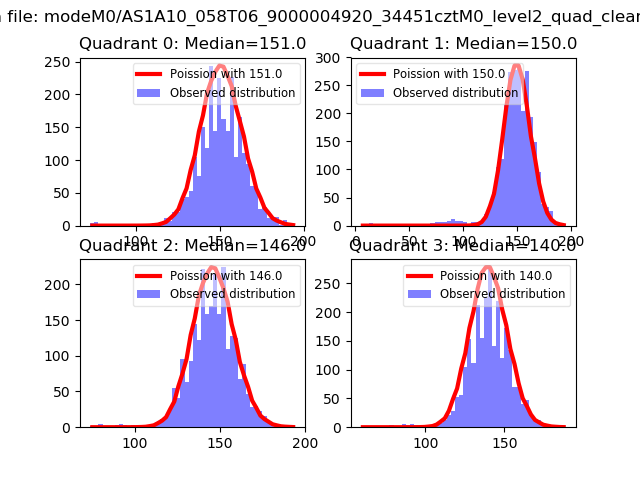
| Comparison with Poisson distribution Blue bars denote a histogram of data divided into 1 sec bins. Red curve is a Poisson curve with rate = median count rate of data. |
 |
 |
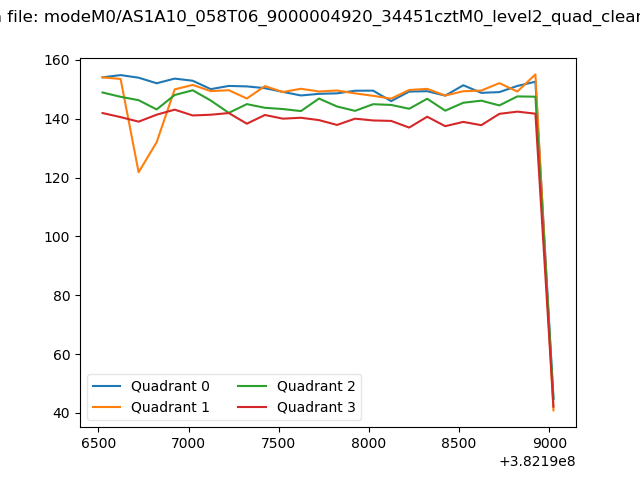
| Quadrant-wise count rates Data is divided into 100 sec bins |
 |
|
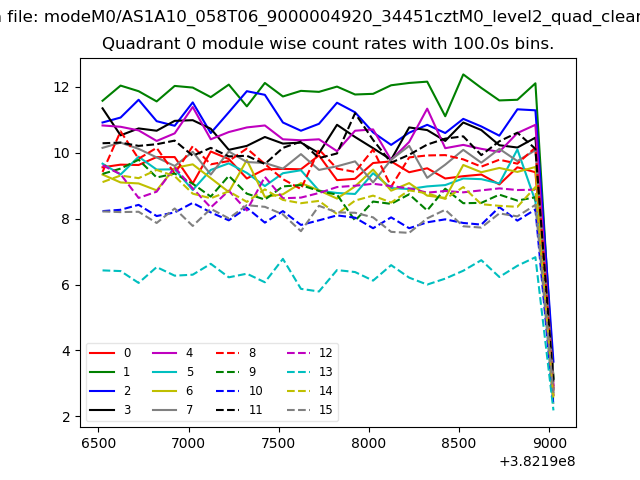
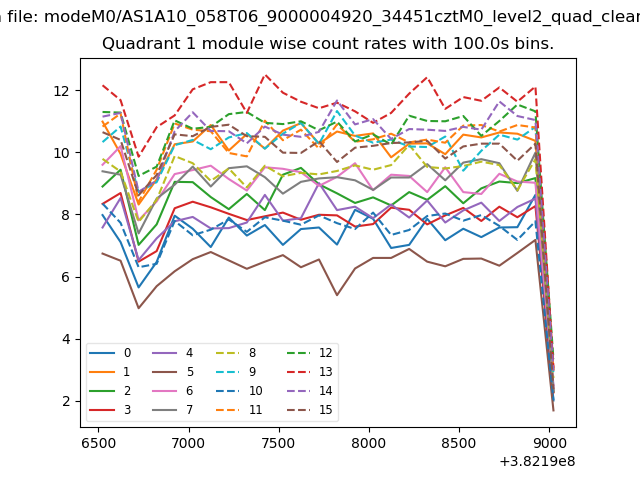
| Module-wise count rates for Quadrant A Data is divided into 100 sec bins |
 |
 |
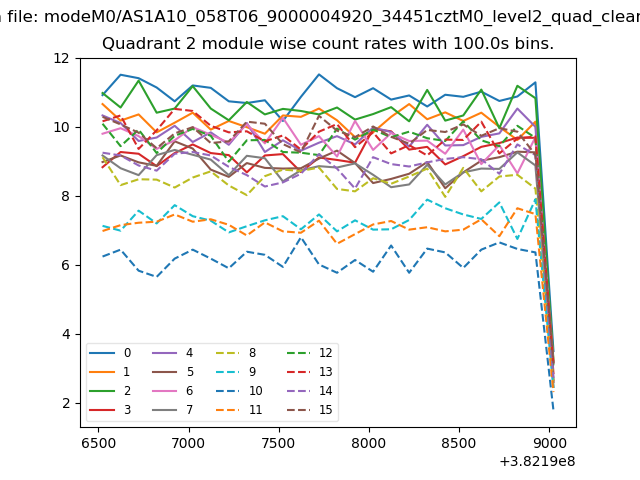
| Module-wise count rates for Quadrant B Data is divided into 100 sec bins |
 |
 |
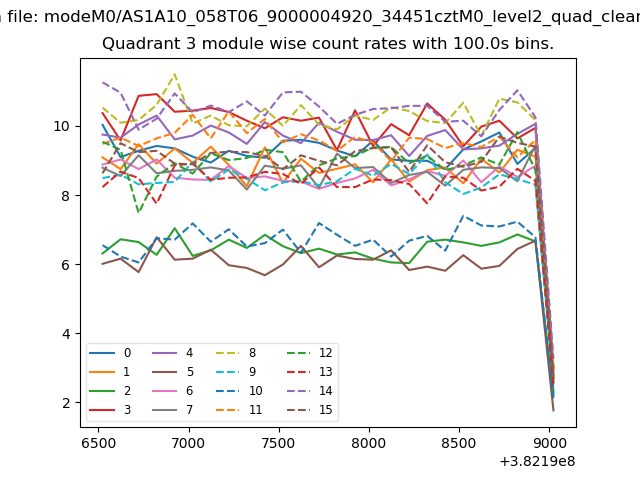
| Module-wise count rates for Quadrant C Data is divided into 100 sec bins |
 |
 |
| Module-wise count rates for Quadrant D Data is divided into 100 sec bins |
 |
 |
| Parameter | Plot |
|---|---|
| CZT HV Monitor |  |
| D_VDD | 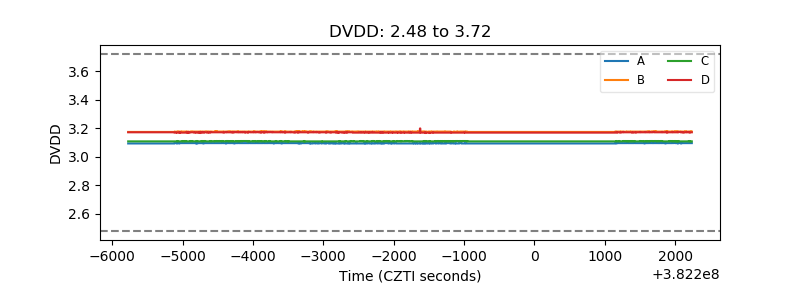 |
| Temperature 1 | 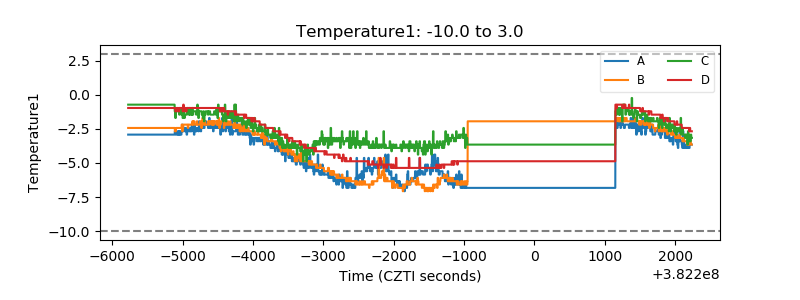 |
| Veto HV Monitor | 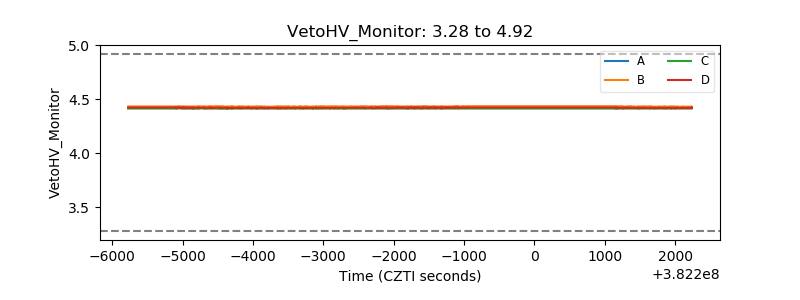 |
| Veto LLD | 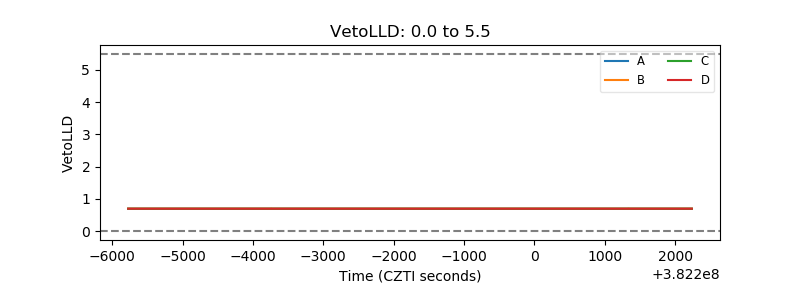 |
| Alpha Counter | 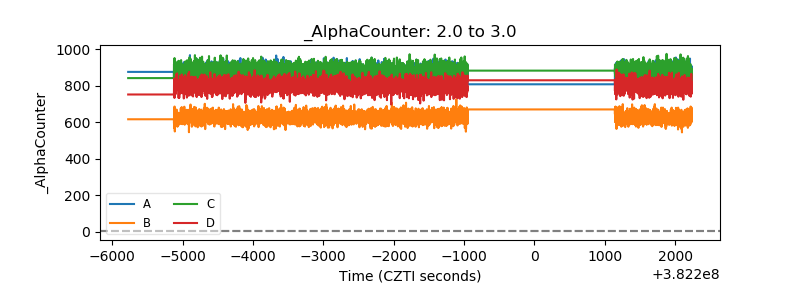 |
| _CPM_Rate | 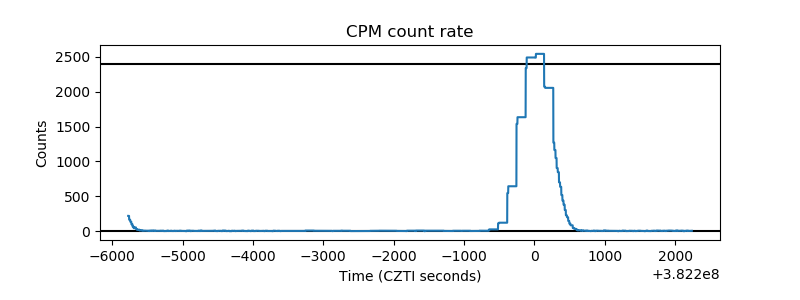 |
| CZT Counter | 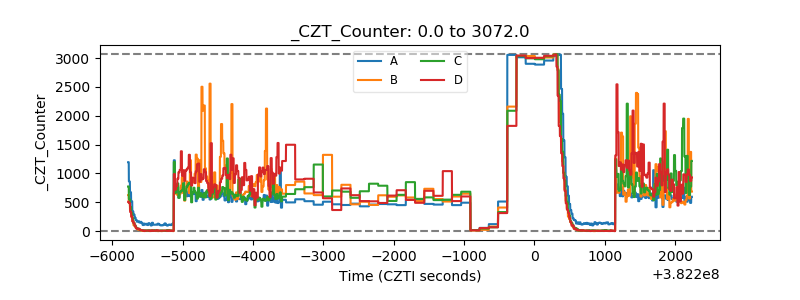 |
| +2.5 Volts monitor | 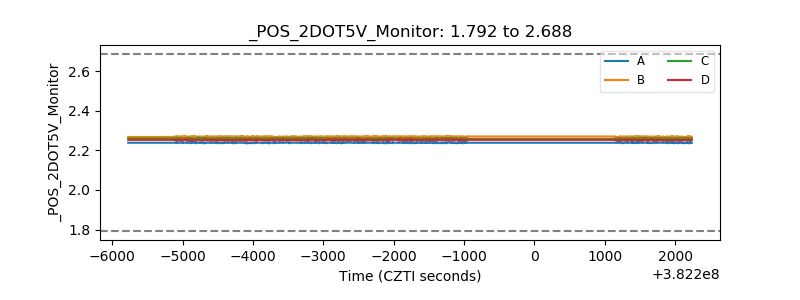 |
| +5 Volts monitor | 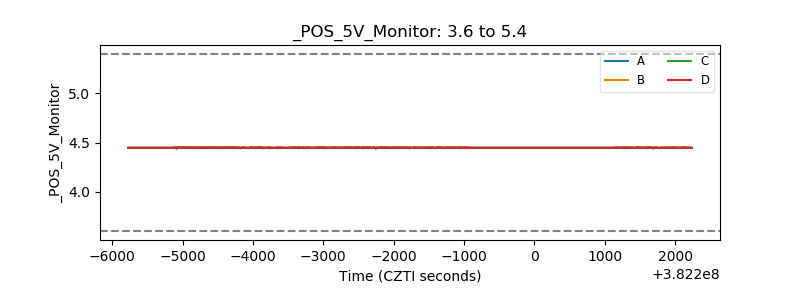 |
| _ROLL_ROT | 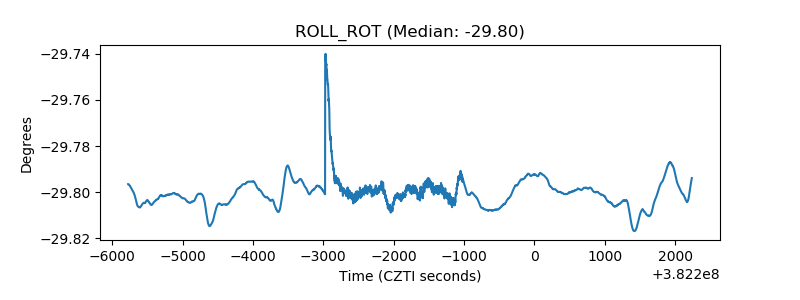 |
| _Roll_DEC | 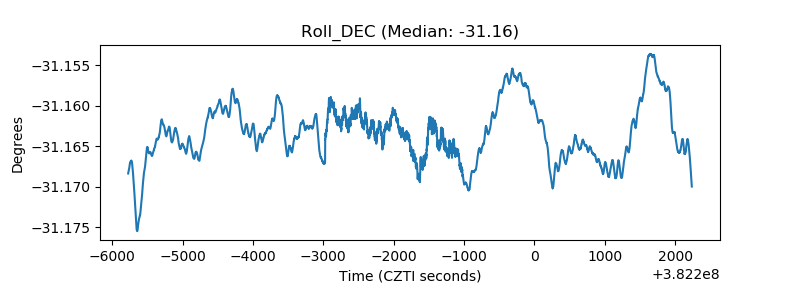 |
| _Roll_RA | 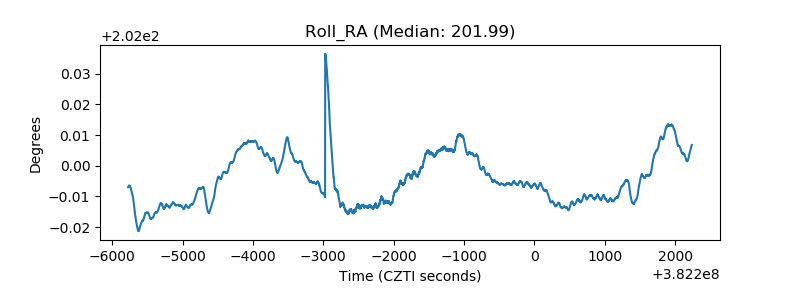 |
| Veto Counter | 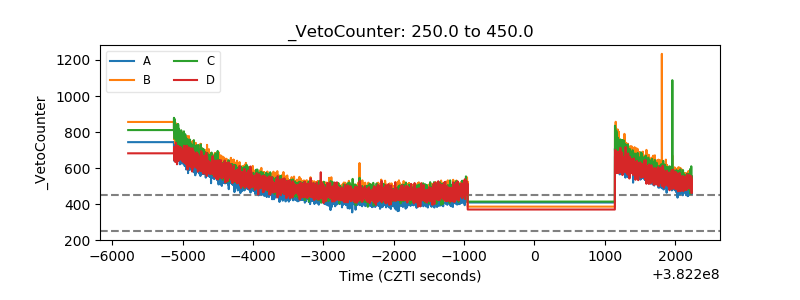 |