| Param | Original file | Final file |
|---|---|---|
| Filename | modeM0/AS1A10_058T05_9000004918_34450cztM0_level2.evt | modeM0/AS1A10_058T05_9000004918_34450cztM0_level2_quad_clean.evt |
| Size (bytes) | 302,670,720 | 18,267,840 |
| Size | 288.6 MB | 17.4 MB |
| Events in quadrant A | 1,453,362 | 92,385 |
| Events in quadrant B | 2,721,800 | 92,111 |
| Events in quadrant C | 1,928,416 | 89,843 |
| Events in quadrant D | 2,878,366 | 84,490 |
| Mode M9 | |||
|---|---|---|---|
| Quadrant | BADHDUFLAG | Total packets | Discarded packets |
| A | 0 | 2 | 0 |
| B | 0 | 2 | 0 |
| C | 0 | 2 | 0 |
| D | 0 | 3 | 0 |
| Mode M0 | |||
|---|---|---|---|
| Quadrant | BADHDUFLAG | Total packets | Discarded packets |
| A | 0 | 5890 | 1 |
| B | 0 | 9890 | 1 |
| C | 0 | 7773 | 1 |
| D | 0 | 10523 | 1 |
| Mode SS | |||
|---|---|---|---|
| Quadrant | BADHDUFLAG | Total packets | Discarded packets |
| A | 0 | 54 | 0 |
| B | 0 | 54 | 0 |
| C | 0 | 54 | 0 |
| D | 0 | 54 | 0 |
| Quadrant | Total seconds | Saturated seconds | Saturation percentage |
|---|---|---|---|
| A | 2703 | 8 | 0.295967% |
| B | 2703 | 485 | 17.943026% |
| C | 2703 | 39 | 1.442841% |
| D | 2703 | 168 | 6.215316% |
Noise dominated data is calculated using 1-second bins in cleaned event files. If a bin has >2000 counts, and if more than 50% of those come from <1% of pixels, then it is considered to be noise-dominated and hence unusable.
| Quadrant | # 1 sec bins | Bins with >0 counts | Bins with >2000 counts | High rate bins dominated by noise | Noise dominated (total time) | Noise dominated (detector-on time) | Marked lightcurve |
|---|---|---|---|---|---|---|---|
| A | 2703 | 2703 | 4 | 4 | 0.15% | 0.15% | 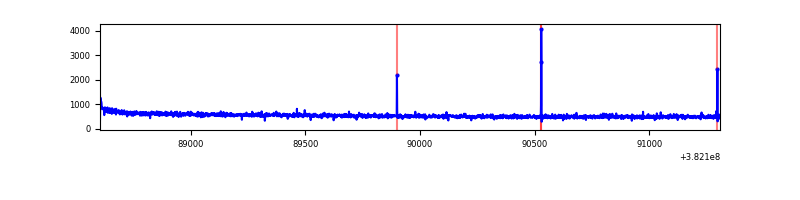 |
| B | 2703 | 2703 | 347 | 347 | 12.84% | 12.84% | 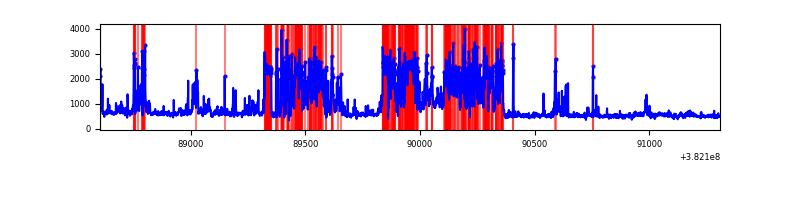 |
| C | 2703 | 2703 | 33 | 33 | 1.22% | 1.22% |  |
| D | 2703 | 2703 | 138 | 138 | 5.11% | 5.11% | 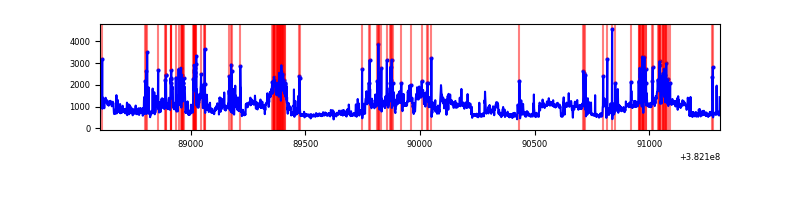 |
Top three noisy pixels from each quadrant. If the there are fewer than three noisy pixels in the level2.evt file, extra rows are filled as -1
| Pixel properties | Quadrant properties | ||||||
|---|---|---|---|---|---|---|---|
| Quadrant | DetID | PixID | Counts | Sigma | Mean | Median | Sigma |
| A | 10 | 83 | 18971 | 251.81 | 367 | 361 | 73.9 |
| A | 15 | 192 | 7969 | 102.94 | 367 | 361 | 73.9 |
| A | 9 | 143 | 6556 | 83.82 | 367 | 361 | 73.9 |
| B | 5 | 172 | 1295589 | 20502.53 | 335 | 328 | 63.2 |
| B | 0 | 190 | 52000 | 817.91 | 335 | 328 | 63.2 |
| B | 4 | 232 | 25756 | 402.5 | 335 | 328 | 63.2 |
| C | 4 | 254 | 432646 | 5362.61 | 348 | 351 | 80.6 |
| C | 15 | 214 | 115323 | 1426.22 | 348 | 351 | 80.6 |
| C | 0 | 10 | 12702 | 153.21 | 348 | 351 | 80.6 |
| D | 8 | 195 | 785781 | 8357.96 | 346 | 341 | 94.0 |
| D | 2 | 249 | 238453 | 2533.78 | 346 | 341 | 94.0 |
| D | 12 | 235 | 179099 | 1902.18 | 346 | 341 | 94.0 |
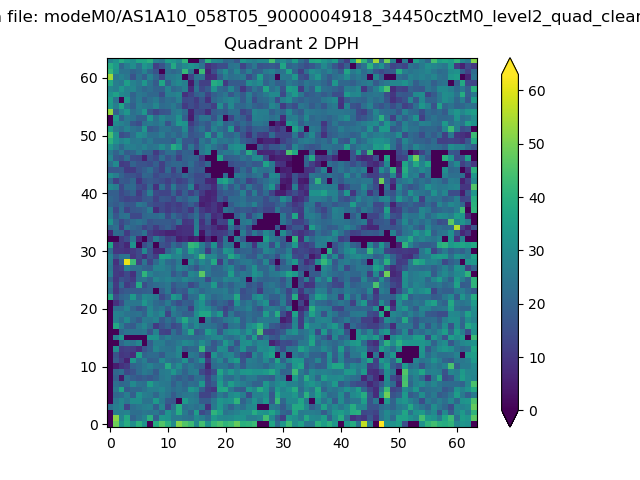
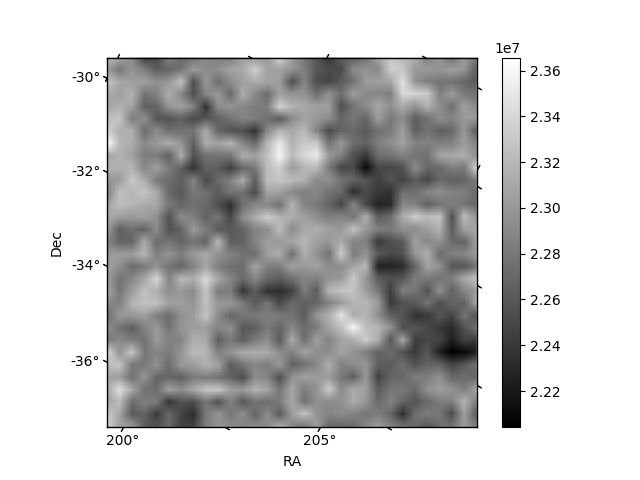
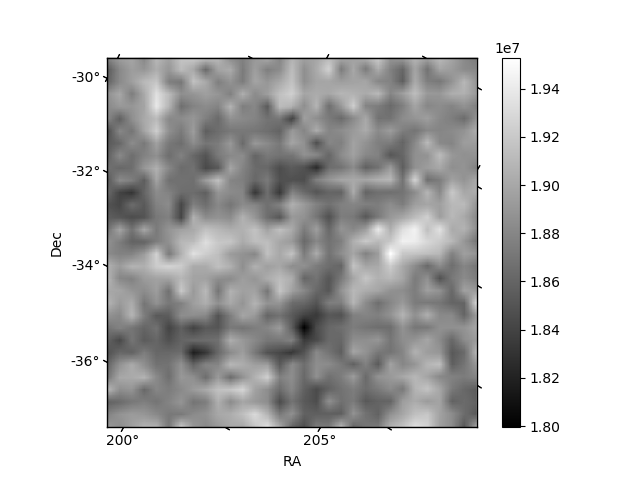
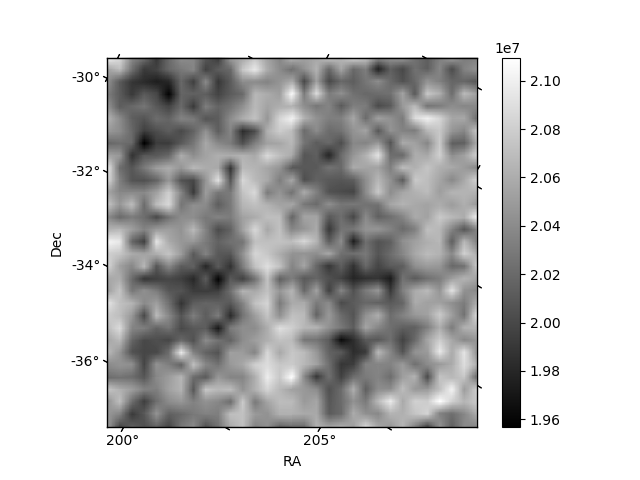
Histogram calculated using DETX and DETY for each event in the final _common_clean file
| Quadrant A | 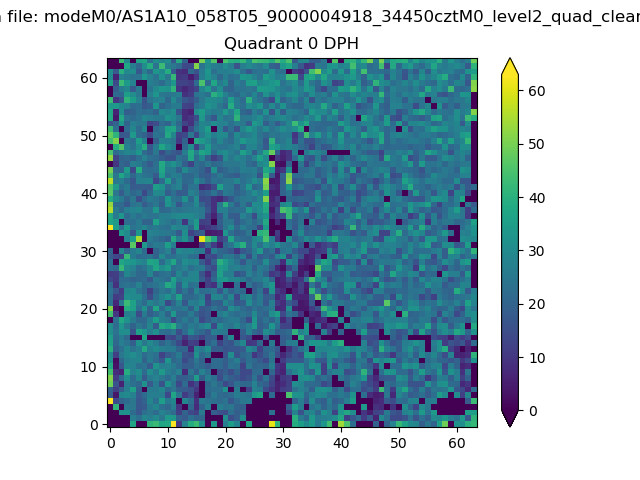 |
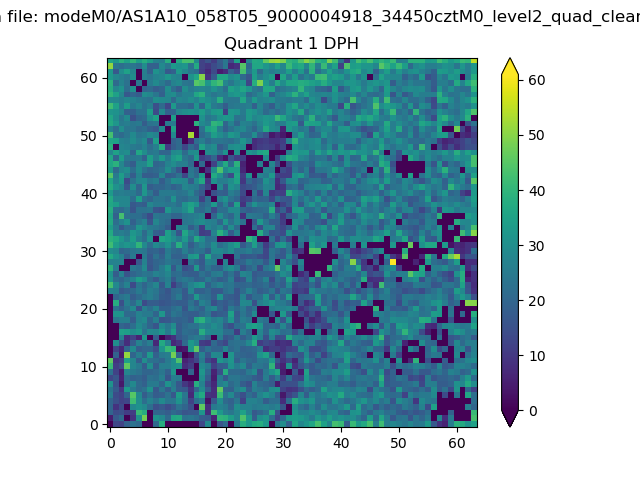 |
Quadrant B |
|---|---|---|---|
| Quadrant D | 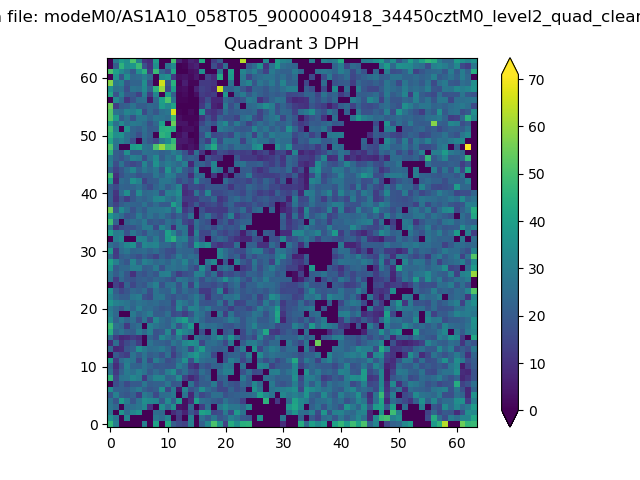 |
 |
Quadrant C |
| Plot type | Count rate plots | Images |
|---|---|---|
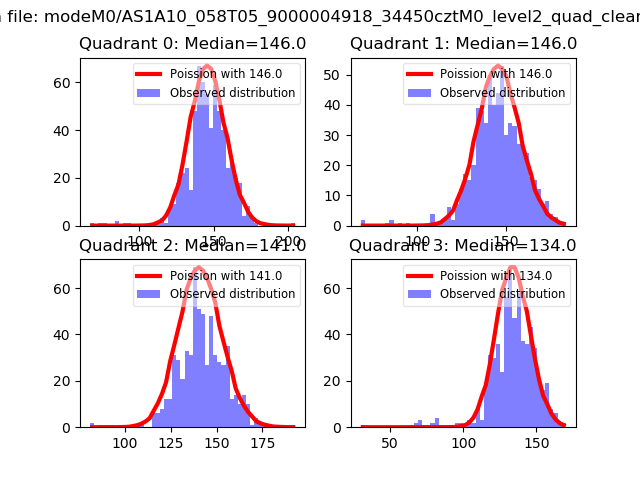
| Comparison with Poisson distribution Blue bars denote a histogram of data divided into 1 sec bins. Red curve is a Poisson curve with rate = median count rate of data. |
 |
 |
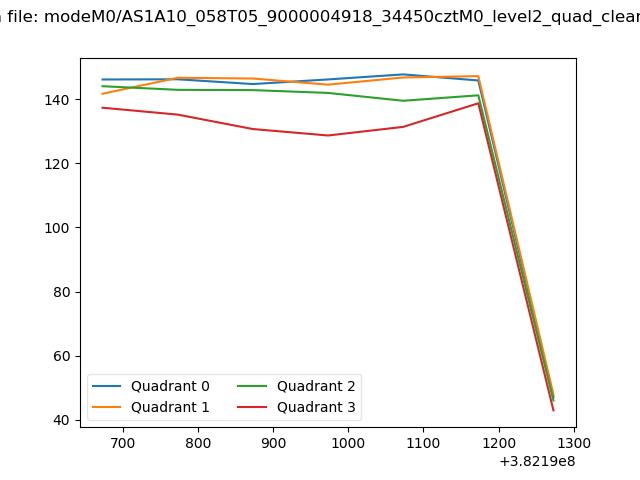
| Quadrant-wise count rates Data is divided into 100 sec bins |
 |
|
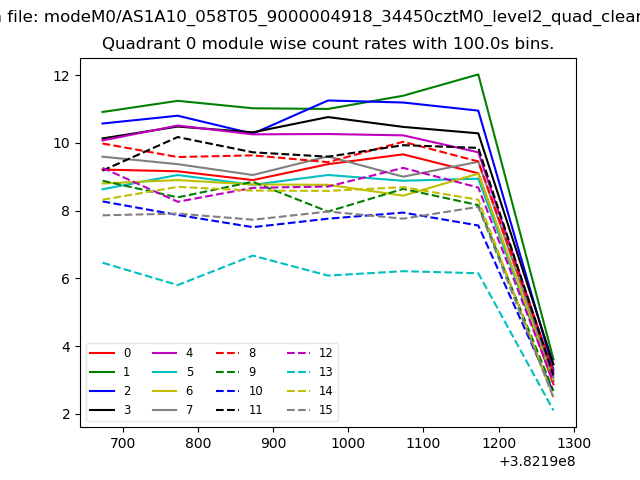
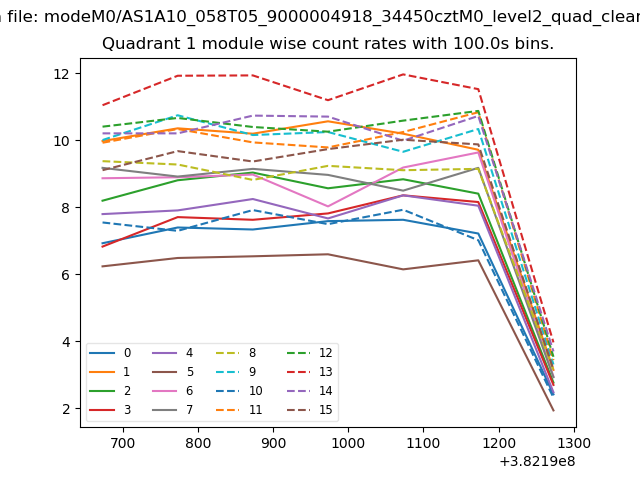
| Module-wise count rates for Quadrant A Data is divided into 100 sec bins |
 |
 |
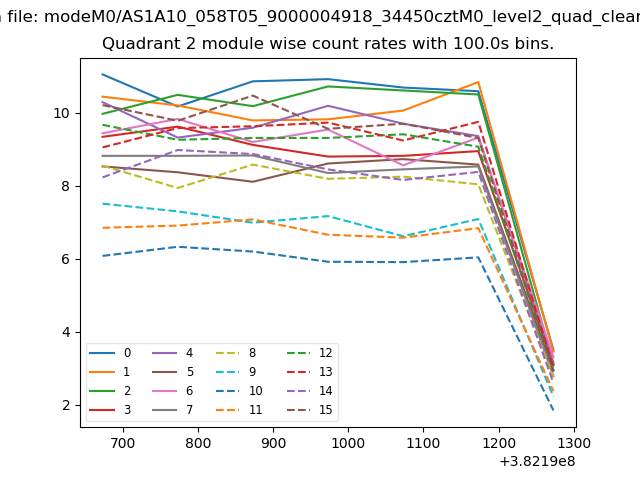
| Module-wise count rates for Quadrant B Data is divided into 100 sec bins |
 |
 |
| Module-wise count rates for Quadrant C Data is divided into 100 sec bins |
 |
 |
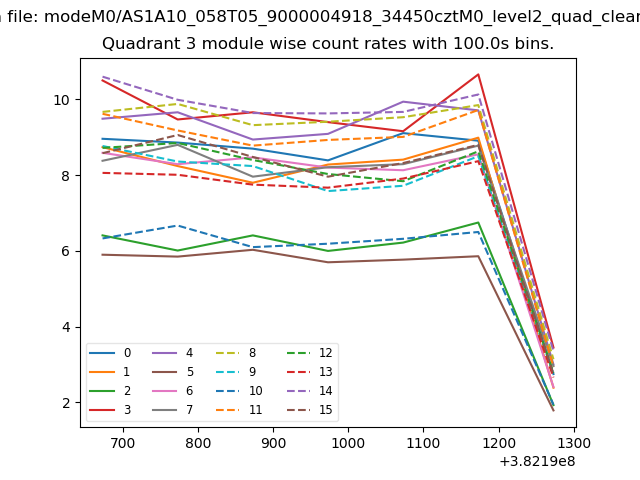
| Module-wise count rates for Quadrant D Data is divided into 100 sec bins |
 |
 |
| Parameter | Plot |
|---|---|
| CZT HV Monitor | 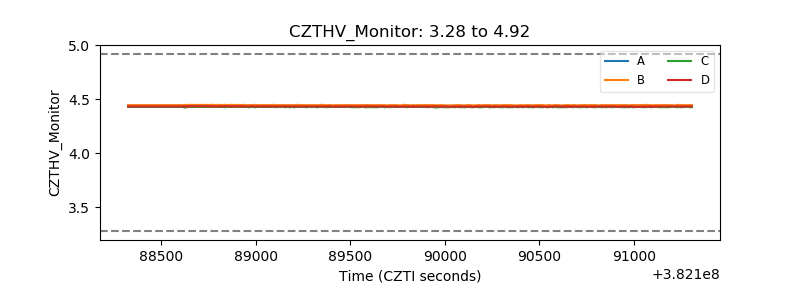 |
| D_VDD | 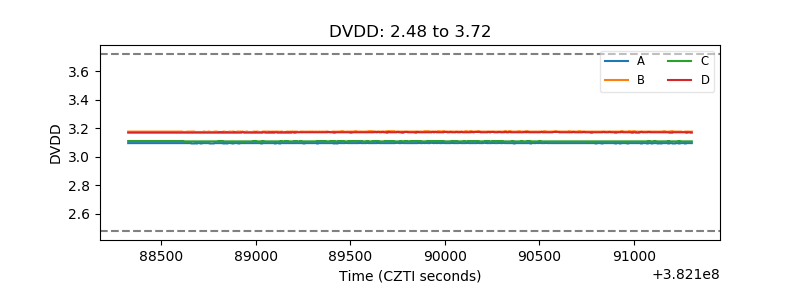 |
| Temperature 1 | 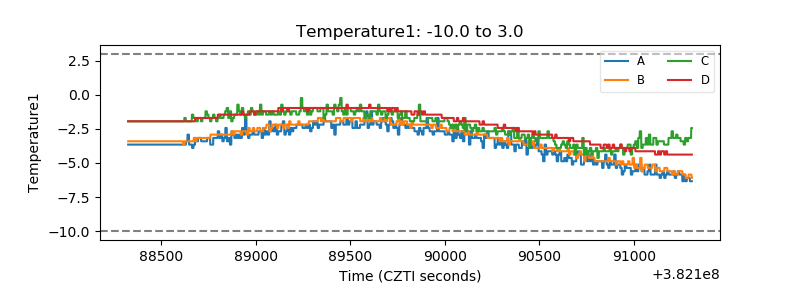 |
| Veto HV Monitor |  |
| Veto LLD | 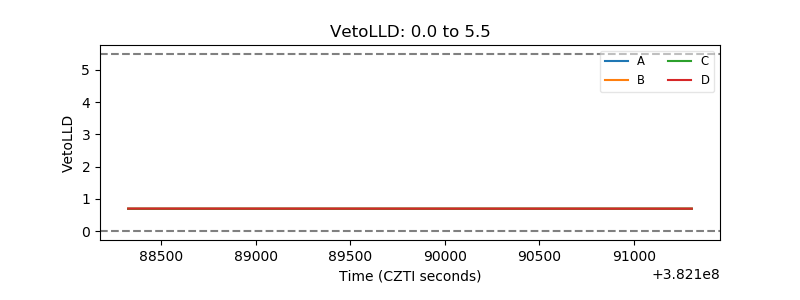 |
| Alpha Counter | 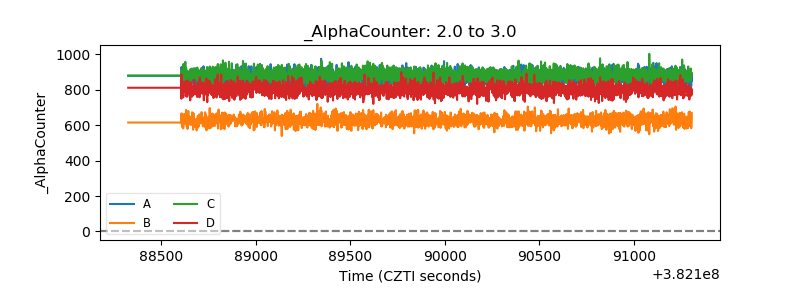 |
| _CPM_Rate | 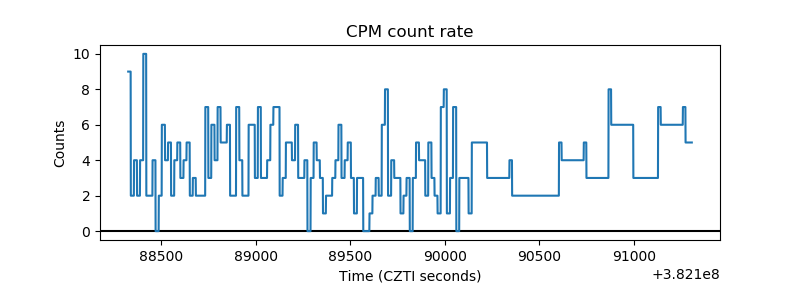 |
| CZT Counter | 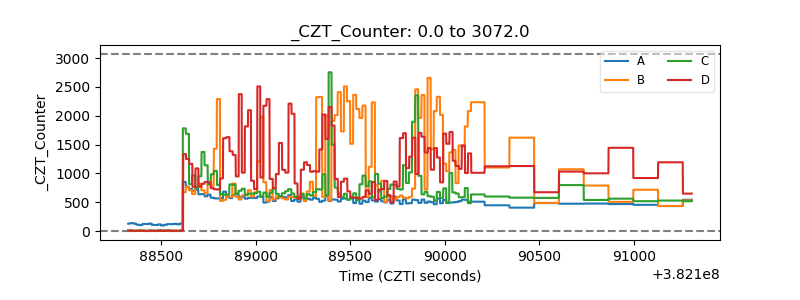 |
| +2.5 Volts monitor | 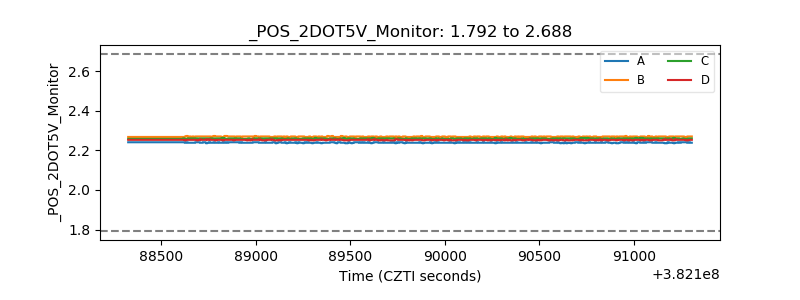 |
| +5 Volts monitor | 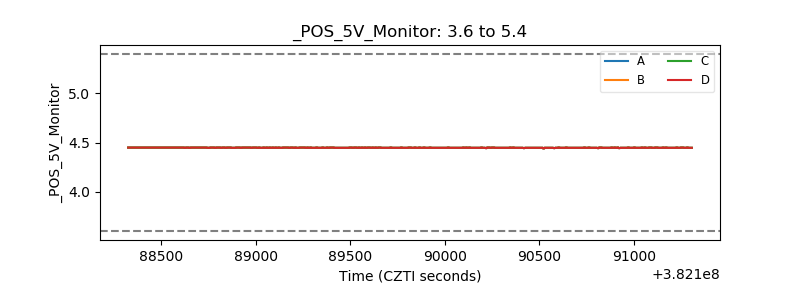 |
| _ROLL_ROT | 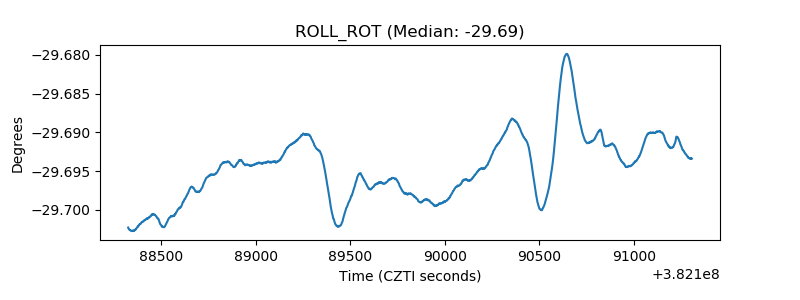 |
| _Roll_DEC | 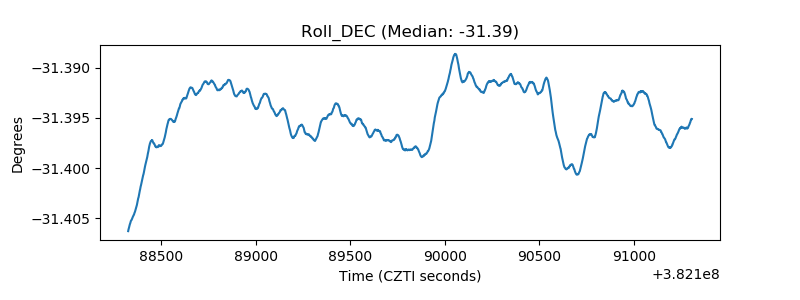 |
| _Roll_RA | 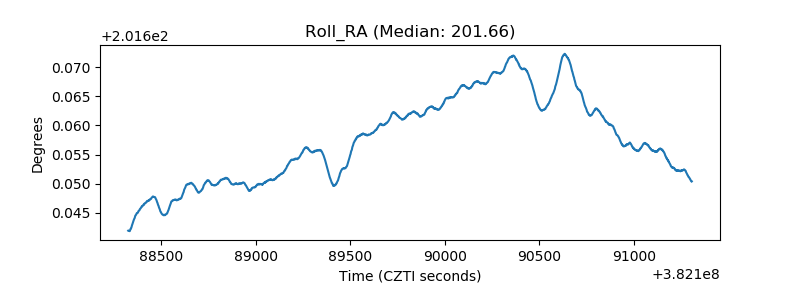 |
| Veto Counter | 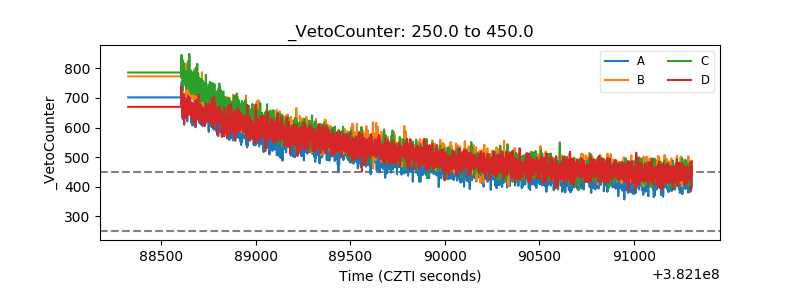 |