| Param | Original file | Final file |
|---|---|---|
| Filename | modeM0/AS1A10_058T05_9000004918_34449cztM0_level2.evt | modeM0/AS1A10_058T05_9000004918_34449cztM0_level2_quad_clean.evt |
| Size (bytes) | 585,034,560 | 52,076,160 |
| Size | 557.9 MB | 49.7 MB |
| Events in quadrant A | 2,849,828 | 309,226 |
| Events in quadrant B | 4,323,832 | 294,601 |
| Events in quadrant C | 4,140,366 | 302,350 |
| Events in quadrant D | 6,028,916 | 281,886 |
| Mode M9 | |||
|---|---|---|---|
| Quadrant | BADHDUFLAG | Total packets | Discarded packets |
| A | 0 | 29 | 0 |
| B | 0 | 29 | 0 |
| C | 0 | 29 | 0 |
| D | 0 | 30 | 0 |
| Mode M0 | |||
|---|---|---|---|
| Quadrant | BADHDUFLAG | Total packets | Discarded packets |
| A | 0 | 11774 | 3 |
| B | 0 | 16290 | 2 |
| C | 0 | 16574 | 2 |
| D | 0 | 22008 | 2 |
| Mode SS | |||
|---|---|---|---|
| Quadrant | BADHDUFLAG | Total packets | Discarded packets |
| A | 0 | 112 | 0 |
| B | 0 | 112 | 0 |
| C | 0 | 112 | 0 |
| D | 0 | 112 | 0 |
| Quadrant | Total seconds | Saturated seconds | Saturation percentage |
|---|---|---|---|
| A | 5552 | 8 | 0.144092% |
| B | 5552 | 586 | 10.554755% |
| C | 5552 | 52 | 0.936599% |
| D | 5552 | 420 | 7.564841% |
Noise dominated data is calculated using 1-second bins in cleaned event files. If a bin has >2000 counts, and if more than 50% of those come from <1% of pixels, then it is considered to be noise-dominated and hence unusable.
| Quadrant | # 1 sec bins | Bins with >0 counts | Bins with >2000 counts | High rate bins dominated by noise | Noise dominated (total time) | Noise dominated (detector-on time) | Marked lightcurve |
|---|---|---|---|---|---|---|---|
| A | 7434 | 5553 | 0 | 0 | 0.00% | 0.00% | 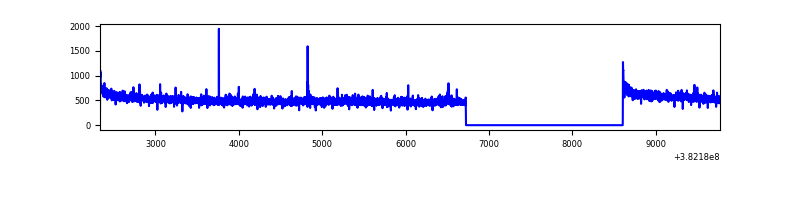 |
| B | 7434 | 5552 | 457 | 457 | 6.15% | 8.23% | 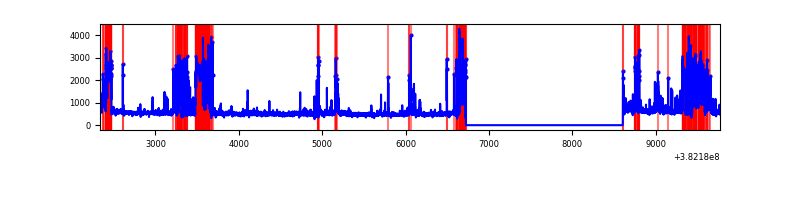 |
| C | 7434 | 5553 | 38 | 38 | 0.51% | 0.68% | 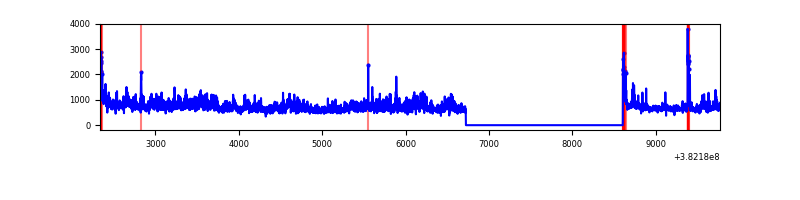 |
| D | 7434 | 5553 | 416 | 416 | 5.60% | 7.49% | 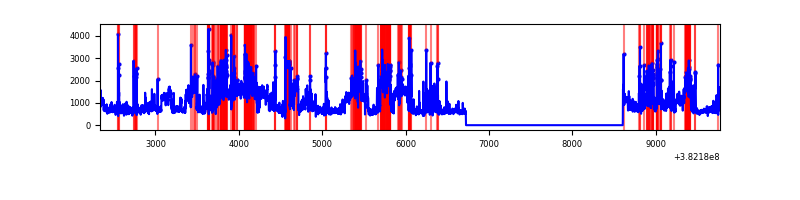 |
Top three noisy pixels from each quadrant. If the there are fewer than three noisy pixels in the level2.evt file, extra rows are filled as -1
| Pixel properties | Quadrant properties | ||||||
|---|---|---|---|---|---|---|---|
| Quadrant | DetID | PixID | Counts | Sigma | Mean | Median | Sigma |
| A | 10 | 83 | 36771 | 251.65 | 721 | 710 | 143.3 |
| A | 13 | 6 | 15407 | 102.56 | 721 | 710 | 143.3 |
| A | 9 | 143 | 10653 | 69.39 | 721 | 710 | 143.3 |
| B | 5 | 172 | 1268200 | 10142.56 | 670 | 652 | 125.0 |
| B | 0 | 229 | 184282 | 1469.36 | 670 | 652 | 125.0 |
| B | 0 | 190 | 66571 | 527.47 | 670 | 652 | 125.0 |
| C | 4 | 254 | 1147211 | 7212.45 | 693 | 700 | 159.0 |
| C | 15 | 214 | 236843 | 1485.52 | 693 | 700 | 159.0 |
| C | 0 | 10 | 37821 | 233.52 | 693 | 700 | 159.0 |
| D | 8 | 195 | 1801739 | 10917.59 | 683 | 666 | 165.0 |
| D | 7 | 80 | 560153 | 3391.45 | 683 | 666 | 165.0 |
| D | 2 | 249 | 261454 | 1580.82 | 683 | 666 | 165.0 |
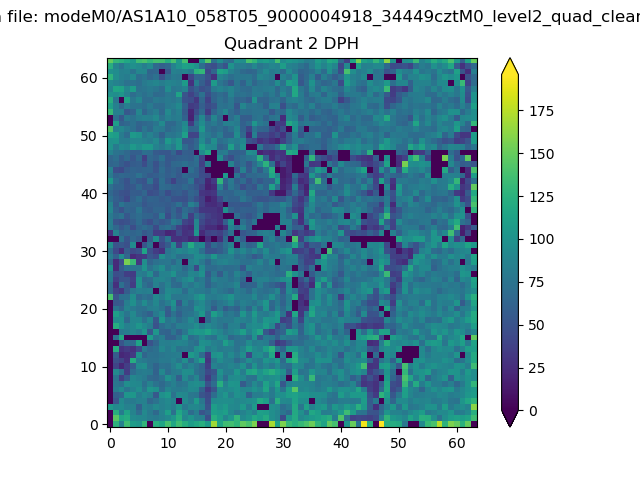
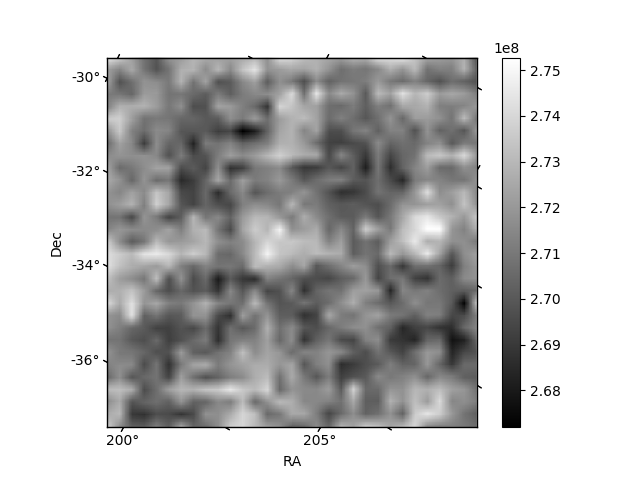
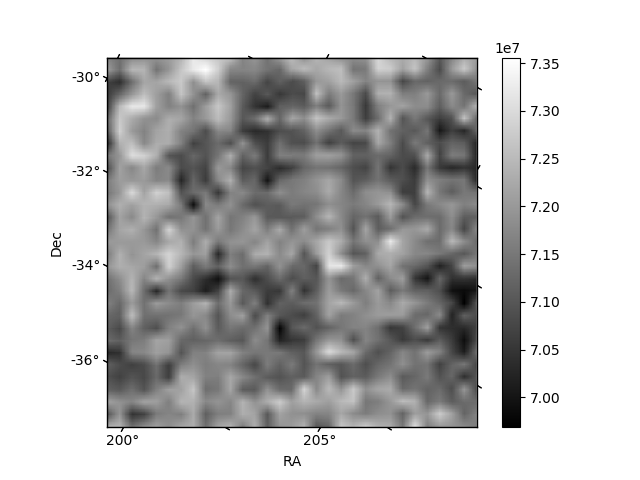
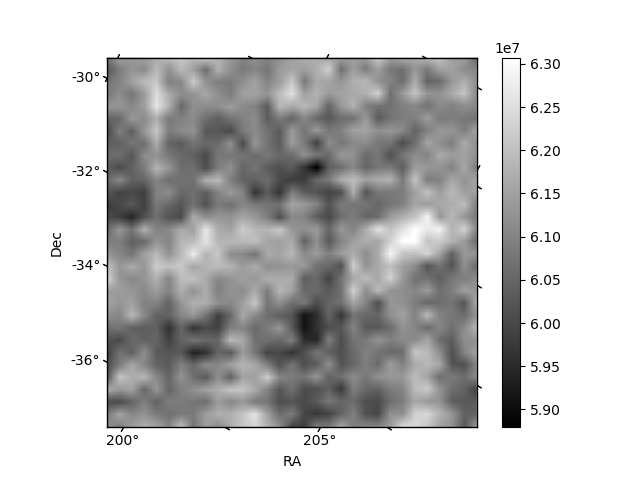
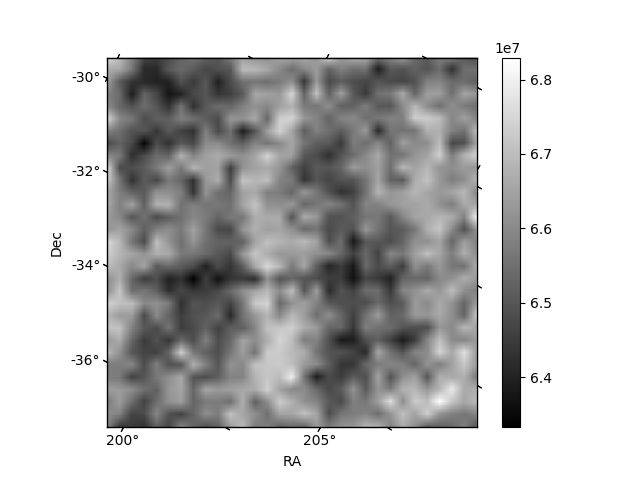
Histogram calculated using DETX and DETY for each event in the final _common_clean file
| Quadrant A | 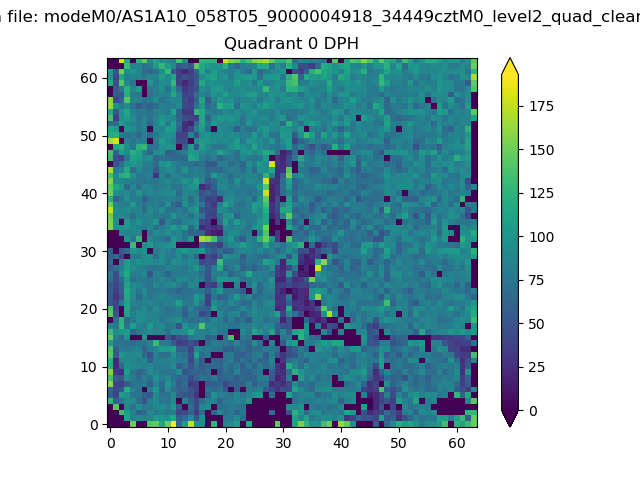 |
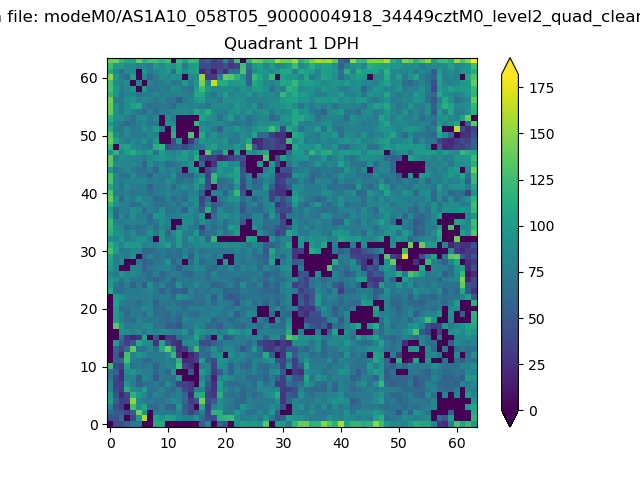 |
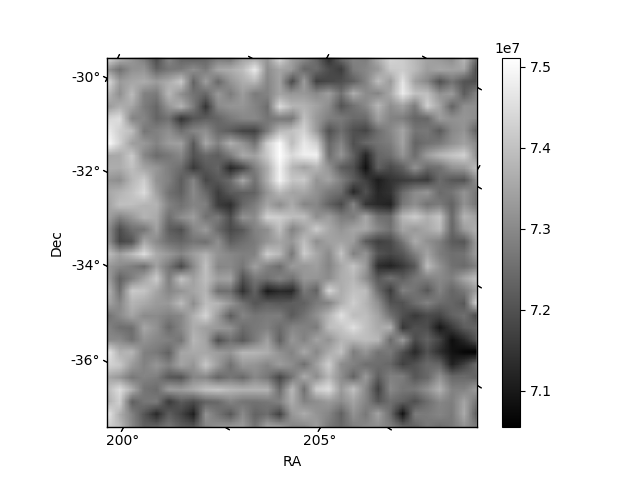
Quadrant B |
|---|---|---|---|
| Quadrant D | 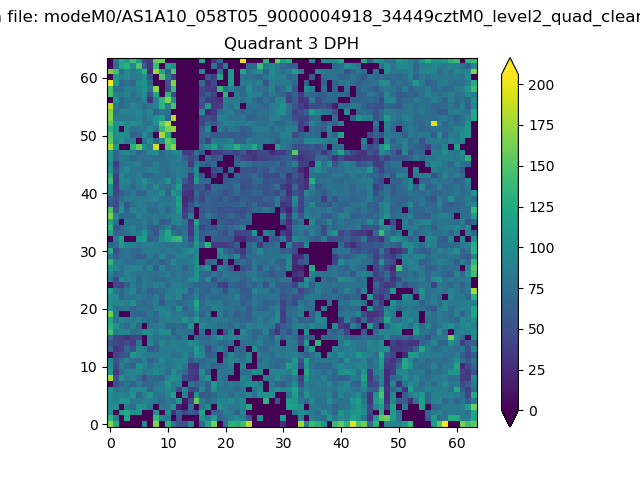 |
 |
Quadrant C |
| Plot type | Count rate plots | Images |
|---|---|---|
| Comparison with Poisson distribution Blue bars denote a histogram of data divided into 1 sec bins. Red curve is a Poisson curve with rate = median count rate of data. |
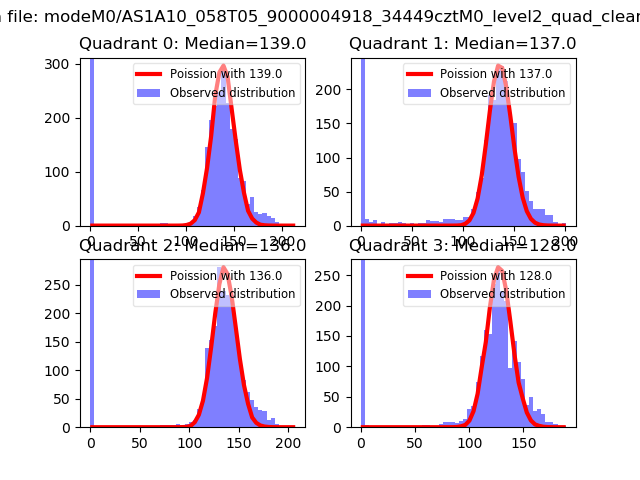 |
 |
| Quadrant-wise count rates Data is divided into 100 sec bins |
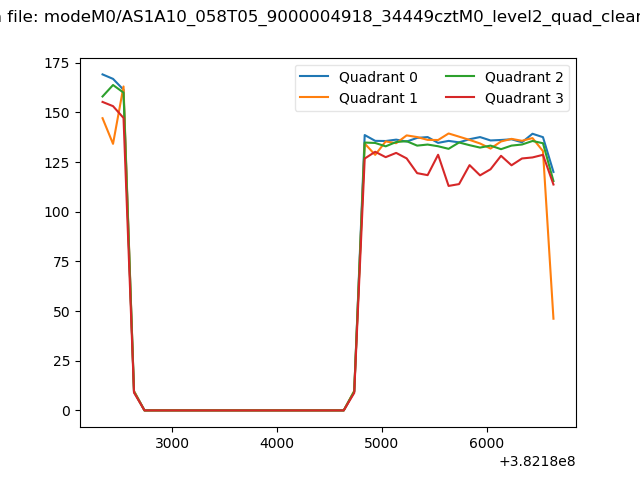 |
|
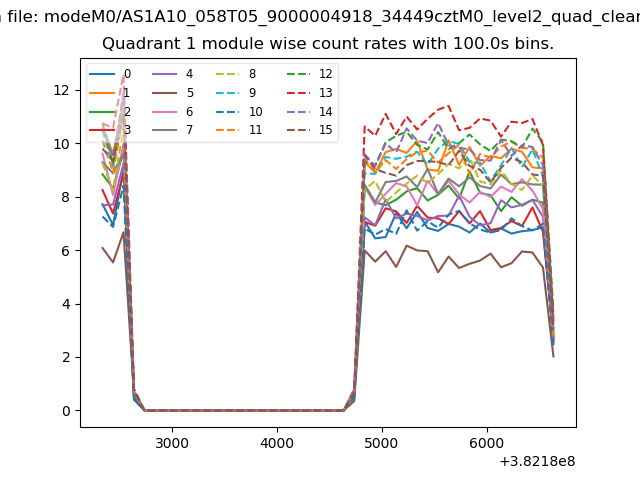
| Module-wise count rates for Quadrant A Data is divided into 100 sec bins |
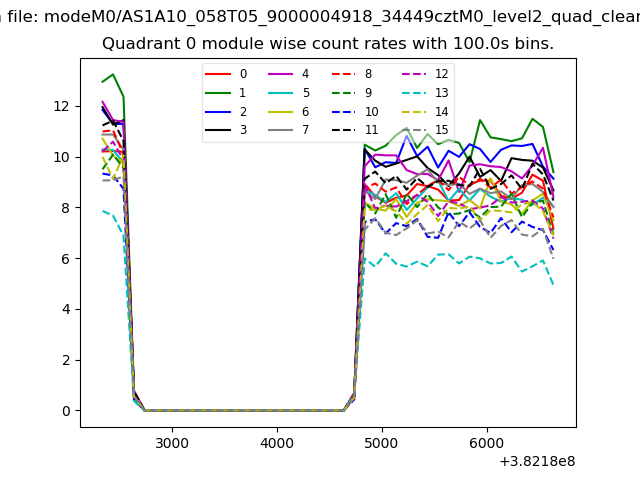 |
 |
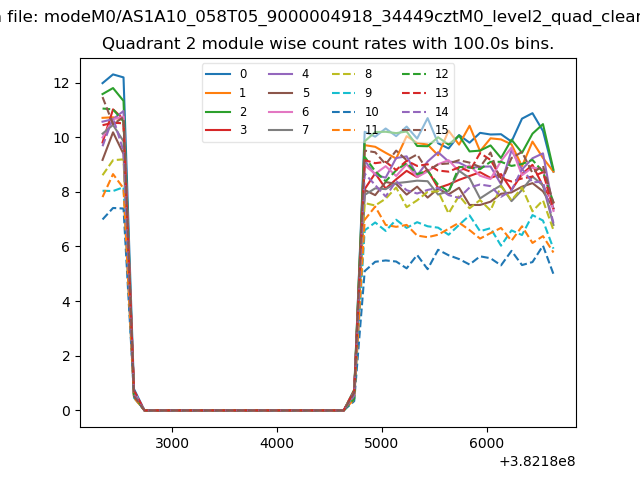
| Module-wise count rates for Quadrant B Data is divided into 100 sec bins |
 |
 |
| Module-wise count rates for Quadrant C Data is divided into 100 sec bins |
 |
 |
| Module-wise count rates for Quadrant D Data is divided into 100 sec bins |
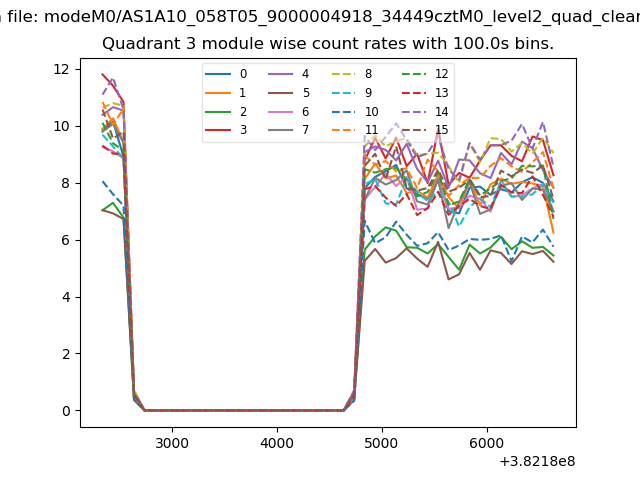 |
 |
| Parameter | Plot |
|---|---|
| CZT HV Monitor | 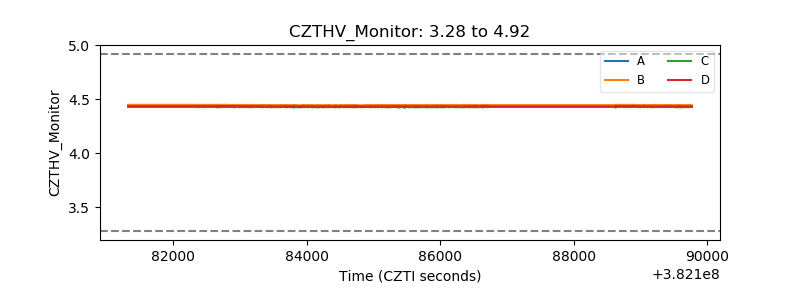 |
| D_VDD | 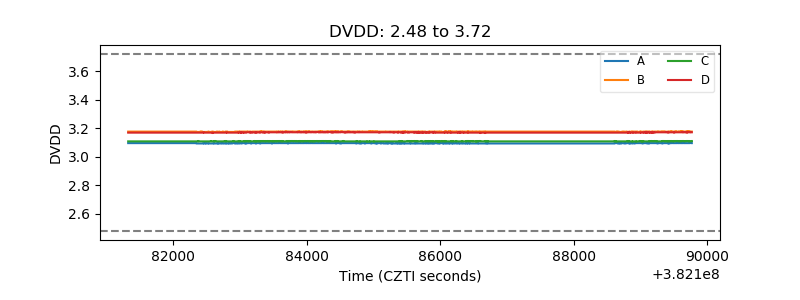 |
| Temperature 1 |  |
| Veto HV Monitor | 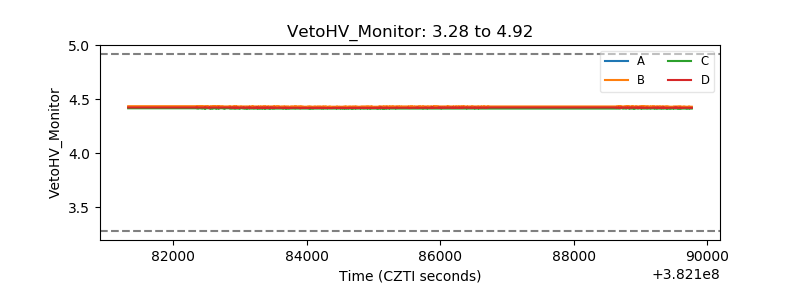 |
| Veto LLD | 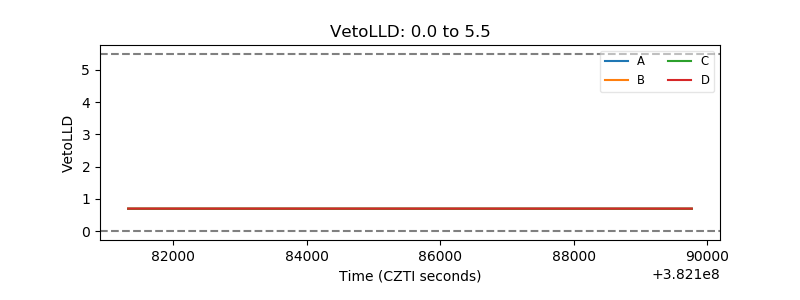 |
| Alpha Counter | 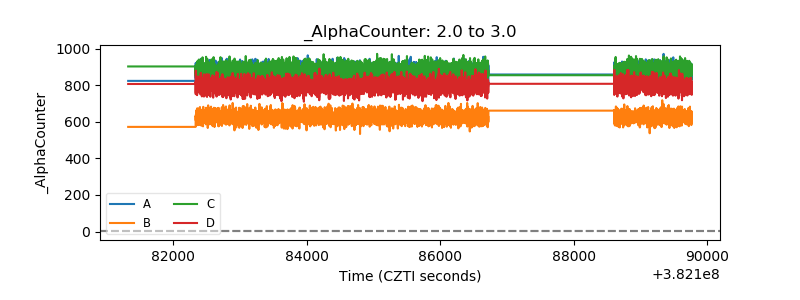 |
| _CPM_Rate | 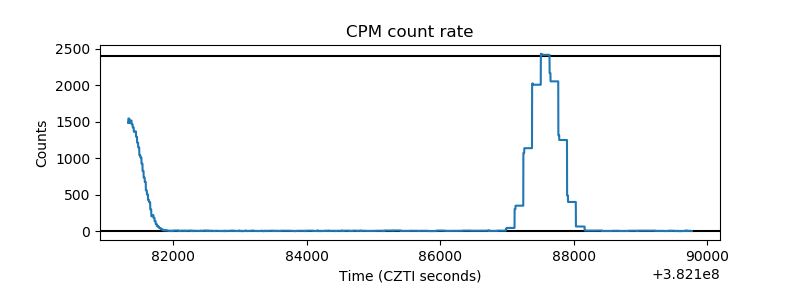 |
| CZT Counter | 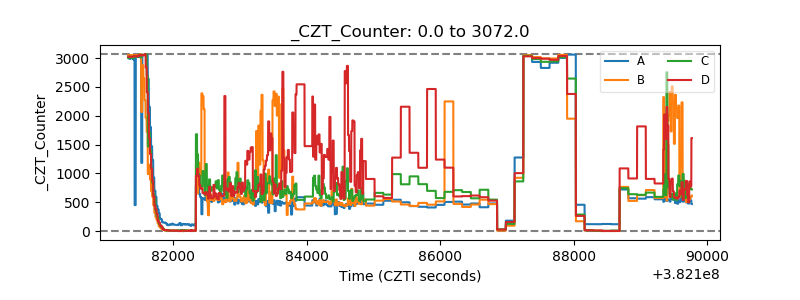 |
| +2.5 Volts monitor | 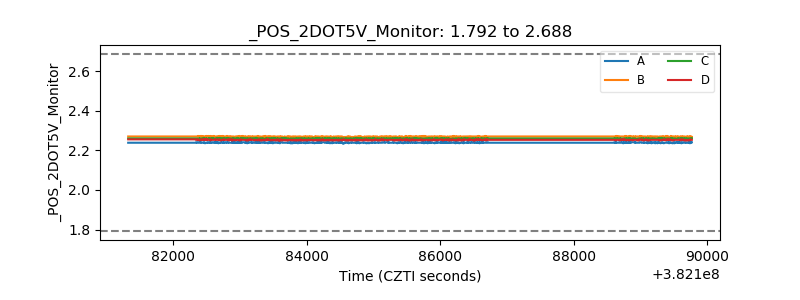 |
| +5 Volts monitor | 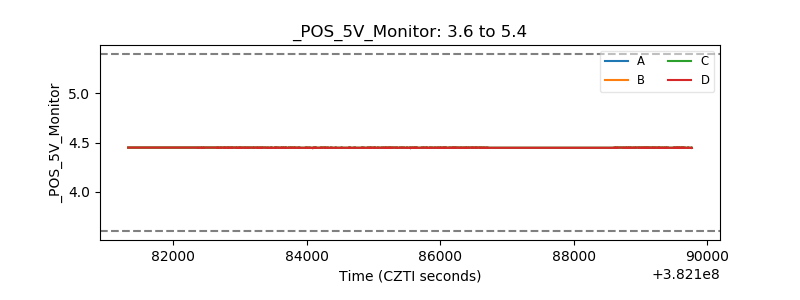 |
| _ROLL_ROT | 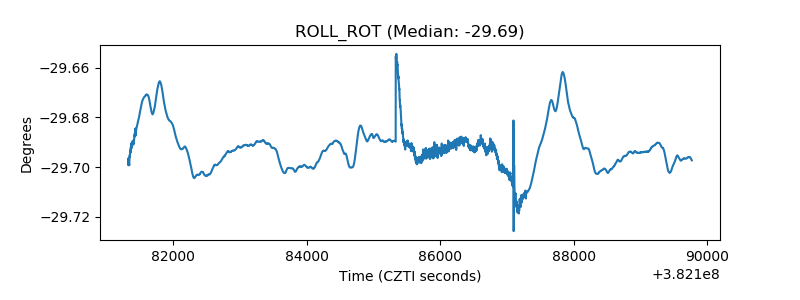 |
| _Roll_DEC | 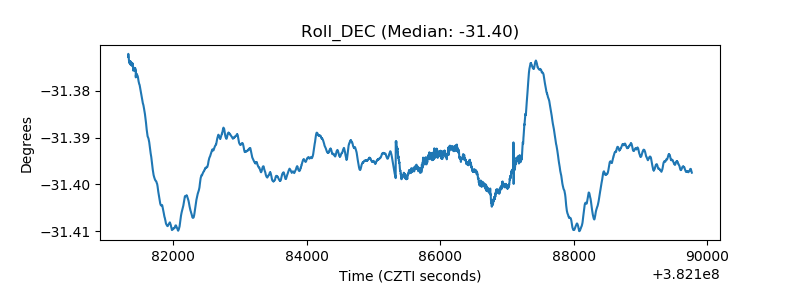 |
| _Roll_RA | 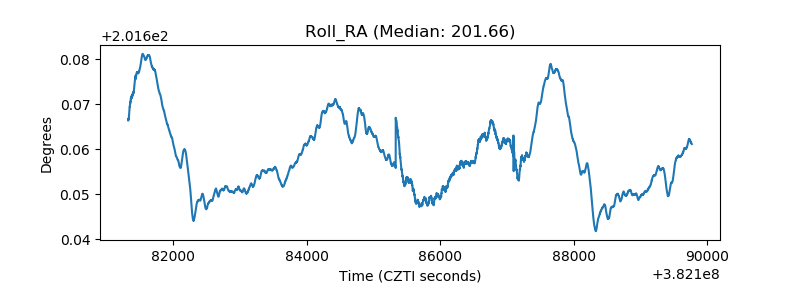 |
| Veto Counter | 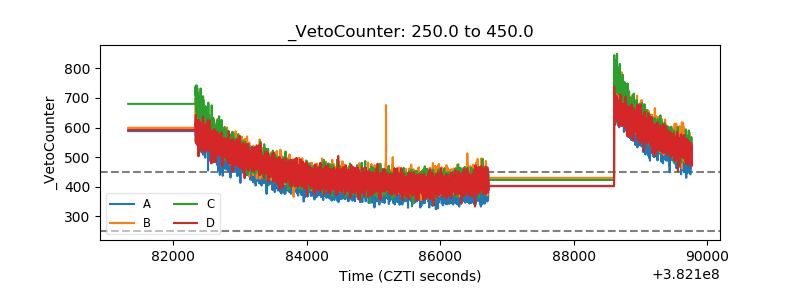 |