| Param | Original file | Final file |
|---|---|---|
| Filename | modeM0/AS1A10_058T05_9000004918_34445cztM0_level2.evt | modeM0/AS1A10_058T05_9000004918_34445cztM0_level2_quad_clean.evt |
| Size (bytes) | 1,781,424,000 | 197,481,600 |
| Size | 1.7 GB | 188.3 MB |
| Events in quadrant A | 8,540,171 | 1,215,532 |
| Events in quadrant B | 12,504,268 | 1,212,763 |
| Events in quadrant C | 9,522,595 | 1,207,230 |
| Events in quadrant D | 22,143,289 | 1,074,280 |
| Mode M9 | |||
|---|---|---|---|
| Quadrant | BADHDUFLAG | Total packets | Discarded packets |
| A | 0 | 54 | 0 |
| B | 0 | 54 | 0 |
| C | 0 | 54 | 0 |
| D | 0 | 54 | 0 |
| Mode M0 | |||
|---|---|---|---|
| Quadrant | BADHDUFLAG | Total packets | Discarded packets |
| A | 0 | 37400 | 5 |
| B | 0 | 49331 | 4 |
| C | 0 | 38922 | 4 |
| D | 0 | 78675 | 4 |
| Mode SS | |||
|---|---|---|---|
| Quadrant | BADHDUFLAG | Total packets | Discarded packets |
| A | 0 | 378 | 0 |
| B | 0 | 378 | 0 |
| C | 0 | 378 | 0 |
| D | 0 | 378 | 0 |
| Quadrant | Total seconds | Saturated seconds | Saturation percentage |
|---|---|---|---|
| A | 18435 | 26 | 0.141036% |
| B | 18435 | 1183 | 6.417141% |
| C | 18435 | 42 | 0.227828% |
| D | 18435 | 2268 | 12.302685% |
Noise dominated data is calculated using 1-second bins in cleaned event files. If a bin has >2000 counts, and if more than 50% of those come from <1% of pixels, then it is considered to be noise-dominated and hence unusable.
| Quadrant | # 1 sec bins | Bins with >0 counts | Bins with >2000 counts | High rate bins dominated by noise | Noise dominated (total time) | Noise dominated (detector-on time) | Marked lightcurve |
|---|---|---|---|---|---|---|---|
| A | 23896 | 18439 | 5 | 5 | 0.02% | 0.03% | 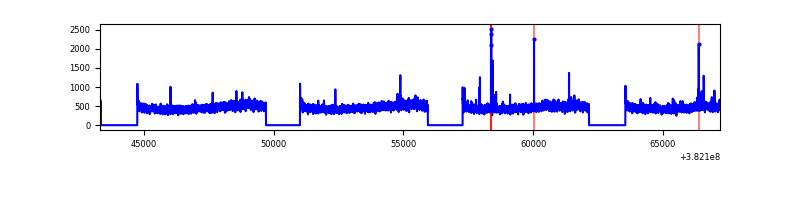 |
| B | 23896 | 18439 | 830 | 830 | 3.47% | 4.50% | 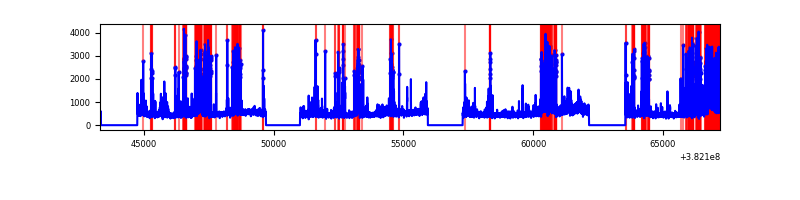 |
| C | 23896 | 18439 | 23 | 23 | 0.10% | 0.12% | 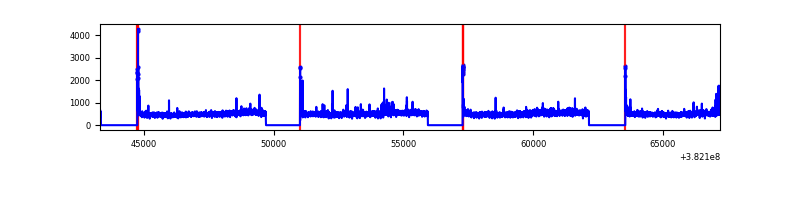 |
| D | 23896 | 18439 | 1873 | 1873 | 7.84% | 10.16% | 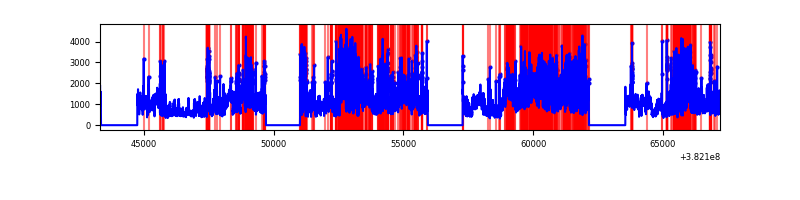 |
Top three noisy pixels from each quadrant. If the there are fewer than three noisy pixels in the level2.evt file, extra rows are filled as -1
| Pixel properties | Quadrant properties | ||||||
|---|---|---|---|---|---|---|---|
| Quadrant | DetID | PixID | Counts | Sigma | Mean | Median | Sigma |
| A | 10 | 83 | 82293 | 184.63 | 2169 | 2125 | 434.2 |
| A | 0 | 31 | 37102 | 80.55 | 2169 | 2125 | 434.2 |
| A | 13 | 254 | 30038 | 64.28 | 2169 | 2125 | 434.2 |
| B | 5 | 172 | 3315087 | 8306.56 | 2094 | 2036 | 398.8 |
| B | 0 | 190 | 397734 | 992.1 | 2094 | 2036 | 398.8 |
| B | 0 | 229 | 335380 | 835.77 | 2094 | 2036 | 398.8 |
| C | 15 | 214 | 766741 | 1568.76 | 2115 | 2128 | 487.4 |
| C | 3 | 233 | 163414 | 330.91 | 2115 | 2128 | 487.4 |
| C | 0 | 10 | 147328 | 297.91 | 2115 | 2128 | 487.4 |
| D | 8 | 195 | 7298510 | 14699.29 | 2030 | 1970 | 496.4 |
| D | 12 | 235 | 2394402 | 4819.69 | 2030 | 1970 | 496.4 |
| D | 13 | 249 | 1237282 | 2488.61 | 2030 | 1970 | 496.4 |
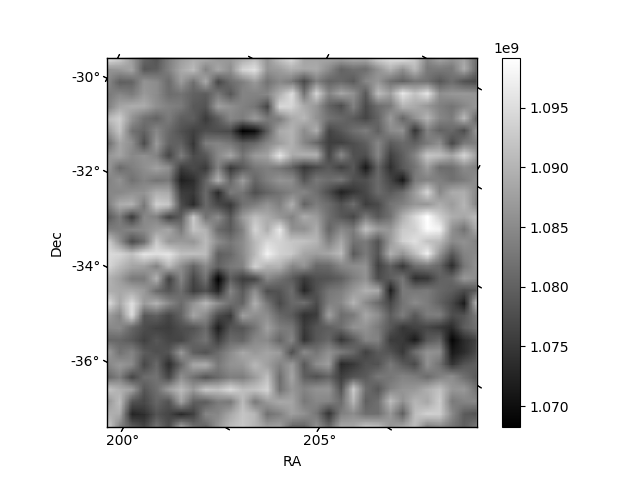
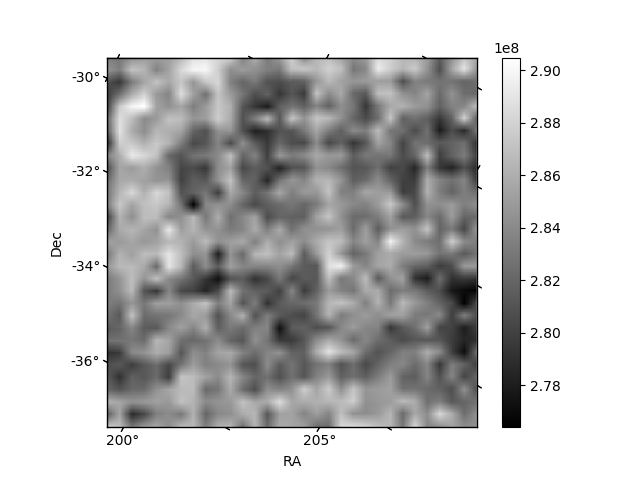
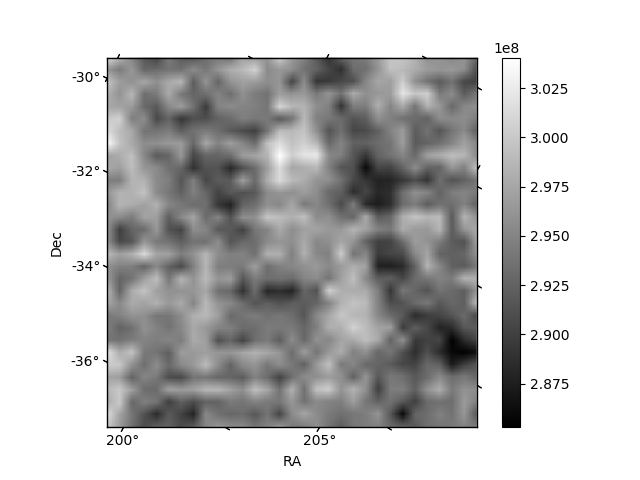
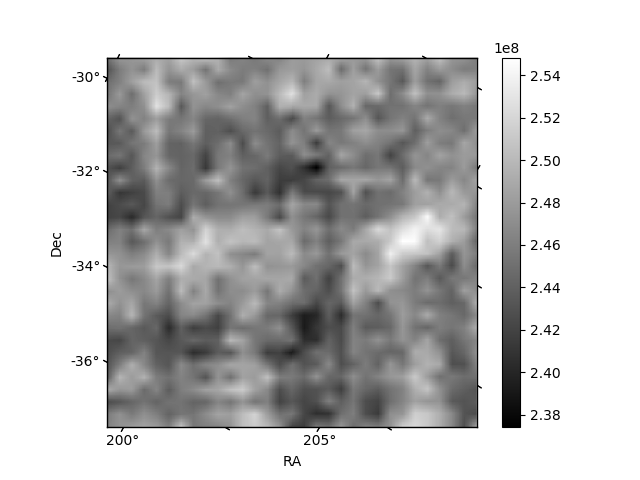
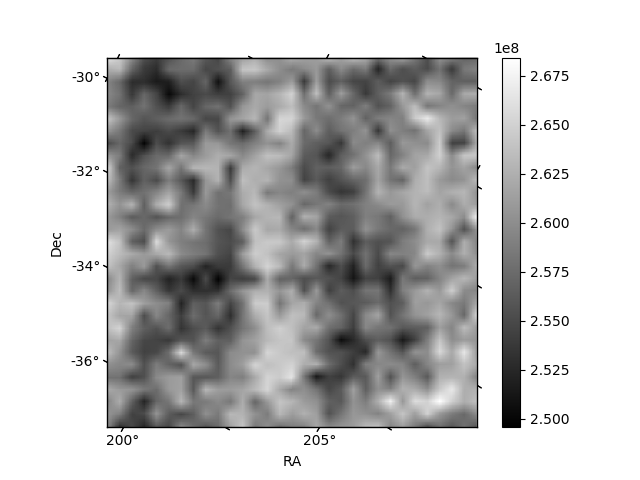
Histogram calculated using DETX and DETY for each event in the final _common_clean file
| Quadrant A | 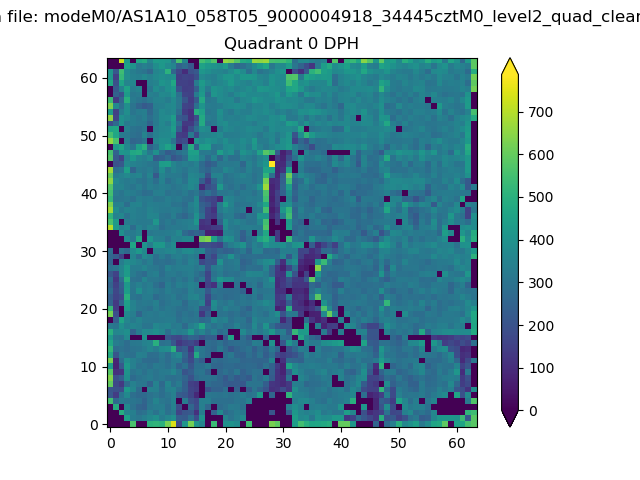 |
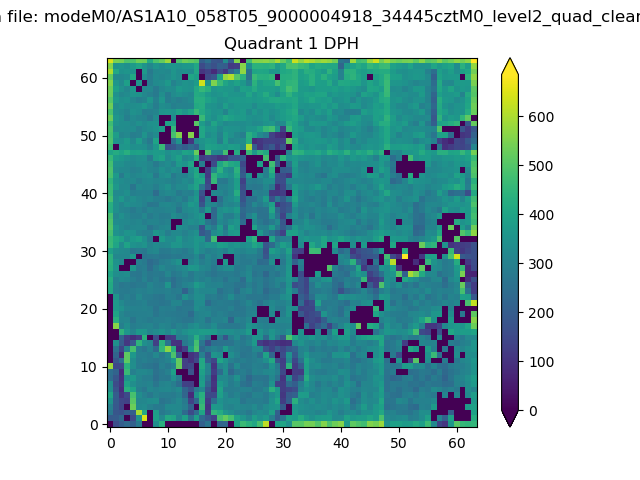 |
Quadrant B |
|---|---|---|---|
| Quadrant D | 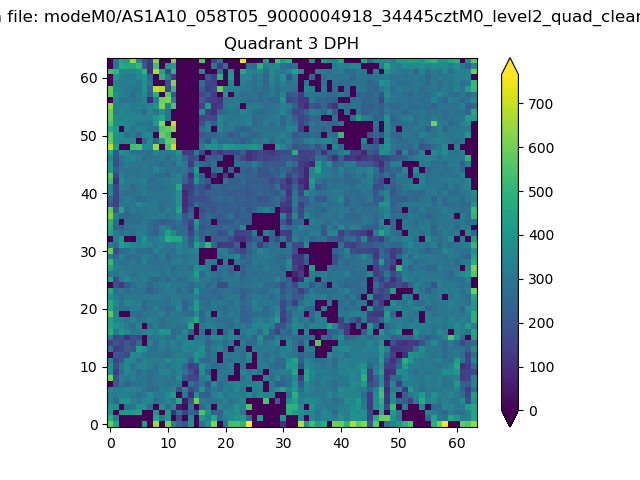 |
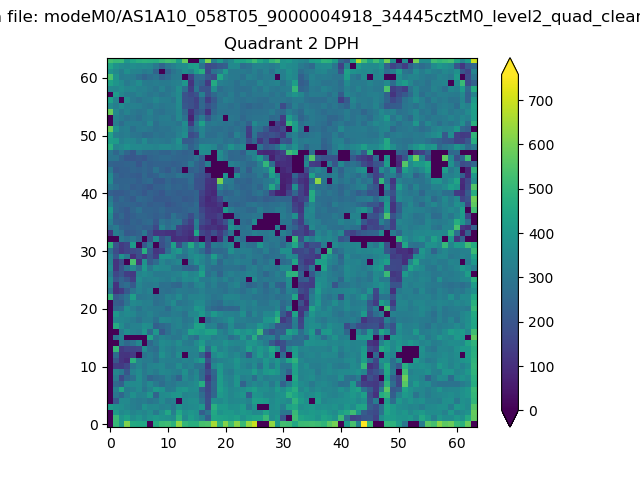 |
Quadrant C |
| Plot type | Count rate plots | Images |
|---|---|---|
| Comparison with Poisson distribution Blue bars denote a histogram of data divided into 1 sec bins. Red curve is a Poisson curve with rate = median count rate of data. |
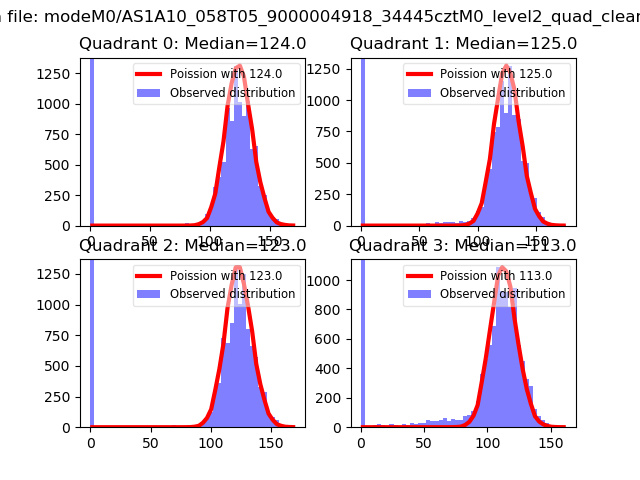 |
 |
| Quadrant-wise count rates Data is divided into 100 sec bins |
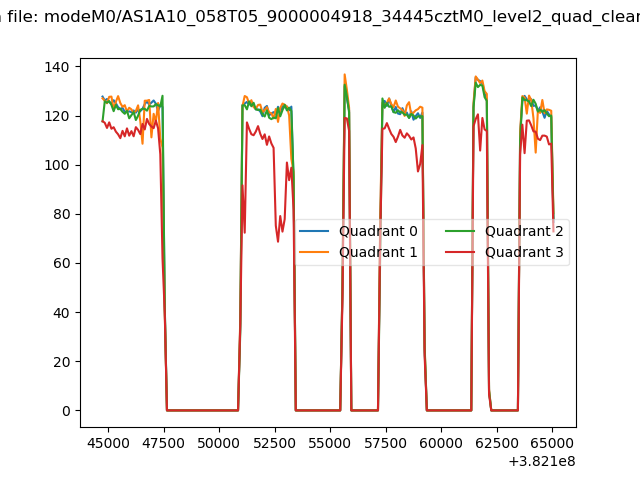 |
|
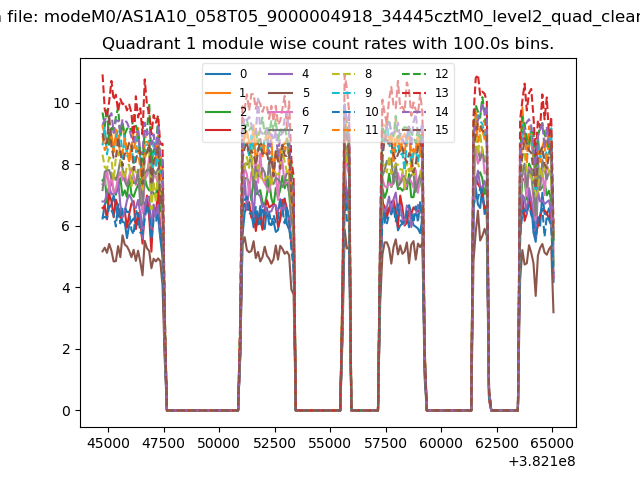
| Module-wise count rates for Quadrant A Data is divided into 100 sec bins |
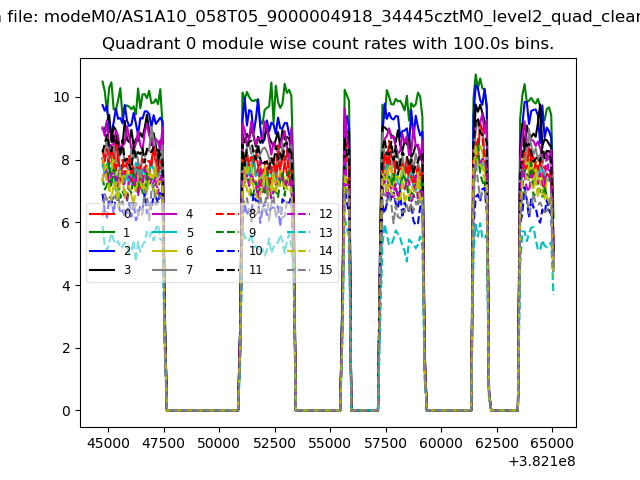 |
 |
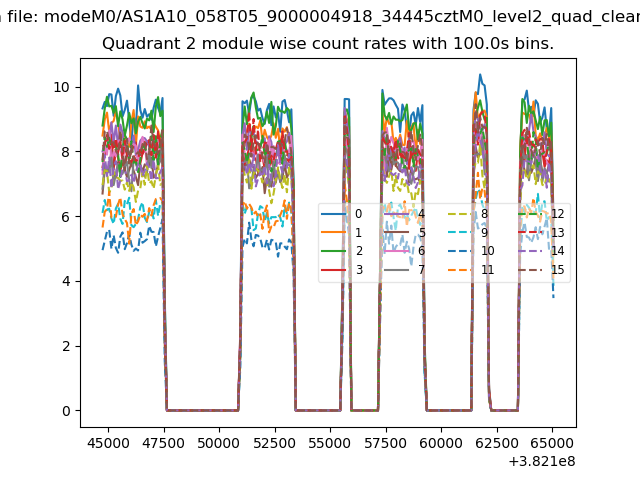
| Module-wise count rates for Quadrant B Data is divided into 100 sec bins |
 |
 |
| Module-wise count rates for Quadrant C Data is divided into 100 sec bins |
 |
 |
| Module-wise count rates for Quadrant D Data is divided into 100 sec bins |
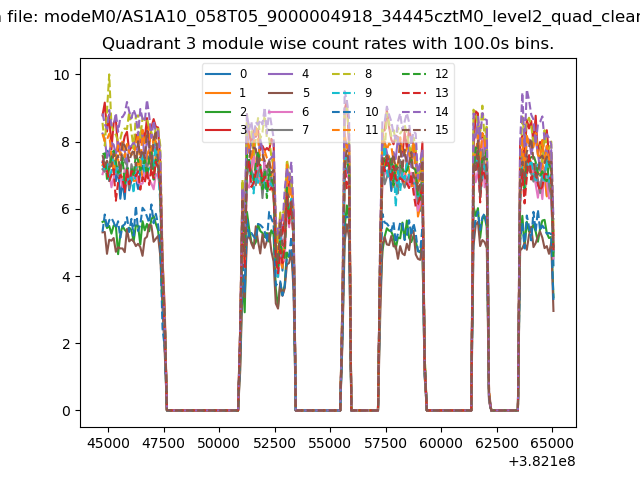 |
 |
| Parameter | Plot |
|---|---|
| CZT HV Monitor | 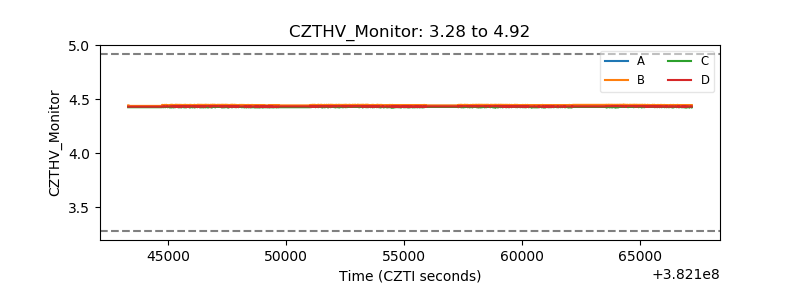 |
| D_VDD | 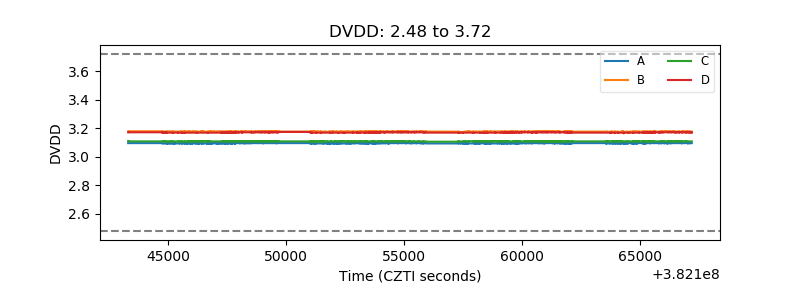 |
| Temperature 1 | 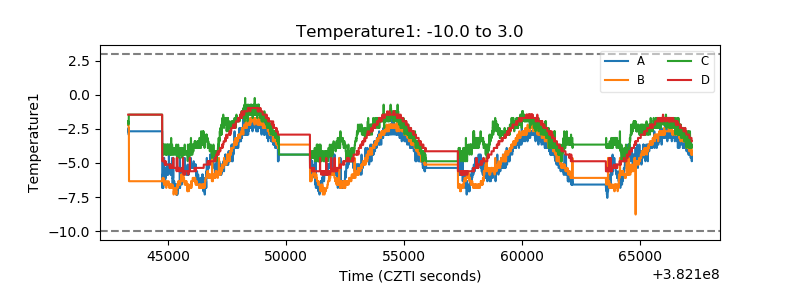 |
| Veto HV Monitor | 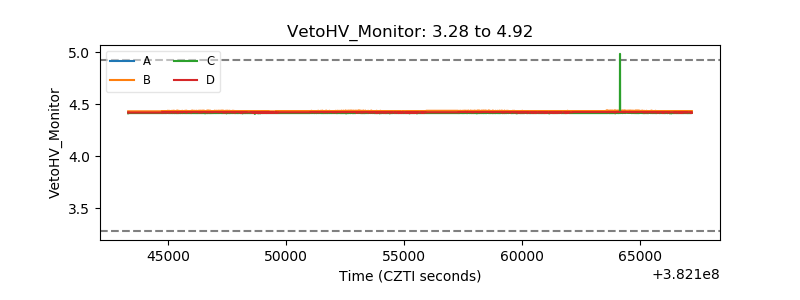 |
| Veto LLD | 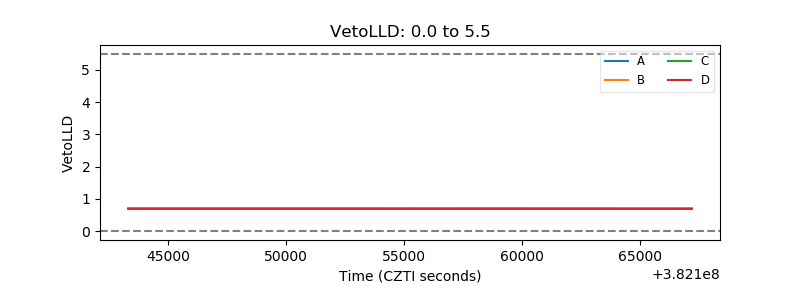 |
| Alpha Counter | 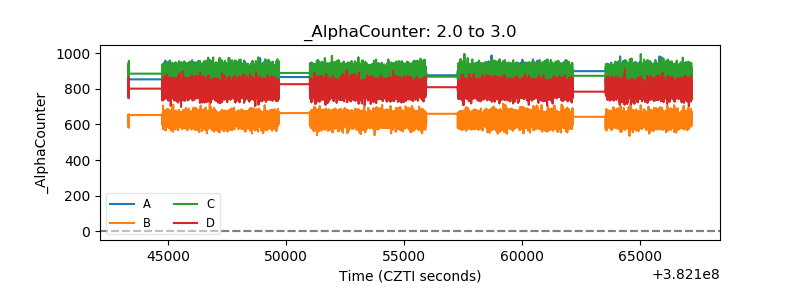 |
| _CPM_Rate | 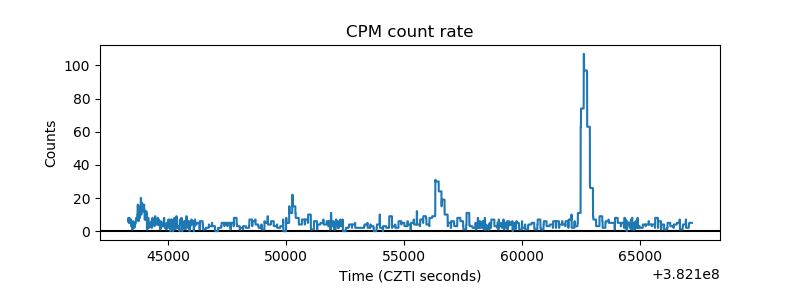 |
| CZT Counter | 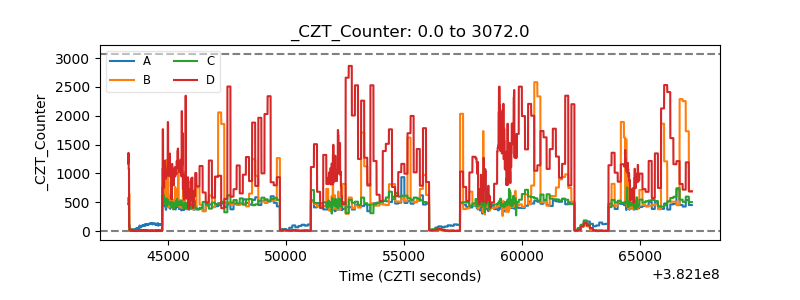 |
| +2.5 Volts monitor | 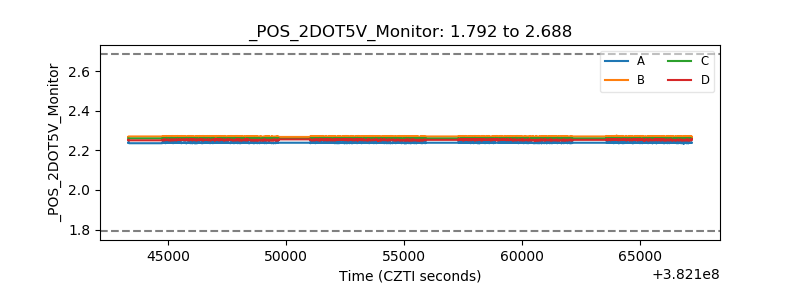 |
| +5 Volts monitor | 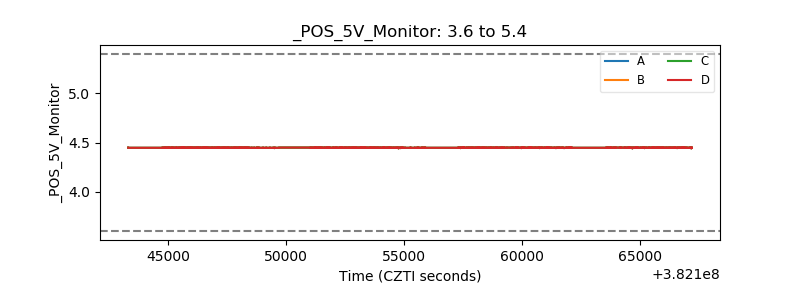 |
| _ROLL_ROT | 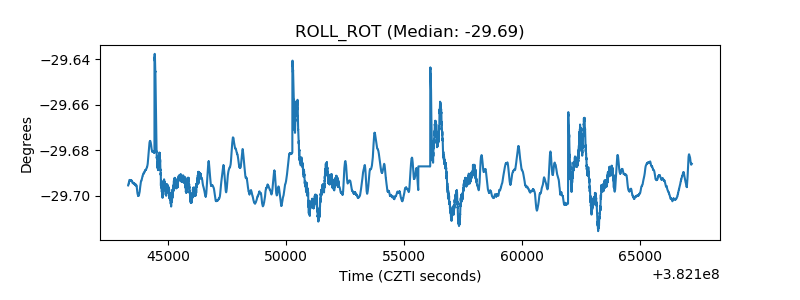 |
| _Roll_DEC | 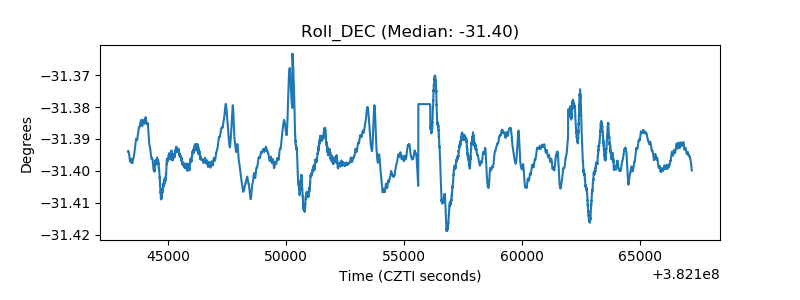 |
| _Roll_RA | 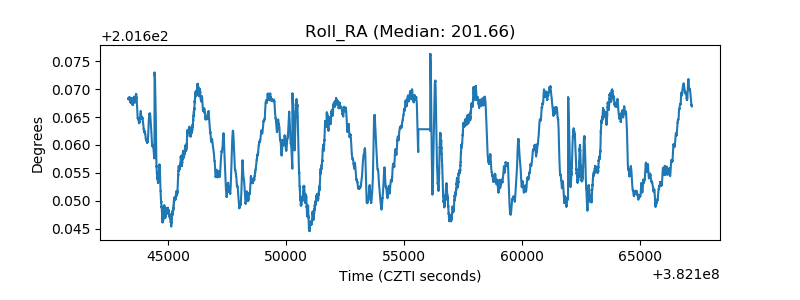 |
| Veto Counter | 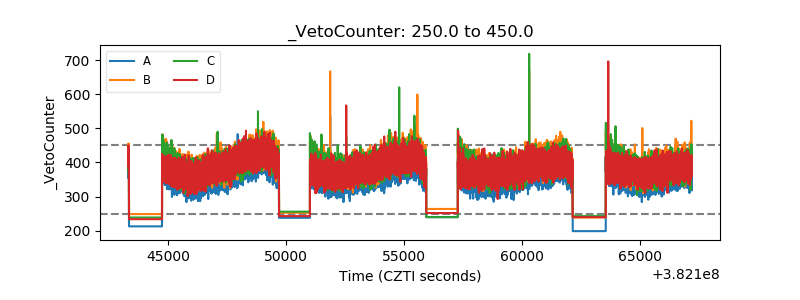 |