| Param | Original file | Final file |
|---|---|---|
| Filename | modeM0/AS1A10_058T05_9000004918_34441cztM0_level2.evt | modeM0/AS1A10_058T05_9000004918_34441cztM0_level2_quad_clean.evt |
| Size (bytes) | 507,277,440 | 79,421,760 |
| Size | 483.8 MB | 75.7 MB |
| Events in quadrant A | 2,638,972 | 517,970 |
| Events in quadrant B | 3,169,810 | 522,902 |
| Events in quadrant C | 3,219,293 | 507,980 |
| Events in quadrant D | 5,947,619 | 456,489 |
| Mode M9 | |||
|---|---|---|---|
| Quadrant | BADHDUFLAG | Total packets | Discarded packets |
| A | 0 | 24 | 0 |
| B | 0 | 24 | 0 |
| C | 0 | 24 | 0 |
| D | 0 | 25 | 0 |
| Mode M0 | |||
|---|---|---|---|
| Quadrant | BADHDUFLAG | Total packets | Discarded packets |
| A | 0 | 11651 | 3 |
| B | 0 | 13131 | 2 |
| C | 0 | 12873 | 2 |
| D | 0 | 21705 | 2 |
| Mode SS | |||
|---|---|---|---|
| Quadrant | BADHDUFLAG | Total packets | Discarded packets |
| A | 0 | 116 | 0 |
| B | 0 | 116 | 0 |
| C | 0 | 116 | 0 |
| D | 0 | 116 | 0 |
| Quadrant | Total seconds | Saturated seconds | Saturation percentage |
|---|---|---|---|
| A | 5714 | 4 | 0.070004% |
| B | 5714 | 164 | 2.870144% |
| C | 5714 | 80 | 1.400070% |
| D | 5714 | 441 | 7.717886% |
Noise dominated data is calculated using 1-second bins in cleaned event files. If a bin has >2000 counts, and if more than 50% of those come from <1% of pixels, then it is considered to be noise-dominated and hence unusable.
| Quadrant | # 1 sec bins | Bins with >0 counts | Bins with >2000 counts | High rate bins dominated by noise | Noise dominated (total time) | Noise dominated (detector-on time) | Marked lightcurve |
|---|---|---|---|---|---|---|---|
| A | 7117 | 5715 | 1 | 1 | 0.01% | 0.02% | 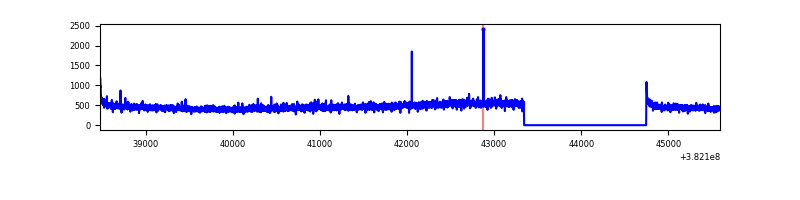 |
| B | 7117 | 5715 | 119 | 119 | 1.67% | 2.08% | 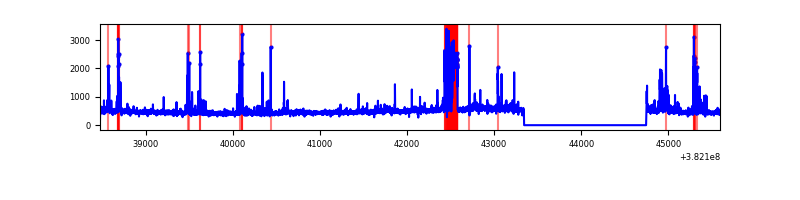 |
| C | 7117 | 5715 | 69 | 69 | 0.97% | 1.21% | 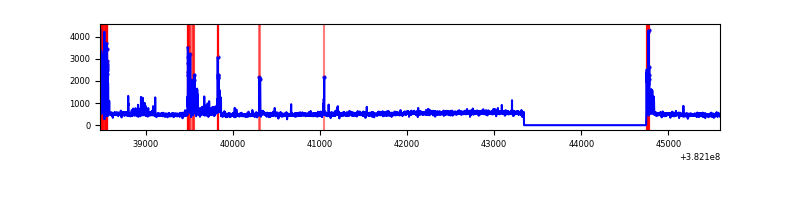 |
| D | 7117 | 5715 | 423 | 423 | 5.94% | 7.40% | 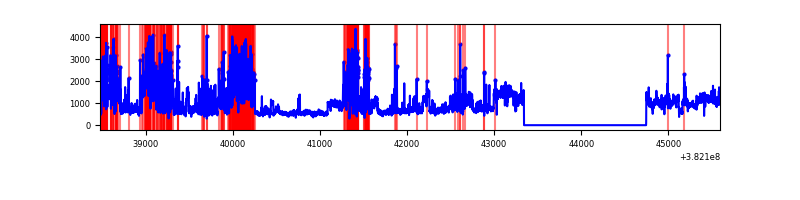 |
Top three noisy pixels from each quadrant. If the there are fewer than three noisy pixels in the level2.evt file, extra rows are filled as -1
| Pixel properties | Quadrant properties | ||||||
|---|---|---|---|---|---|---|---|
| Quadrant | DetID | PixID | Counts | Sigma | Mean | Median | Sigma |
| A | 10 | 83 | 36212 | 265.49 | 669 | 656 | 133.9 |
| A | 13 | 254 | 10182 | 71.13 | 669 | 656 | 133.9 |
| A | 10 | 255 | 7707 | 52.65 | 669 | 656 | 133.9 |
| B | 5 | 172 | 390803 | 3034.2 | 661 | 643 | 128.6 |
| B | 0 | 229 | 61064 | 469.88 | 661 | 643 | 128.6 |
| B | 5 | 31 | 56190 | 431.98 | 661 | 643 | 128.6 |
| C | 15 | 214 | 240766 | 1582.25 | 651 | 657 | 151.8 |
| C | 14 | 254 | 223812 | 1470.53 | 651 | 657 | 151.8 |
| C | 0 | 10 | 180328 | 1183.98 | 651 | 657 | 151.8 |
| D | 8 | 195 | 1942858 | 12460.54 | 633 | 615 | 155.9 |
| D | 7 | 80 | 854478 | 5477.99 | 633 | 615 | 155.9 |
| D | 10 | 118 | 405394 | 2596.88 | 633 | 615 | 155.9 |
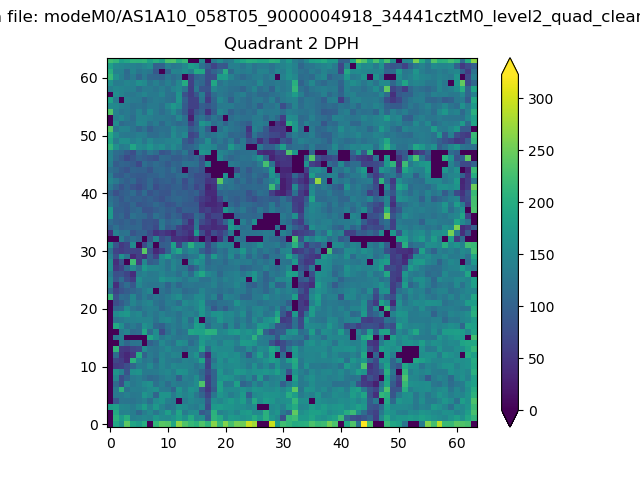
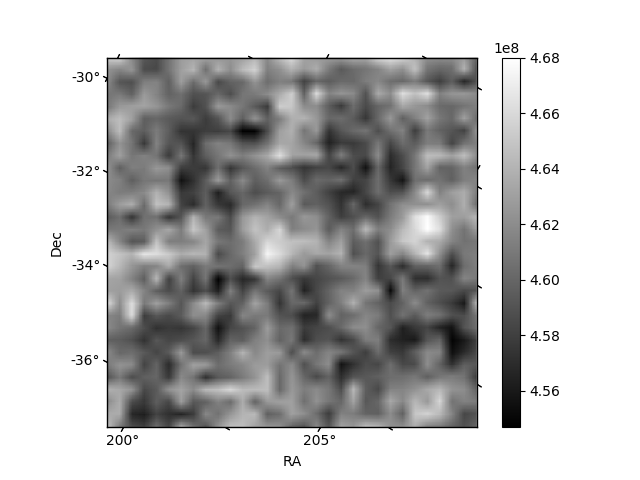
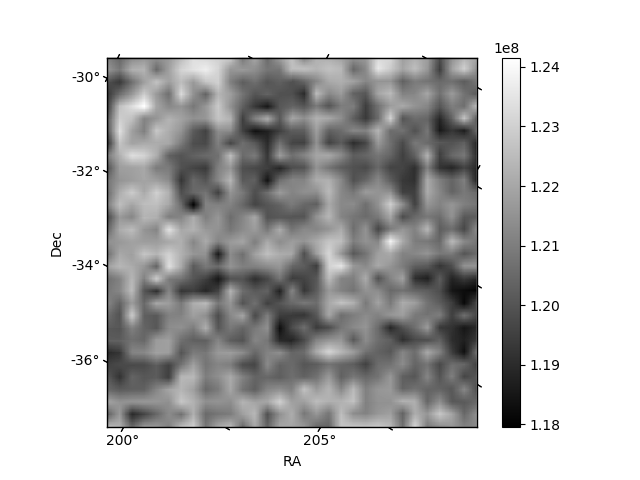
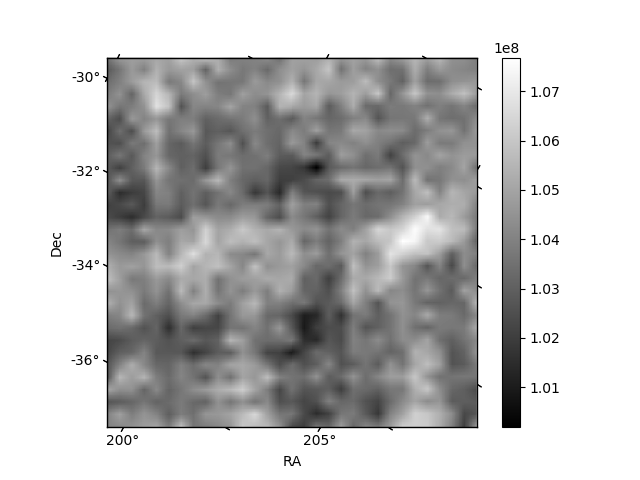
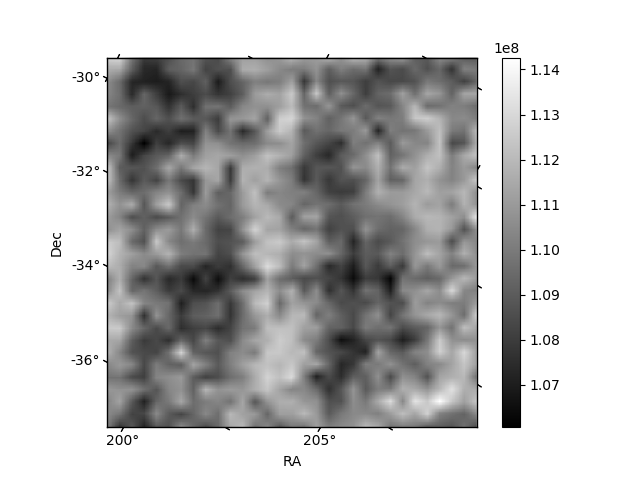
Histogram calculated using DETX and DETY for each event in the final _common_clean file
| Quadrant A | 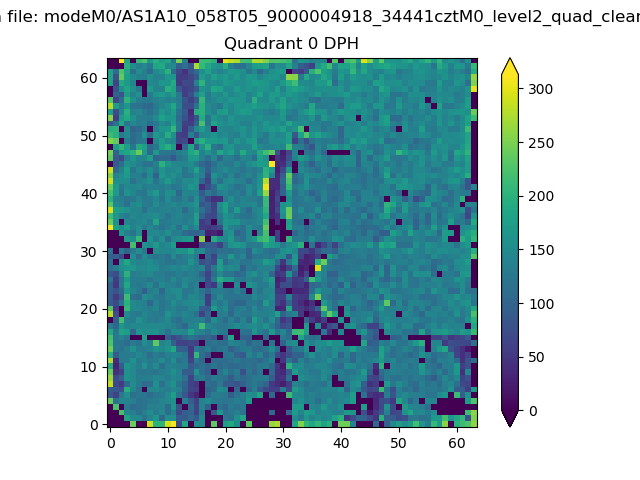 |
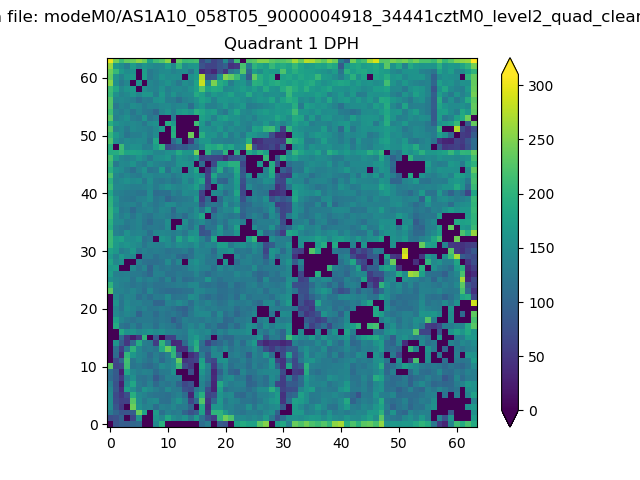 |
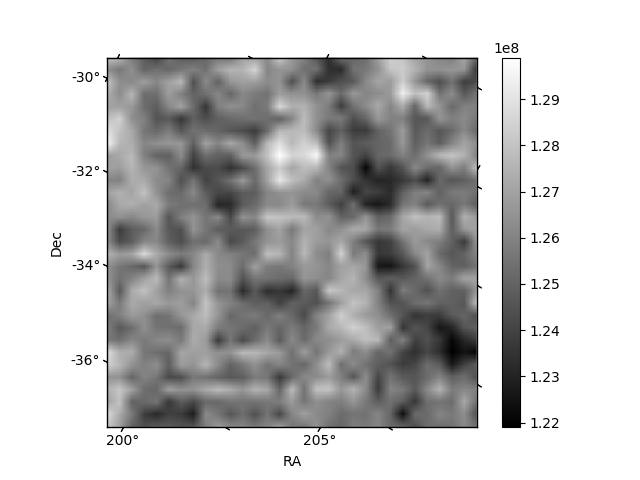
Quadrant B |
|---|---|---|---|
| Quadrant D | 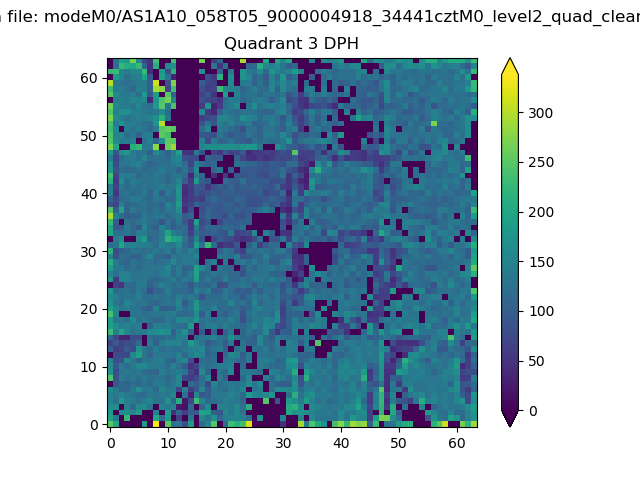 |
 |
Quadrant C |
| Plot type | Count rate plots | Images |
|---|---|---|
| Comparison with Poisson distribution Blue bars denote a histogram of data divided into 1 sec bins. Red curve is a Poisson curve with rate = median count rate of data. |
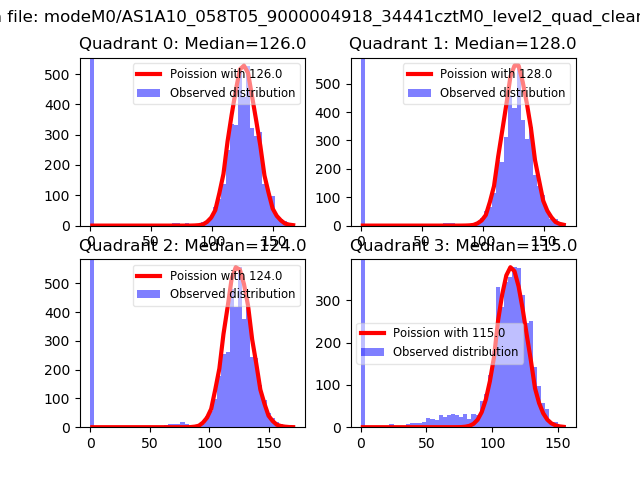 |
 |
| Quadrant-wise count rates Data is divided into 100 sec bins |
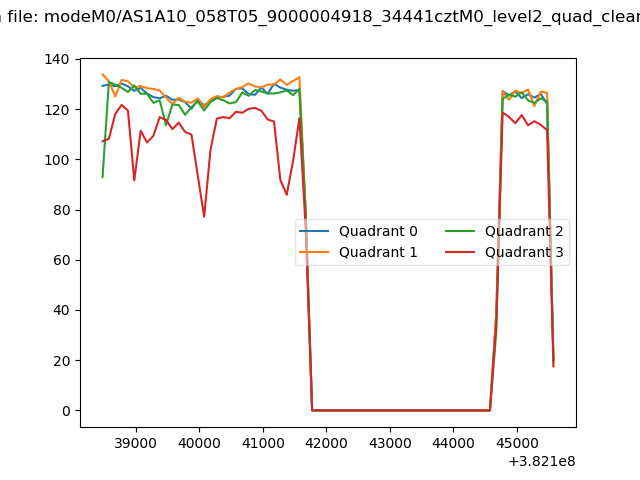 |
|
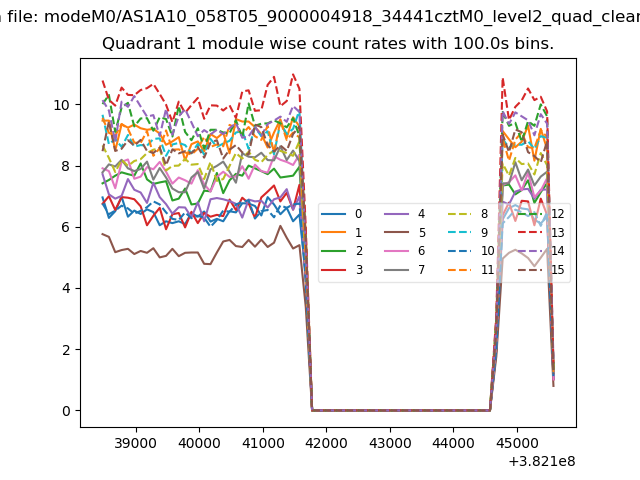
| Module-wise count rates for Quadrant A Data is divided into 100 sec bins |
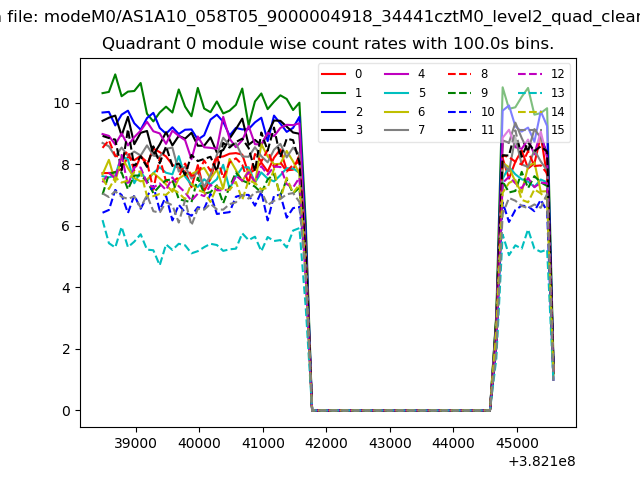 |
 |
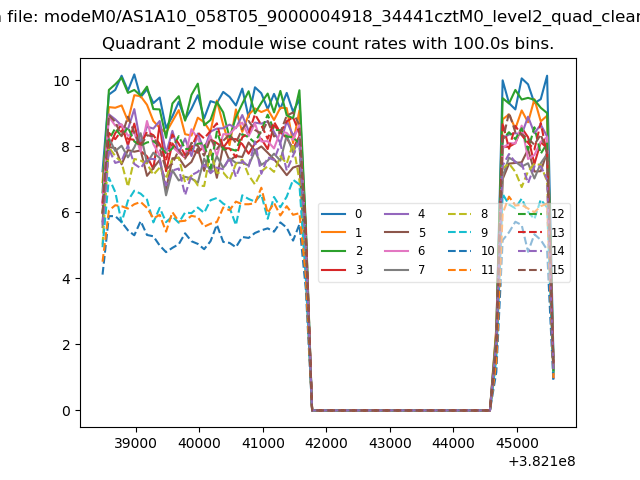
| Module-wise count rates for Quadrant B Data is divided into 100 sec bins |
 |
 |
| Module-wise count rates for Quadrant C Data is divided into 100 sec bins |
 |
 |
| Module-wise count rates for Quadrant D Data is divided into 100 sec bins |
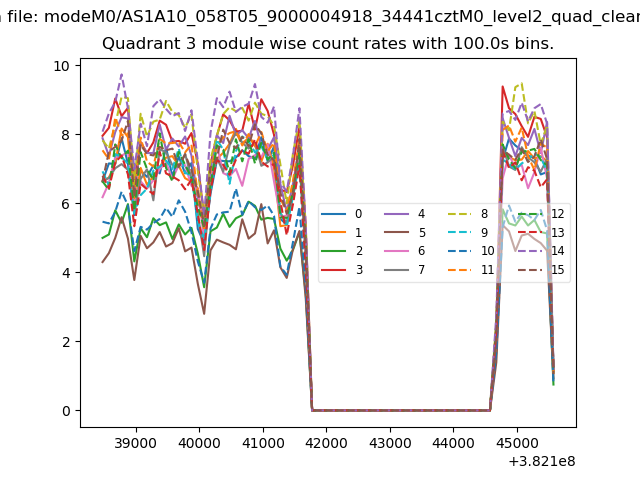 |
 |
| Parameter | Plot |
|---|---|
| CZT HV Monitor | 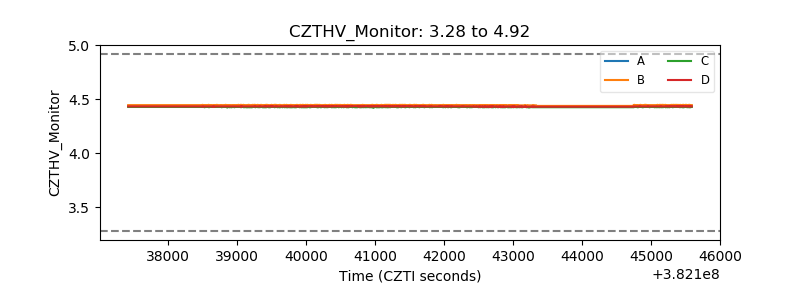 |
| D_VDD | 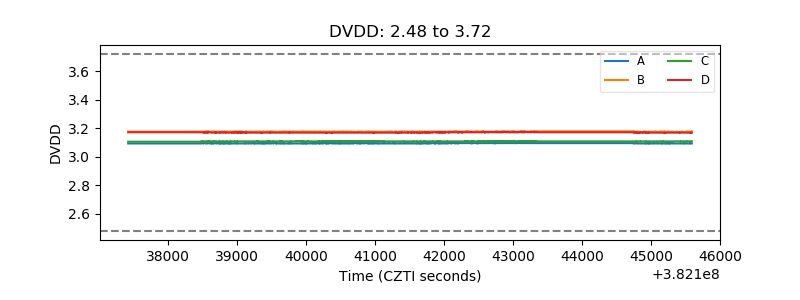 |
| Temperature 1 | 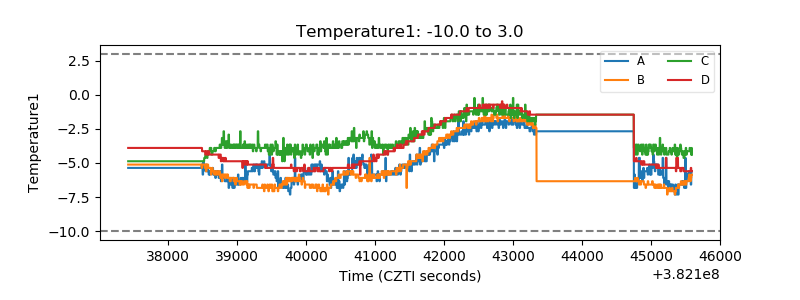 |
| Veto HV Monitor | 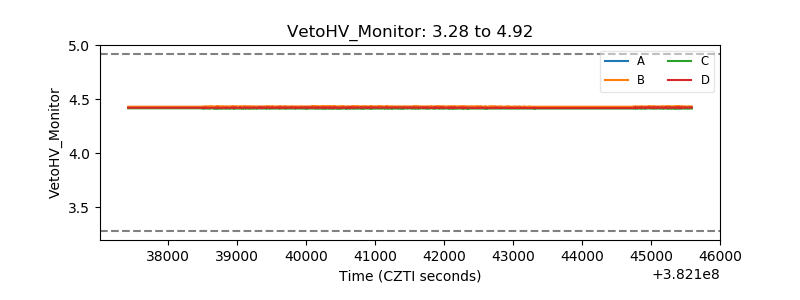 |
| Veto LLD | 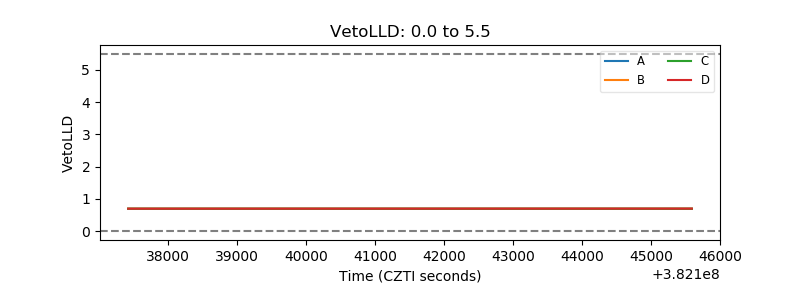 |
| Alpha Counter | 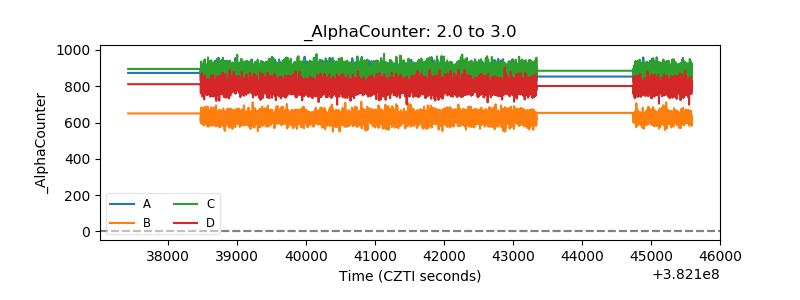 |
| _CPM_Rate | 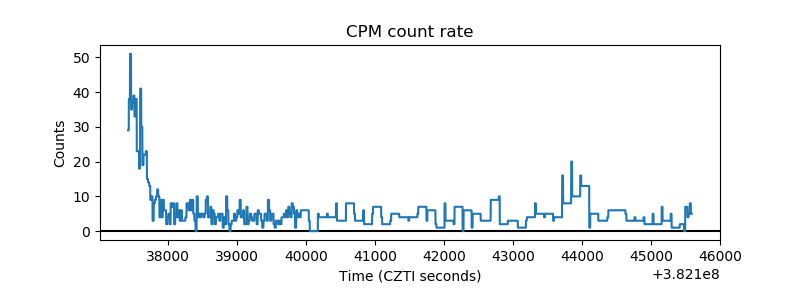 |
| CZT Counter | 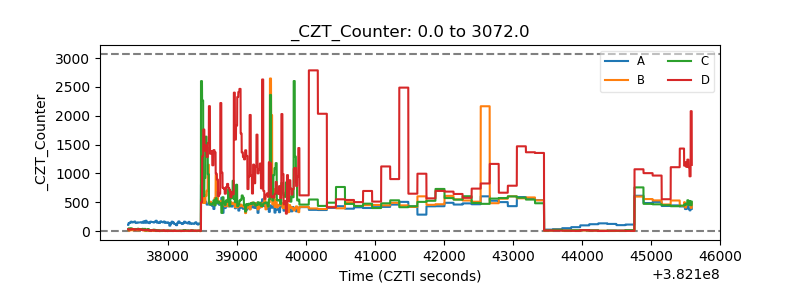 |
| +2.5 Volts monitor |  |
| +5 Volts monitor | 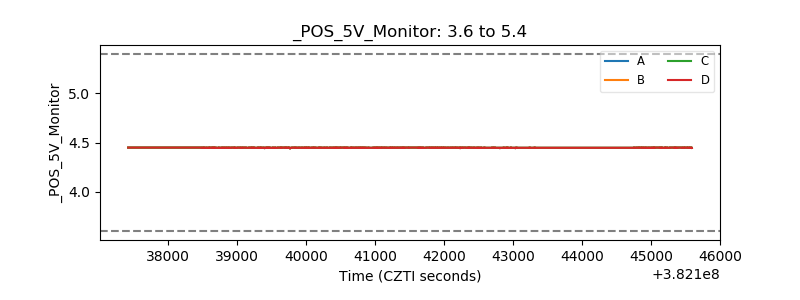 |
| _ROLL_ROT | 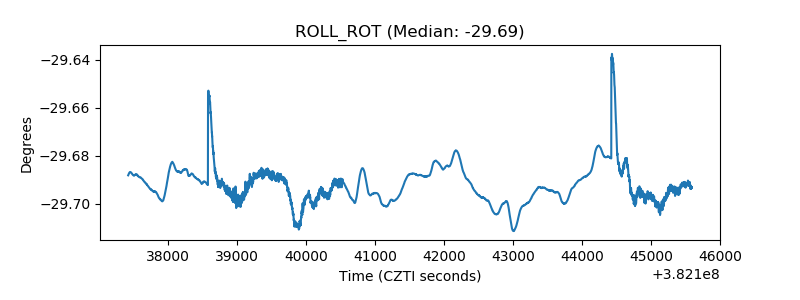 |
| _Roll_DEC | 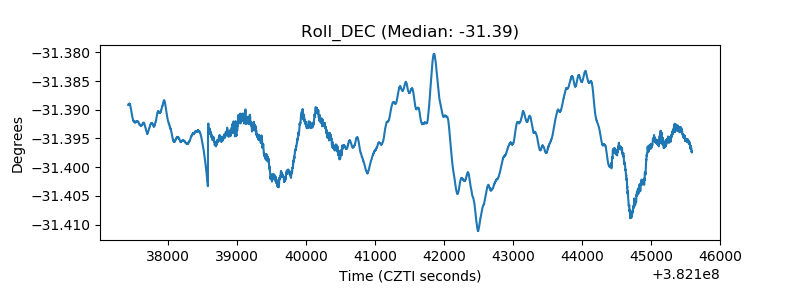 |
| _Roll_RA | 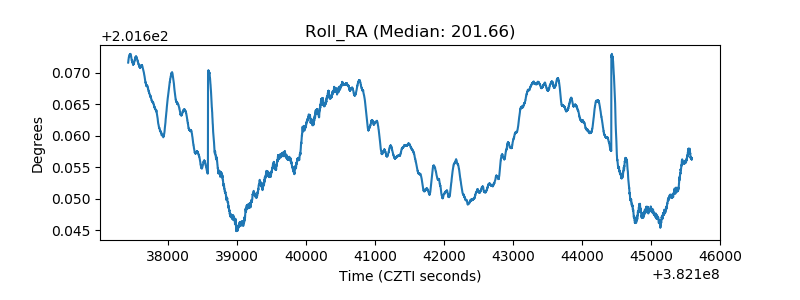 |
| Veto Counter | 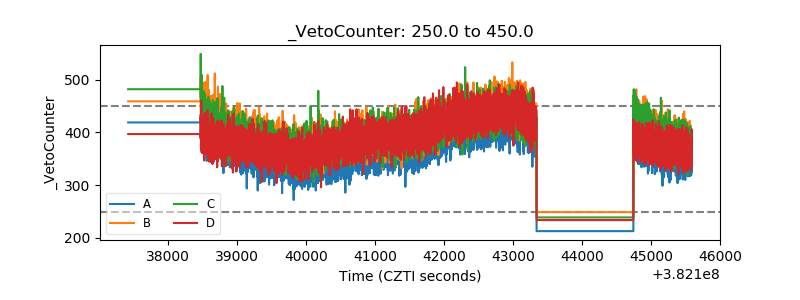 |